
Using the Garmin Power Guide: Lake Tahoe Review
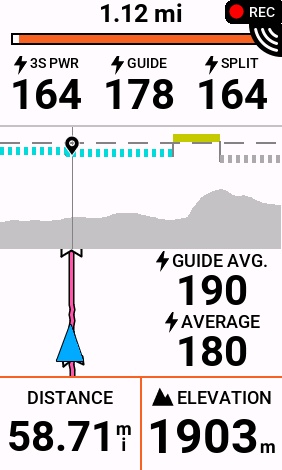
Breaking 4 Hours Around Lake Tahoe: A Deep Dive Into Garmin Connect Power Guide, Physics vs. Physiology, and the 285-Watt Threshold Mistake By Richard Wharton Using the Garmin Connect Power Guide to pace an endurance ride around Lake Tahoe offers a fascinating study in cycling analytics. Indeed, this loop is one of the premier endurance […]
Physiology First Cycling Coaching: How Masters Athletes Over 65 Master High-Intensity Training in the VQ Velocity Studio
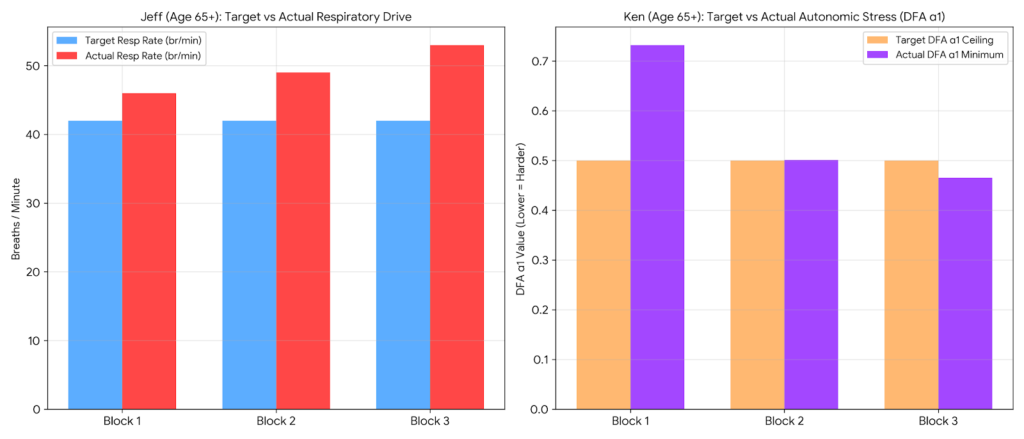
Age is Just a Number: How Two Masters Athletes Over 65 Master ‘Physiology First’ in the VQ Velocity Virtual Studio There is a pervasive myth in cycling that once an athlete crosses age 65, high-intensity training becomes too risky or unproductive. The popular narrative suggests older cyclists should stick strictly to low-intensity cruising. However, by […]
Breaking the Plateau: How Step-Up Intervals Unlock Deep Vo2 Kinetics
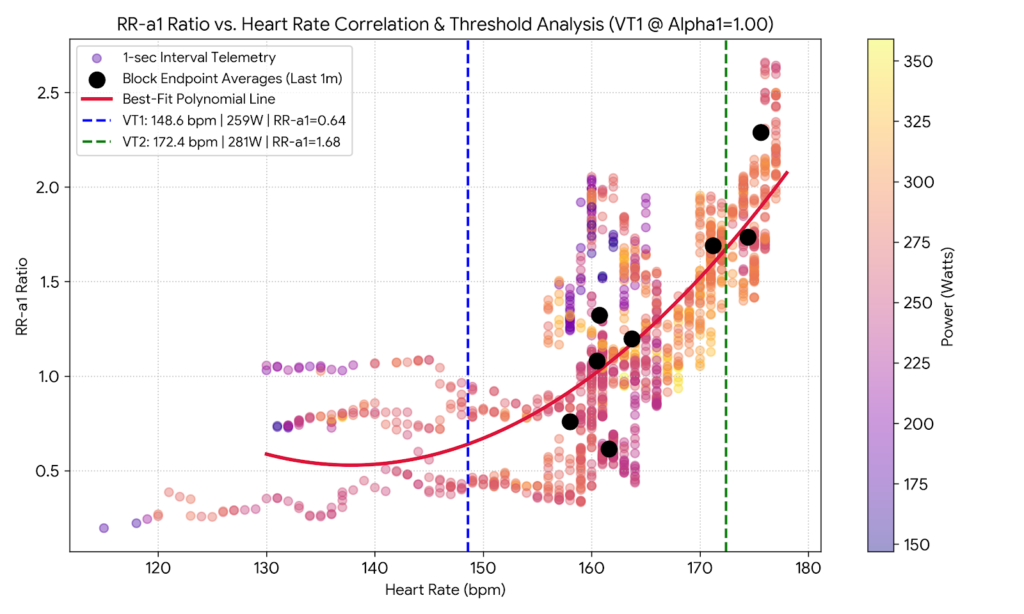
Breaking the Plateau: How Step-Up VO2 Max Intervals Unlock Deep Oxygen Kinetics By Richard Wharton | OnlineBikeCoach.com Executing step-up VO2 max intervals is one of the most effective strategies I use to drive time near maximal oxygen uptake without causing premature neuromuscular exhaustion. Standard flat-power VO2 max sets often result in either a slow […]
Trust Your Physiology First: Real-Time VO2max Pacing with AlphaHRV and Moxy
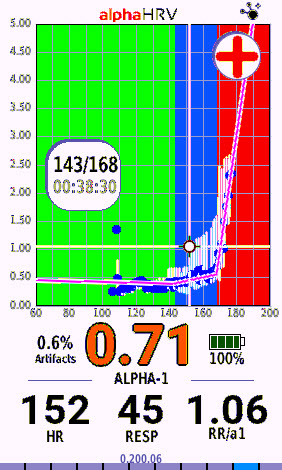
Trust Your Physiology First: Real-Time VO2max Pacing with AlphaHRV and Moxy By Coach Richard Wharton | Published: September 4, 2026 | Online Bike Coach AlphaHRV Vo2Max Training allows athletes to bypass static, pre-set heart rate zones and monitor live autonomic stress as it happens on the bike. Every morning we clip into the pedals, our […]
Mastering Garmin Performance Condition: Decoding Autonomic Stability and Aerobic Coherence Through Strategic Hydration
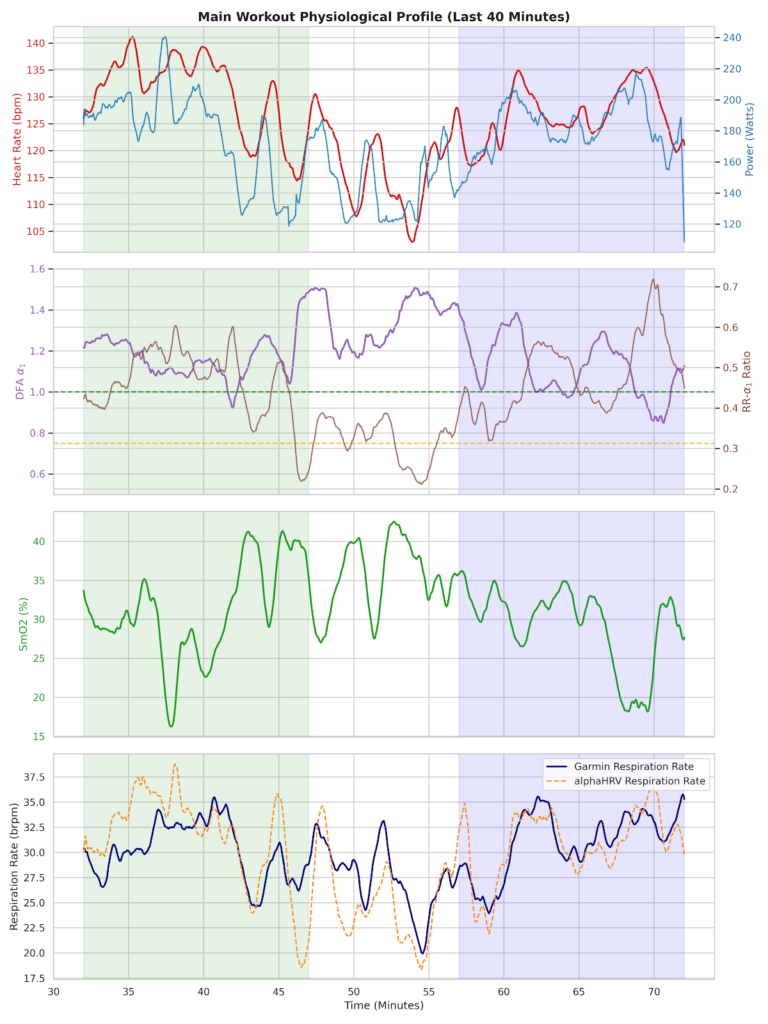
Mastering Garmin Performance Condition: Decoding Autonomic Stability and Aerobic Coherence Through Strategic Hydration For any cyclist serious about internal metabolic load, optimizing your training relies heavily on advanced metrics like Garmin Performance Condition tracking. Far more than a transient number that pops up ten minutes into your ride, it serves as a real-time metabolic voltmeter. […]
When “Easy” Power Isn’t Easy: A VO2 Master Data Deep Dive
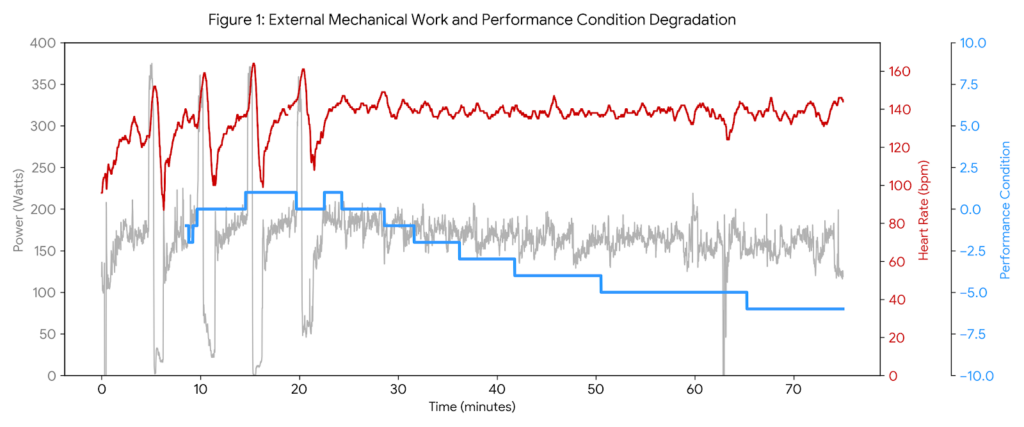
Analyzing VO2 Master data reveals a stark reality check from my ride this Friday morning. I expected a straightforward, low-intensity recovery base day. Instead, my body gave me a loud warning. Even though I intentionally kept my external intensity low, the internal cost of the ride was exceptionally high. This ride is a textbook example […]
Draining the Voltmeter: A 5 AM Lesson in Under-Fueling and Autonomic Collapse
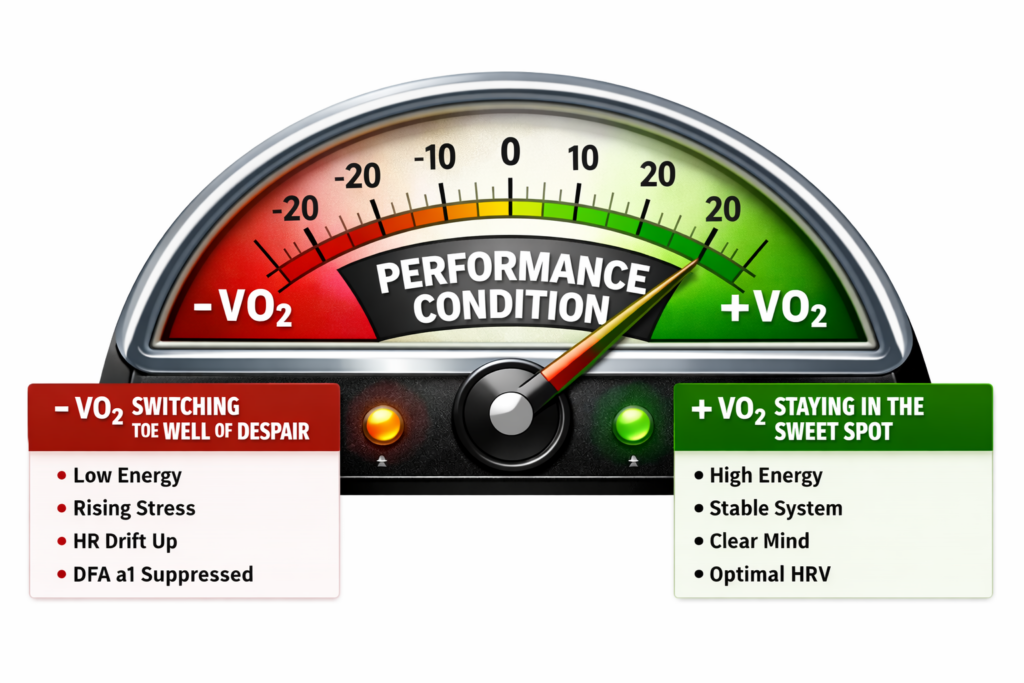
Forget Your Software’s Threshold: Your Physiology Rewrites the Rules in Real Time We’ve all been conditioned to treat our threshold like a monument carved in stone. Your bike computer, your smartwatch, or your coaching software gives you a single, static number—say, a functional threshold power (FTP) of 250W or a threshold heart rate of 162 […]
Stop Ignoring Garmin Performance Condition: How to Use It as a Real-Time Health Governor
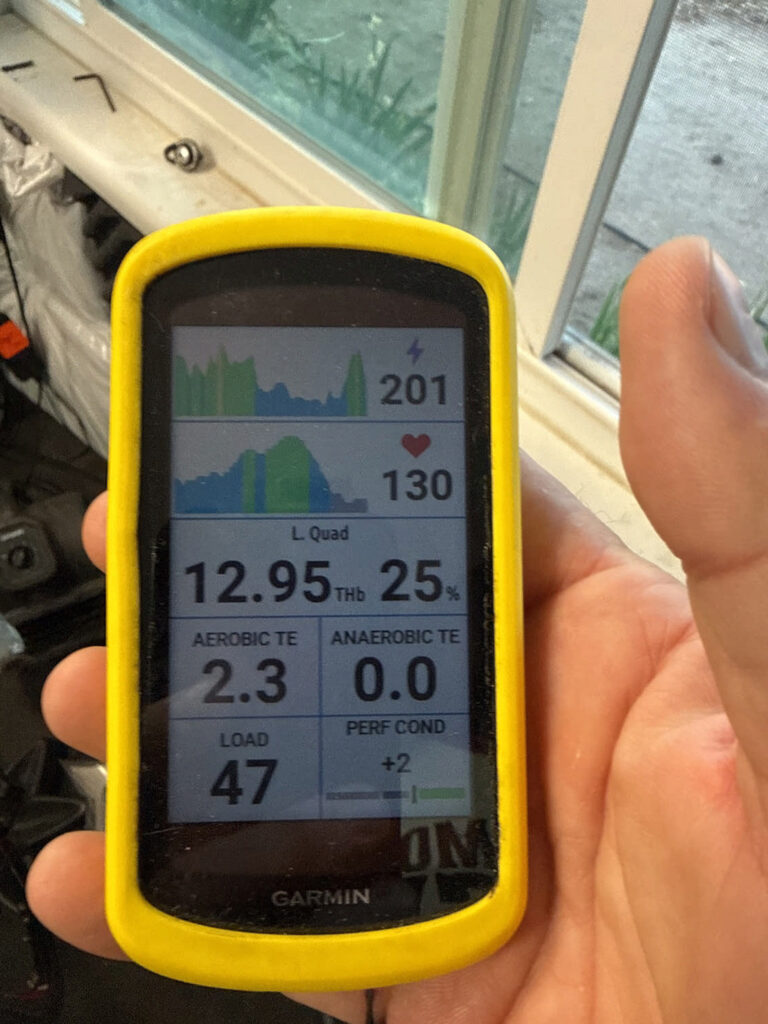
How I Used Performance Condition to Stay Healthy on Today’s Base Ride This morning’s ride wasn’t about speed or hero watts. It was about physiology, recovery, and learning how to leverage Garmin Performance Condition to protect my autonomic system. For the first time, I used this real-time metric as the primary governor for the entire […]
Real-Time Decompensation: Decoupling and the Anatomy of My Failed Workout
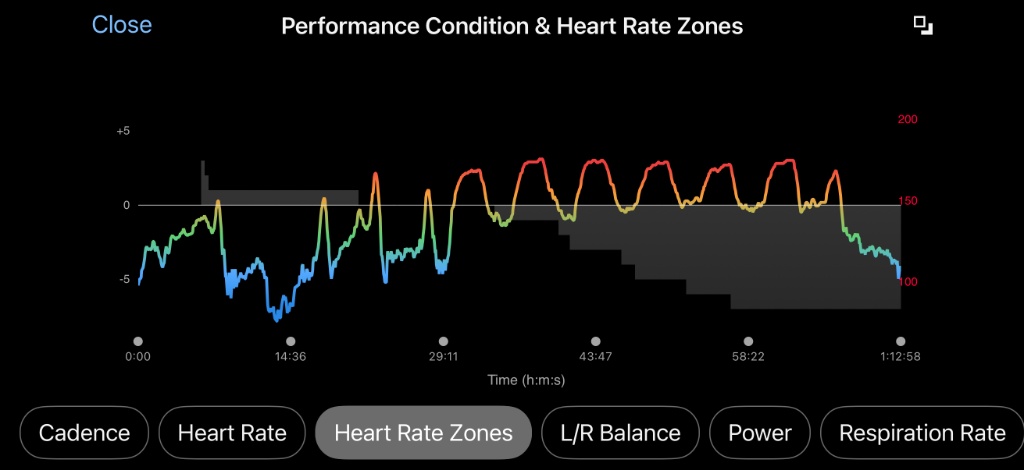
Every endurance athlete knows the feeling of hitting a wall, but few can see it coming down the track with mathematical precision, which is why monitoring your Garmin Performance Condition is so vital during hard blocks. Yesterday, I set out to complete a critical high-intensity maintenance block: 7×3-minute VO2max intervals targeting north of 270 watts. […]
The Dissociation of the Internal and External Relays: Why a ‘Physiology First’ Approach Rules Ronnestad Intervals
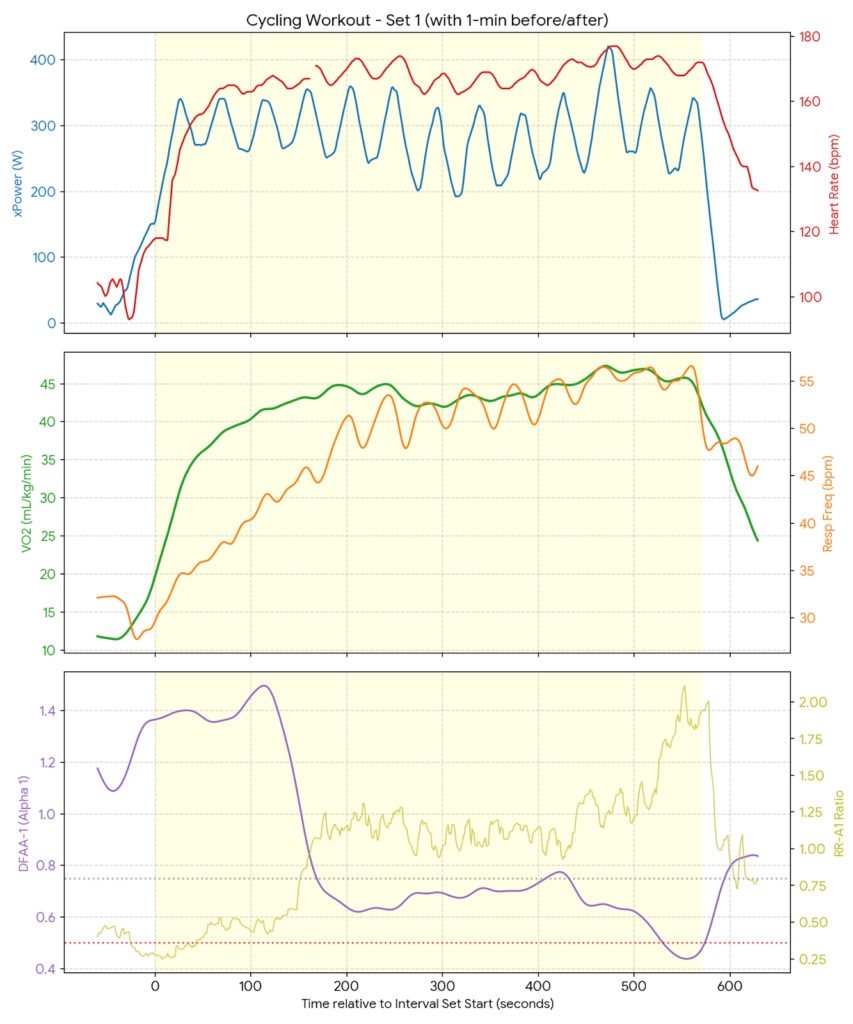
The Dissociation of the Internal and External Relays: Why a ‘Physiology First’ Approach Rules Ronnestad Intervals By Richard Wharton | Onlinebikecoach.com As coaches and hard-charging endurance athletes, we often fall into a trap. Specifically, we let external metrics dictate our training success. For example, we program an interval at a static target wattage. Next, we […]