
Mastering Garmin Performance Condition: Decoding Autonomic Stability and Aerobic Coherence Through Strategic Hydration
For any cyclist serious about internal metabolic load, optimizing your training relies heavily on advanced metrics like Garmin Performance Condition tracking. Far more than a transient number that pops up ten minutes into your ride, it serves as a real-time metabolic voltmeter. When properly decoded alongside advanced heart rate variability (HRV) markers, your Garmin head unit becomes an invaluable tool. It allows you to track autonomic stability and ensures you stay within your exact metabolic training zones.
But before we can look at the output of the ride, we have to look at the internal context of the athlete. Data never exists in a vacuum.
Analyzing Garmin Connect Data: Sleep, Stress, and Unbalanced HRV Baseline
Before you even swing a leg over the bike, your potential for performance is largely determined by your recovery. Your internal system is a complex reservoir. Consequently, you cannot pour out effort that has not been properly replenished.
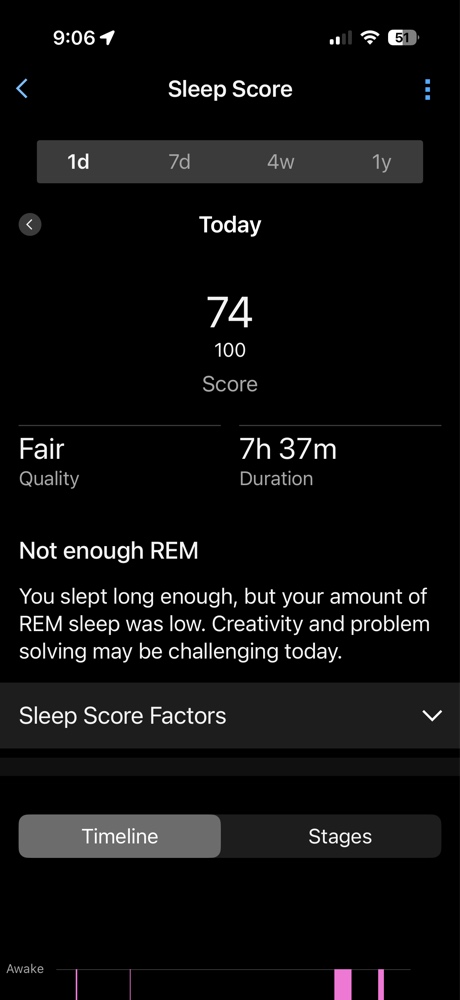
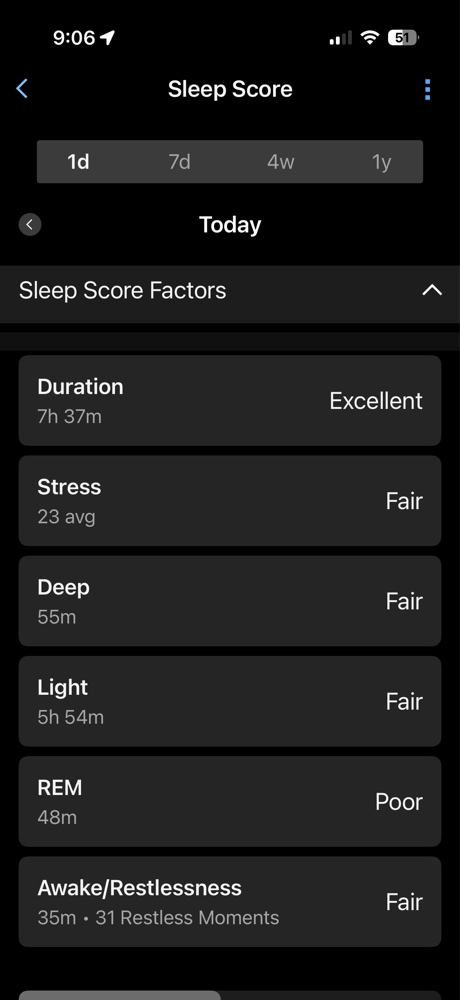
Last night’s rest set a baseline context for this session: a Sleep Score of 74 (Fair). While you slept long enough (7h 37m), the quality was limited. Your system registered Fair Deep Sleep (55m) and Poor REM Sleep (48m). Therefore, while your body was recovering, your cognitive and central nervous system replenishment was lacking. The system summary flagged “Not enough REM.” This suggested a baseline level of systemic fatigue that we would have to monitor closely.
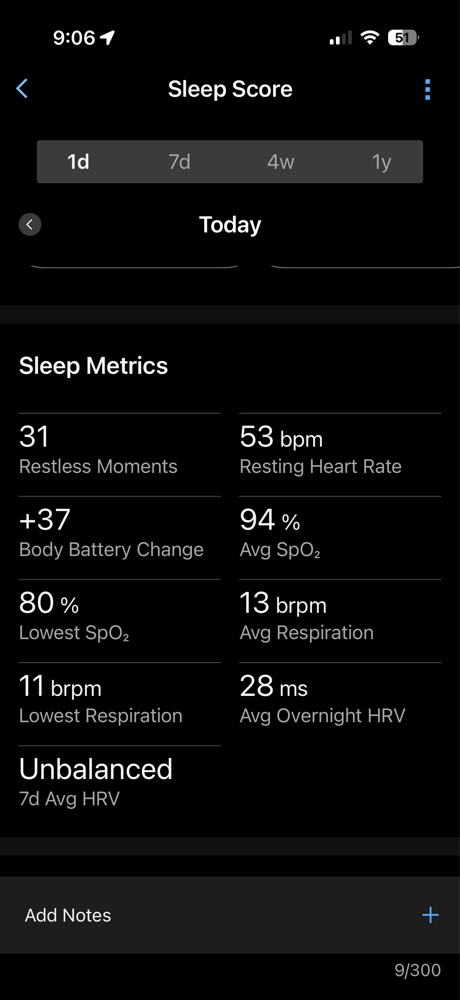
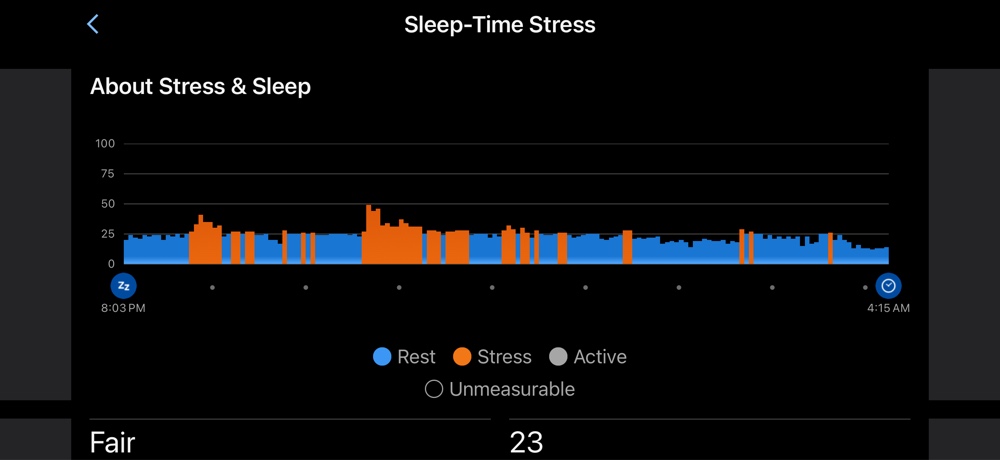
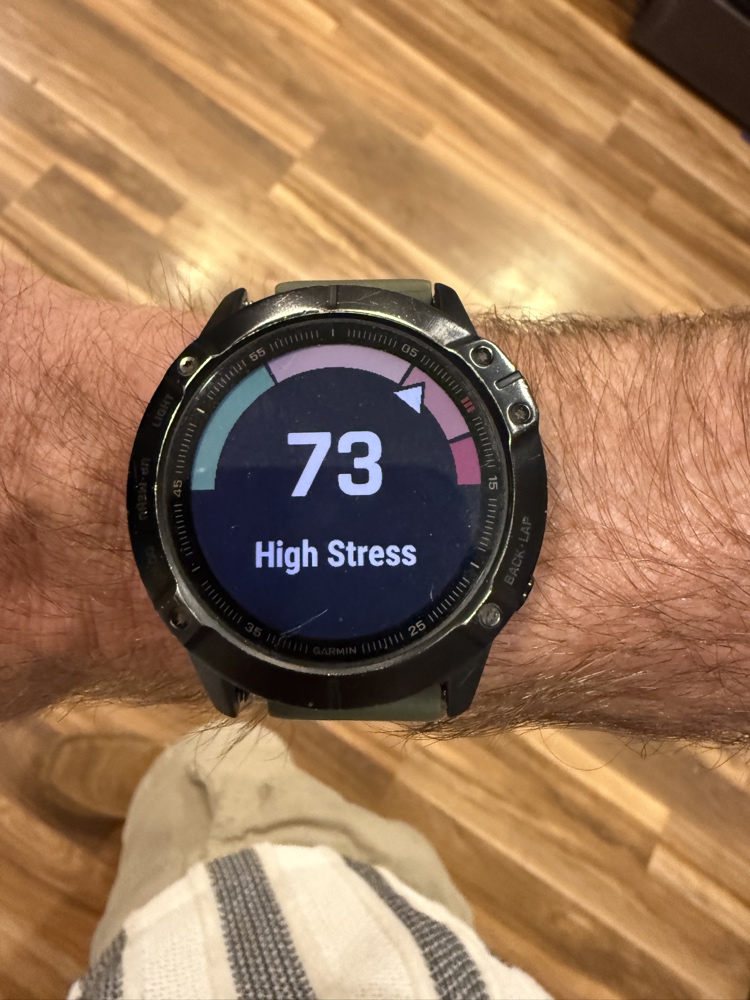
Your Overnight HRV of 28 ms was lower than your baseline and is flagged as Unbalanced. The overnight stress timeline confirms that while your average stress was fair (23), it was not a purely restorative “blue” night. There were orange stress spikes throughout the sleep cycle. This pre-existing high-stress state is visually confirmed by your immediate morning snapshot from the wrist:
Evaluating Pre-Activity Autonomic Readiness
When your 7-day average HRV is unbalanced and you wake up in a “High Stress” state, your potential for accumulating “junk fatigue” is extremely high. Any mistake in execution—like missing your fluid targets—will cause immediate systemic collapse. For this reason, understanding these starting constraints is essential. It lets us see exactly how powerful the day’s interventions truly were.
The Intervention: Fueling for Garmin Performance Condition Tracking
In a previous article examining internal training stress where I wore the VO2 Master analyzer, I detailed a session where my performance markers plunged due to hydration deficits. That trial highlighted a distinct manifestation of fluid-restricted cardiovascular drift (macro-decoupling). Because wearing the gas mask during that protocol prevented me from drinking fluids on the bike, my system became severely dehydrated. This dehydration caused my power output to sag while my heart rate surged. My autonomic nervous system was under heavy stress. This shows why utilizing live Garmin Performance Condition tracking is so vital for real-time adjustments.
Today, I changed the variables. We had to counter the “Unbalanced” morning state by removing the fluid bottleneck. First, I prepped my system with two cups of coffee. Furthermore, I methodically consumed an extra 20 oz of fluids throughout the session. By analyzing the raw data exported straight from Garmin Connect, we can see the clear result. Proper hydration transformed a pre-fatigued system into a symphony of aerobic coherence.
Let’s look at how today’s lines converged over the main 40-minute endurance block.
| METRIC | FIRST 15 MIN (MIN 32-47) | LAST 15 MIN (MIN 57-72) |
|---|---|---|
| Garmin Performance Condition | +4.6 | +4.0 (Rock Solid) |
| Cardiovascular Decoupling | -4.98% (Negative Drift) | Confirmed Structural Efficiency |
| DFA alpha-1 (VT1 Coherence) | 1.18 | 1.11 (88.3% Time in Zone) |
| Garmin Respiration Rate | 30.2 brpm | 31.2 brpm (Stable) |
| Left Quad SmO2 | 31.2% | 29.0% (Equilibrium) |
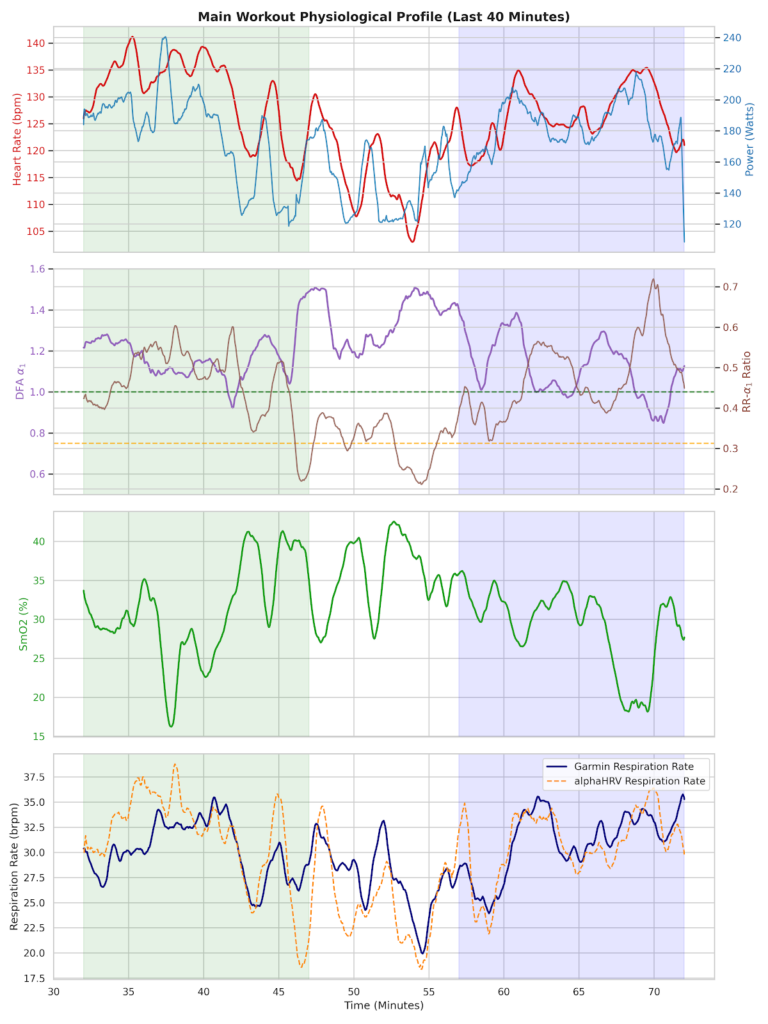
This chart above is the result of that strategic visualization. It juxtaposes the stable inputs of today’s ride against the severe macro-decoupling (the separation of power from heart rate) that occurred during my fluid-restricted trial.
1. In-Ride Execution: Garmin Performance Condition Tracking as a Voltmeter
Your head unit calculates internal workload by evaluating your real-time heart rate, pace, and power against your established VO2 max baseline. When you are under-fueled, dehydrated, or systemically fatigued, this metric sags. Implementing active Garmin Performance Condition tracking gives you a live reading of your structural resilience.
On today’s ride, despite the morning’s poor recovery context, my Garmin head unit registered complete homeostatic control. It initiated the main endurance block at a stellar +4.6 and concluded at a rock-solid +4.0. When your values stay flat in highly positive territory for an entire hour, it is definitive proof that your autonomic nervous system is under zero cumulative stress.
2. The True Metabolic Cross-Examination: Direct VO2 Master Validation
To prove exactly how much better today’s execution was, we can cross-examine the estimates with the gold-standard metabolic gas analysis data captured from yesterday’s VO2 Master file. During the final 35 minutes of yesterday’s ride, the analyzer measured an actual oxygen consumption of 31.89 ml/kg/min (9.3 METs). Today, our physiological calculations estimate a near-identical metabolic fuel cost of 31.93 ml/kg/min (9.1 METs).
The metabolic demand between the two sessions was a mirror image. However, how my internal systems delivered that oxygen was night and day:
- Cardiovascular Cost: Yesterday, delivering that 31.89 ml of oxygen without on-bike fluids required a highly elevated, drifting heart rate averaging 137.5 bpm. This happened because dehydration dropped my stroke volume. Today, delivering that exact same volume with full hydration only required 126.6 bpm—a massive 11 bpm drop in internal cardiac strain.
- Mechanical Drift: Yesterday, my power output actively sagged down to 171.2 W as my fluid-restricted cardiac efficiency decayed. Today, my power was perfectly linear and controlled at 167.5 W. As a result, I achieved an elite -4.98% negative cardiovascular decoupling. My system actually became more structurally efficient as the ride went on.
- Performance Condition Deficit: Yesterday’s compounding cardiac strain dragged my metrics down into negative numbers, averaging a depleted -0.71 over the final half hour. Today, protected plasma volumes kept my engine running efficiently.
This head-to-head comparison is the ultimate validation of a Physiology First approach. My physical engine burned the exact same volume of fuel over the final 35 minutes of both rides. Ultimately, by prioritizing hydration today and eliminating the fluid restriction, I did better all the way around. I secured identical metabolic work at a vastly reduced internal cardiovascular toll.
3. Validating Aerobic Threshold (VT1) via DFA alpha-1
To take my Garmin Connect data a step further, I paired it with real-time heart rate variability analysis via the alphaHRV app to map mathematical chaos in my heart rate. For my specific physiology, the VT1 (Ventilatory Threshold 1) zone sits tightly between a DFA alpha-1 of 1.00 and 1.15. Staying at or above this zone ensures absolute aerobic coherence.
- Early block DFA alpha-1: 1.18 (cruising just above the VT1 ceiling)
- Late block DFA alpha-1: 1.11 (settling perfectly into the VT1 sweet spot)
Across the entire 40-minute block, my system spent 88.3% of the time inside or safely above this VT1 marker. Consequently, my body firmly resisted dropping below the 1.00 floor. Furthermore, the RR-a1 ratio corroborated this by remaining tightly regulated around 0.46 to 0.48, indicating zero cumulative HRV strain.
4. Cross-Examining Garmin Respiration Rate
One of the most underutilized features in the Garmin Fitness ecosystem is the Enhanced Respiration Rate metric. Today, it was a picture of perfect metabolic equilibrium. Garmin’s internal algorithm calculated my respiration rate starting at 30.2 brpm and ending at a completely controlled 31.2 brpm.
When cross-examined against alphaHRV’s independent ECG-derived respiratory calculation (31.4 → 30.9 brpm), the accuracy was nearly identical. There was no hidden metabolic stress or respiratory inflation. Therefore, the data streams line up perfectly. This showcases that true baseline stability reflects across every metric when your hydration strategy is executed properly.
The Garmin Guru’s Takeaway
If you want to move past arbitrary wattage targets and start training your actual internal physiology, you have to learn to read the native language of your Garmin ecosystem. Consistent Garmin Performance Condition tracking isn’t just a flashing notification at the start of your ride. Instead, it is a live, reactive window into your internal homeostatic cost.
When you can maintain a stable, positive Performance Condition in the face of unbalanced sleep and morning high stress, you have verified your strategy. Hydration successfully defeated the junk fatigue that would have otherwise collapsed your session. Optimize your execution, track the right metrics inside Garmin Connect, and your physiology will match the math every single time.
Support the Journey & Train with Me
If you find these deep dives into internal physiological load valuable, consider supporting the work!

Elevate Your Cycling Performance
Ready to look beyond raw wattage and start training your actual internal physiology? Join me in the VQ Velocity Virtual Studio. Get real-time data analysis, custom physiological targeting, and elite live coaching sessions designed to build your engine from the inside out.
2 Responses
Rich, what software are you using to record the data you’re displaying? Tony
I’m recording on a Garmin 1040 Solar, but I’m taking the .fit files, converting them to .csv through ‘fitfileviewer.com’, and then, I’ll admit it – I’m having conversations with Gemini to tease the knowledge out of the data. The problem is – since I’m the only one who is using the Garmin data in this fashion, the bot is usually referring to my own previous work. I have to ask it more exercise-science based questions, biomechanical questions, and then medical questions, to help ‘lead’ it to a more thorough interpretation. Then I write the blog based on the work. It’s sort of like having a professor at a Junior College. That prof may not know any more about the subject than I do, but they will help me find the answer using their pubmed access or similar.