
The Dissociation of the Internal and External Relays: Why a ‘Physiology First’ Approach Rules Ronnestad Intervals
By Richard Wharton | Onlinebikecoach.com
As coaches and hard-charging endurance athletes, we often fall into a trap. Specifically, we let external metrics dictate our training success. For example, we program an interval at a static target wattage. Next, we look down at our head unit. If the number matches, we declare victory. However, this “wattage-first” mentality misses the real story. Therefore, to truly unlock high-performance potential—both for myself and for my virtual studio clients—we must pivot. We need a Physiology First cycling approach that prioritizes internal metabolic markers over external power outputs.
Adopting a Physiology First framework means analyzing the actual internal stress of the body. Consequently, this data guides how we prescribe, execute, and evaluate intervals. When we map out internal strain against external output, the results are clear. We reveal a profound dissociation between what the legs produce and what the metabolic systems endure.
To see this framework applied live to high-intensity interval metrics, check out this diagnostic video resource on Moxy Monitor & SmO2 Interpretation.
The Telemetry of Systemic Suffocation in Physiology First Cycling
During a recent maximum-effort block of 3 sets of 13 Ronnestad 30-15 intervals, I leveraged a complete telemetry stack to measure what was happening under the hood. The overall session parameters display a body pushed to its absolute limits. Ultimately, this highlights the immense value of tracking biomarkers over pure wattage:
- Time Above 170 BPM: 412 seconds (~6.9 minutes). This load concentrated heavily in the latter half of the session due to severe cardiovascular drift.
- Time Above 44 Breaths/Min: 388 seconds (~6.5 minutes). This volume signals the onset of hyperpnea. As a result, respiratory rate (fR) takes over to forcefully clear CO2.
- Time Below 0.5 DFA α1: 1,124 seconds (~18.7 minutes). Because the autonomic nervous system undergoes a delayed recovery, my DFA α1 remained completely crushed. This suppression lasted well into the 15-second micro-recoveries and set breaks.
The Physiology First Cycling Telemetry (73.0 kg Baseline)
| Metric | Set 1 (13 Reps) | Set 2 (13 Reps) | Set 3 (13 Reps) |
|---|---|---|---|
| xPower (W) | 298.3 | 274.3 | 262.8 |
| Average HR (BPM) | 165.7 | 166.0 | 162.7 |
| Avg Respiratory Rate (br/min) | 48.7 | 51.1 | 50.5 |
| DFA α1 (Last 7 Mins) | 0.66 | 0.58 | 0.55 |
| Estimated VO2 (mL/kg/min) | 49.8 | 45.0 | 43.7 |
| Work Interval SmO2 Average (%) | 7.1% | 9.5% | 10.1% |
| Work Interval THb Average (g/dL) | 13.03 | 13.05 | 13.03 |
Visualizing Internal Stress: Multi-Sensor Analytics
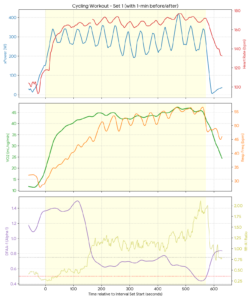
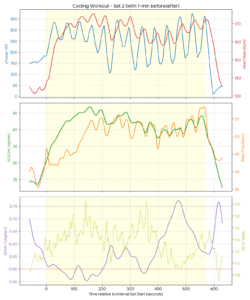
The chart below breaks down each individual Ronnestad set from the workout data file. It charts the interplay between the external work (gray lines) and internal physiological systems. Furthermore, it provides an excellent visual blueprint for Physiology First cycling applications:
1. Cratered into the Single Digits: Extreme Mitochondrial Extraction
The defining revelation of a Physiology First cycling approach is found in the deep muscle de-oxygenation. For example, average cyclists might see their muscle oxygenation drop to 30% or 40% under strain. However, my left quad oxygenation cratered deeply into the single digits. It averaged a stark 7.1% in Set 1, 9.5% in Set 2, and sustained severe local desaturation all the way through the back half of the workout.
To the uninitiated, single-digit muscle oxygenation looks like a failure of oxygen delivery. But to a coach, it is the ultimate badge of honor. It confirms exceptional mitochondrial density. Because of years of structural aerobic adaptations, the localized extraction engine behaves like a high-powered vacuum. The millisecond a heavy severe-domain load hits the pedals, the dense mitochondrial web instantly rips every available O2 molecule off the passing hemoglobin channels. Therefore, local demand completely outstrips systemic delivery within seconds. Ready to capture your own muscle saturation profiles? You can equip your sensor ecosystem directly via the Moxy Monitor Official Store.
2. The Mathematical Discrepancy: True Metabolic Demand vs. Hardware Calibration
When checking the initial metabolic data from this workout, a massive red flag popped up: the gas exchange cart reported VO2 averages hovering below expectations. However, applying a strict mathematical reality check based on the standard ACSM metabolic equation for a 73.0 kg rider reveals the truth. To sustain a punishing mean mechanical output of 289.6 Watts during Set 1 actually requires a true systemic oxygen demand of **49.8 mL/kg/min**.
The fact that the hardware recorded significantly less is a beautiful, real-world case study in telemetry validation. In this case, an aging galvanic O2 sensor cell—having lost nearly 47% of its raw electrical resolution bandwidth over 20 months of heavy service—simply compressed the signal. When breathing frequencies exceed 50 breaths per minute during dense 30-15 blocks, a degraded sensor loses its dynamic velocity range and flattens the metabolic output. By employing a “Physiology First” lens, we can look past hardware calibration drift, recalculate the thermodynamic reality of the work, and realize that the actual cardiorespiratory stress achieved was north of **14 METs**.
3. The 15-Second Miracle: Locked THb & High-Pressure Re-priming
Look closely at the Total Hemoglobin (THb) baseline. Notably, it stays completely fixed as a stable anchor at ~13.03 to 13.05 g/dL across all three sets. This stability is a vital diagnostic marker in Physiology First cycling. Specifically, it proves that there was zero localized mechanical occlusion. The muscle fibers did not clamp so tight that they physically squeezed blood out of the capillary bed. Furthermore, there was no venous pooling. The vascular highways stayed completely open.
Because the vascular bed remains open and THb stays stable, the partial pressure gradient for oxygen diffusion becomes massive. The exact moment you back off the gas for the 15-second micro-recovery, systemic arterial pressure forces fresh, oxygenated blood straight into the desaturated muscle tissue. Consequently, the rapid upward spikes in SmO2 during the 15-second rests are not a true recovery for your heart or lungs. Instead, they are a high-pressure, localized re-priming mechanism. This process resynthesizes phosphocreatine (PCr) just enough to survive the next 30-second onslaught.
4. Autonomic Coordination: DFA α1 and RR-A1
As the sets progress, watch the heart rate variability metrics closely. Early in Set 1, the autonomic system attempts to handle the stress. However, as metabolic byproducts accumulate, DFA α1 drops significantly from 0.66 down to a floor of 0.55 by Set 3. This progressive collapse confirms that the body has passed its respiratory compensation point (VT2) and is trending directly toward its true systemic threshold. The sympathetic drive completely overpowers parasympathetic control, anchoring the athlete in the severe-intensity training domain.
The Fuel Behind the Engine: High-Concentration Carbohydrate Delivery
Executing a brutal session like this requires more than just mental grit. It demands an aggressive, proactive fueling strategy to preserve cellular energy. For instance, over the course of this exact workout, I consumed 7 scoops of NBS Nutrition’s Carbo-Hydration mixed into 30 ounces of fluid. I have personally relied on NBS Nutrition’s Carbo-Hydration ecosystem for over 15 years, utilizing their precise carbohydrate profiles right alongside my regular baseline hydration strategies to successfully navigate elite metabolic loading.
This long-standing nutritional protocol radically altered the trajectory of these intervals. Furthermore, it protected my performance for three distinct reasons:
- Maintaining the Power Ceiling in Set 3: My xPower held strong at 262.8 Watts. In an under-fueled state, that third set would have fallen off a cliff due to central fatigue. However, by flooding my system with a high-osmolarity carbohydrate solution, I maintained high circulating blood glucose. This process successfully spared my liver and active muscle glycogen stores.
- Fueling the Respiratory Pump: I spent 388 seconds with a respiration rate north of 44 breaths per minute, eventually averaging over 50 breaths per minute by the final block. During this time, my intercostal muscles and diaphragm worked like absolute pistons. Therefore, delivering heavy carbohydrates ensured that both my legs and my lungs had immediate, easily oxidizable fuel. This kept the respiratory mechanics from becoming a bottleneck.
- Optimizing the 15-Second Recovery Dynamics: My SmO2 pinned in the single digits during the work phases. Because of this, the clearance of metabolic byproducts required massive active transport across cell membranes. High carbohydrate availability directly optimized the cellular hydration status. Consequently, it assisted the rapid clearance mechanisms that allowed me to drive my Garmin Stamina down to 15% without early mechanical breakdown.
Coaching Application of Physiology First Cycling
When you train clients from a Physiology First cycling perspective, you stop guessing based on heart rate or power targets alone. Instead, you design workouts like the Ronnestad 30-15 to exploit these exact properties. We use short, high-pressure metabolic adjustments to hold an athlete at their absolute ceiling of systemic oxygen consumption (VO2max) while preserving local muscular mechanics. Ultimately, by monitoring these biomarkers, we ensure our athletes squeeze every ounce of adaptation out of every single pedal stroke.
I’ve been a cycling coach since 1993, when I realized that there was no one available or willing to teach ME how to be a better bicyclist. My calling literally came from an Epiphany on AppleCross Pass in Scotland in May of 1992. For better or for worse, it’s been my complete and sole passion to help people learn how to bicycle, and fall in love with it as much as I have. If you want a LIVE, REAL, PERSONAL coach who will help YOU, intrinsically, then click either button and let’s get started. Thank you.
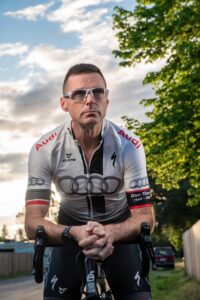
Coach Richard Wharton, leading the “Physiology First” charge since 1993.
2 Responses
Rich, an absolutely brilliant piece of work!! While I no longer cycle in favor of C2 SkiErg, continuing SuperSlow(™) based Nautilus, and, of all things, bilateral PacerPoles assisted “ted Nordic Hiking” with weighted pack, multiple metric acquisition is critical. More so, however, is what your explication most clearly demonstrates: the competency with which to interpret those data. I don’t think I’ve ever seen a graphic representation of precisely the impact on the underlying physiological of the work you performed. That the only set of metrics that demonstrated so clearly that impact shown by the (metric) inverse relationship between VO2 and SMO2. Now an 88 year old aging-athlete, I shall incorporate in my workouts the layered levels of data, Rich. I look back with fond memories of our work together during COVID. Keep it up. !!!! Tony
Here’s the deal – the ‘data’ is out there and available, but the ‘knowledge’ is just soooo summarized and condensed, that it’s sort of a ‘do this, not that’ type of directive. We have GOT to look at the Holistic image. I got a good night’s rest last night, but my HRV Stress score was a ’96’. So the 3 sleep score values were positive, but the parasympathetic was deep in the negative. So, 3 green lights and a red. THEN, if you’re looking Ronnestad’s, and you’re seeing CONSISTENCY, well, bravo, sally forth. However – if you start to get in your own head, and feel fatigued, or slow, or like you have to stand up, well, that’s also a sign.
In a perfect world, I wouldn’t offer structured intervals at all – I’d use the Physiology First metrics to really help myself and my recreational athletes pursue a DYNAMIC interval protocol, sort of a Fartlek approach, but one governed by the intrinsic data, and not the extrinsic wattage or pace or distance values.
I’m completely starving on the vine. No one is really interested in this stuff, so it’s just for my own self-evaluation. I don’t have a lab coat or a PhD, and my MS is in Sports Marketing, which was also a Big Fail, so the information is just for you, me, and the few dozen others who read when they can.
Keep up the great work, watch your Desat/Resat rates, and keep resistance training all the way to the end.
Hugs from Reno.
-Rich