Breaking the Plateau: How Step-Up VO2 Max Intervals Unlock Deep Oxygen Kinetics
Executing step-up VO2 max intervals is one of the most effective strategies I use to drive time near maximal oxygen uptake without causing premature neuromuscular exhaustion. Standard flat-power VO2 max sets often result in either a slow physiological ramp—where I only reach true maximal stimulation in the final 30 seconds—or an early blow-up due to rapid anaerobic glycolytic depletion.
In my morning session, I executed a 4 x 6-minute step-up interval protocol designed to optimize my oxygen kinetics:
- Block 1 (0:00–3:00): 3 Minutes at Threshold Intensity (~250–275 W)
- Block 2 (3:00–6:00): 3 Minutes step-up to Perceived VO2 Intensity (~280–305 W)
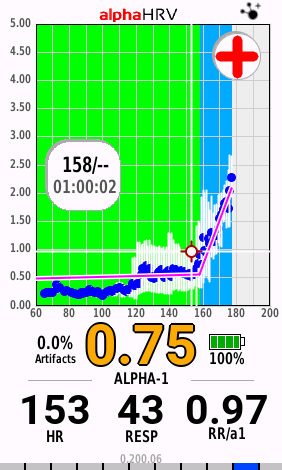
By pairing my high-resolution power and heart rate with AlphaHRV (DFA α1) and Moxy Muscle Oxygenation (SmO2), I can see precisely how pre-priming at threshold during these step-up VO2 max intervals accelerated my oxygen delivery and drove a profound suprathreshold response.
Full Workout Telemetry Overview
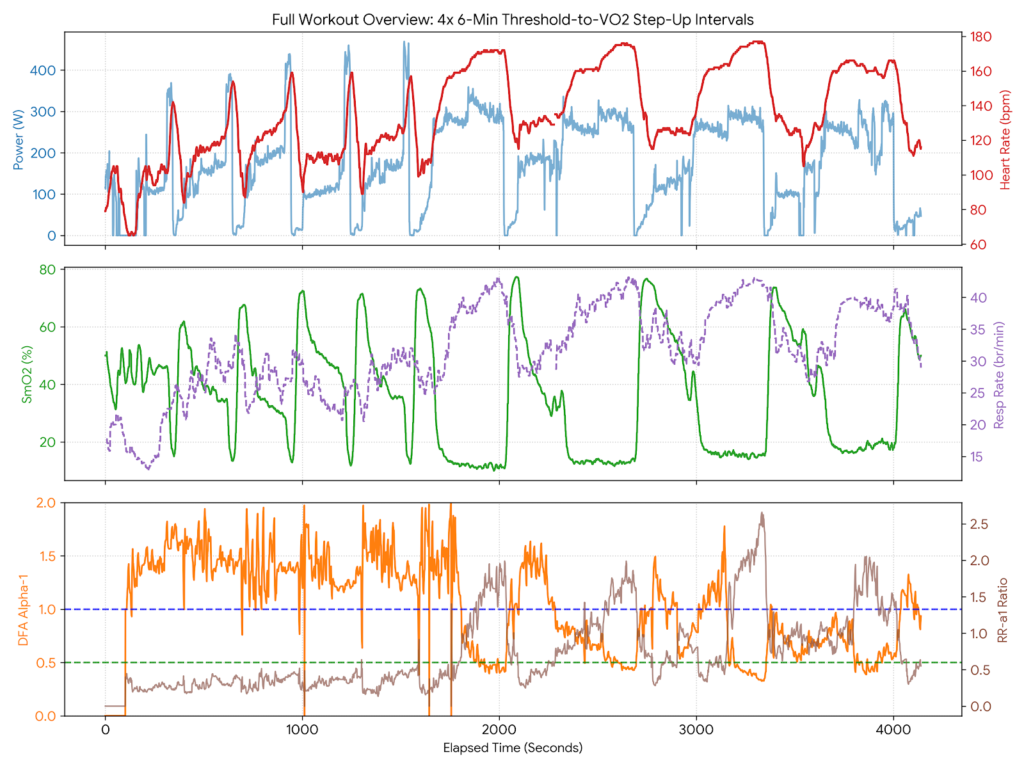
Looking at my full workout timeline, my four main work intervals are clearly delineated between t = 1660s and t = 4000s.
Notice the distinct behavior across my three core physiological streams:
- Heart Rate Drift & Plateau: My HR climbed smoothly during Block 1, then rapidly accelerated in Block 2, breaking into my 170–177 bpm zone.
- Quad Desaturation (SmO2): My SmO2 dropped from a warmup baseline (~50–70%) down to a severe trough of 11%–13% during my initial work sets.
- Autonomic Breakdown (DFA α1): As my power stepped up, my DFA α1 collapsed from ≈ 1.00–1.25 down into the severe stress domain below 0.50.
Interval Telemetry Data Breakdown for Step-up VO2 max intervals
To analyze my internal stress during each set, I broke down my full 3-minute average power for each block alongside my physiological steady-state averages over the last 2 minutes (SmO2, Cadence, HR, Resp Rate) and my last 1 minute (DFA α1, RR-α1 ratio):
| Interval Block | 3-Min Avg Power | Last 2m Power | Last 2m HR | Last 2m SmO2 | Last 2m Cadence | Last 2m Resp Rate | Last 1m DFA α1 | Last 1m RR-α1 | Last 1m Resp Rate |
|---|---|---|---|---|---|---|---|---|---|
| Int 1 – Block 1 (Threshold) | 271 W | 280 W | 158 bpm | 12.8% | 91 rpm | 36 br/min | 0.979 | 0.759 | 38 br/min |
| Int 1 – Block 2 (VO2) | 305 W | 294 W | 171 bpm | 11.5% | 85 rpm | 42 br/min | 0.457 | 1.690 | 42 br/min |
| Int 2 – Block 1 (Threshold) | 262 W | 255 W | 161 bpm | 13.1% | 87 rpm | 38 br/min | 0.688 | 1.081 | 38 br/min |
| Int 2 – Block 2 (VO2) | 285 W | 282 W | 174 bpm | 12.8% | 91 rpm | 42 br/min | 0.446 | 1.736 | 42 br/min |
| Int 3 – Block 1 (Threshold) | 254 W | 254 W | 162 bpm | 16.1% | 88 rpm | 38 br/min | 1.256 | 0.615 | 40 br/min |
| Int 3 – Block 2 (VO2) | 286 W | 283 W | 176 bpm | 15.3% | 90 rpm | 42 br/min | 0.361 | 2.290 | 43 br/min |
| Int 4 – Block 1 (Threshold) | 250 W | 247 W | 164 bpm | 17.0% | 85 rpm | 38 br/min | 0.680 | 1.197 | 40 br/min |
| Int 4 – Block 2 (VO2) | 257 W | 251 W | 161 bpm | 19.1% | 55 rpm | 38 br/min | 0.588 | 1.322 | 37 br/min |
Threshold Determination via Best-Fit Modeling
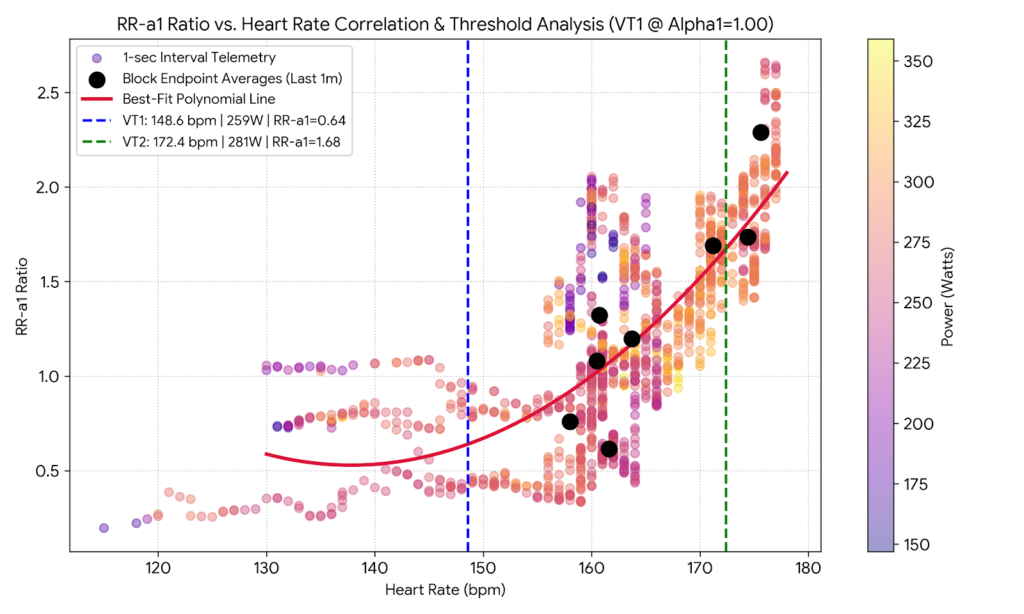
| Physiological Threshold | DFA α1 Anchor | Heart Rate | Power Output | RR-α1 Ratio |
|---|---|---|---|---|
| VT1 (Aerobic Threshold) | 1.00 | 149 bpm | 259 W | 0.64 |
| VT2 (Respiratory Compensation) | 0.50 | 172 bpm | 281 W | 1.68 |
Why Step-Up VO2 Max Intervals Superiorly Stimulated Oxygen Uptake
1. Oxygen Uptake Kinetics & Metabolic Pre-Priming
When I start an interval directly at my target VO2 power (e.g., 300 W), there is a significant VO2 slow component lag. My muscle oxygen uptake takes 90–120 seconds to adjust, during which my energy demands are met predominantly through anaerobic glycolysis, accumulating heavy substrate disturbance and hydrogen ions (H+) early in the set.
By spending Block 1 at 250–275 W (right around my VT1/Threshold):
- My heart rate elevated smoothly into my 158–163 bpm window.
- My local vasodilation was fully engaged, pulling my SmO2 down to ≈ 12%–16% without blowing out my muscle pH.
- My respiration rate primed at 36–38 br/min.
When I stepped up to Block 2 (282–294 W) during these step-up VO2 max intervals, my metabolic machinery was already primed. Instead of waiting two minutes for my oxygen uptake to rise, my oxygen delivery responded almost instantaneously, driving my HR straight into my suprathreshold zone (171–176 bpm) and dropping my DFA α1 straight down into the 0.36–0.45 range.
2. AlphaHRV (DFA α1) & Autonomic Suppression
In AlphaHRV, DFA α1 = 1.00 marks my Aerobic Threshold (VT1), while DFA α1 = 0.50 represents my Second Ventilatory Threshold (VT2 / RCP).
- Block 1: My DFA α1 averaged 0.68–1.25, keeping my autonomic strain manageable and maintaining fractal HRV correlation.
- Block 2 Step-Up: In Intervals 1–3, my increase of just 25–30 Watts was enough to crash my DFA α1 to 0.457 (Int 1), 0.446 (Int 2), and 0.361 (Int 3).
- The RR-α1 Spike: My ratio of respiration rate to DFA α1 (RR-α1) jumped from ~ 0.60–1.00 in Block 1 up to 1.69–2.29 in Block 2. This sharp rise in my RR-α1 confirms heavy hyperventilation relative to autonomic correlation—my primary marker of deep VO2 stimulation.
3. Muscle Oxygenation (SmO2) Stabilization
Near-infrared spectroscopy (NIRS) via my Moxy sensor reveals how hard my local muscle tissue is working to extract oxygen:
- In Block 1, my SmO2 rapidly desaturated down to 12.8%.
- In Block 2, despite an increase in my power output, my SmO2 plateaued at 11.5%–15.3%.
This floor indicates near-maximal local deoxygenation, where my muscle extraction kinetics were maximized. Executing step-up VO2 max intervals allowed my working muscle to operate at its extraction limit for a full 3 minutes per set without premature localized failure.
My Coaching Takeaways & Verdict
- Total Physiological Yield: I logged 17.4 minutes with my heart rate ≥ 160 bpm (> 90% HRmax) and 7.4 minutes with my DFA α1 ≤ 0.50.
- Interval 4 Autonomic Fatigue: In Interval 4, my overall fatigue caused my cadence to drop to 55 rpm and my power in Block 2 to settle at 251 W. As a result, my DFA α1 only dropped to 0.588 and my HR reached 160.7 bpm. This illustrates how internal telemetry clearly catches when I drop out of my target physiological zone during step-up VO2 max intervals, even when my effort feels high.
- The Verdict: My step-up VO2 max intervals successfully delivered the full benefits of a maximal aerobic workout—high cardiac output, elevated respiration (>42 br/min), and deep autonomic suppression—while avoiding the early fatigue associated with flat suprathreshold sets.
Ready to Crack Your Own Physiological Code?
Stop training in the dark. Take control of your data with real-time internal metrics.
Option 1: Live Studio
Join VQ Velocity Virtual Studio
Train live with me in data-driven group sessions designed to optimize your internal metrics, threshold kinetics, and real-time stamina.
Option 2: Support The Mission
Fuel The Handlebar Lab
Help me bring Garmin ecosystem telemetry, AlphaHRV, and muscle oxygenation analytics to the forefront of endurance coaching.