Trust Your Physiology First: Real-Time VO2max Pacing with AlphaHRV and Moxy
AlphaHRV Vo2Max Training allows athletes to bypass static, pre-set heart rate zones and monitor live autonomic stress as it happens on the bike. Every morning we clip into the pedals, our bodies present a unique physiological landscape where sleep quality, hydration levels, overnight nervous system recovery, and carbohydrate availability dictate our daily metabolic boundaries.
Consequently, during a recent 4×4-minute interval session—fueled by 60+ grams of intra-workout carbohydrates to ensure full glycolytic availability—I set out to test the precision of real-time HRV threshold tracking versus standard post-ride Garmin/Firstbeat analysis.
The Real-Time Toolkit on My Head Unit:
- AlphaHRV Connect IQ: Iñigo Tolosa’s AlphaHRV Connect IQ Data Field for live autonomic threshold tracking (α1 and RR-a1 ratio).
- Moxy Muscle Oxygenation: Oleksiy’s Moxy Sensor Data Field in Connect IQ for live quadriceps muscle oxygen saturation (SmO2) graphing.
The Science Behind AlphaHRV Vo2Max Training
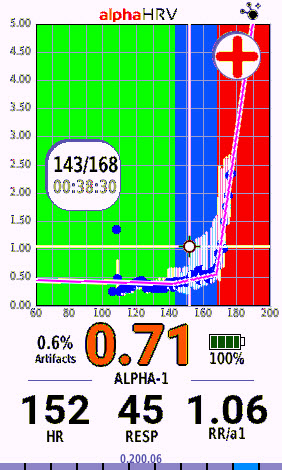
Dr. Bruce Rogers’ pioneering research on fractal correlation via Detrended Fluctuation Analysis (DFA α1), detailed extensively on Muscle Oxygen Training, gives us direct insight into autonomic cardiac control. In Dr. Rogers’ foundational work, a DFA α1 of 1.00 to 0.75 represents the transition boundary for Aerobic Threshold (VT1/LT1), while 0.50 marks Anaerobic Threshold (VT2/LT2).
Furthermore, when executing AlphaHRV Vo2Max Training, tracking the RR-a1 ratio (Respiration Rate relative to DFA α1) alongside DFA α1 provides a dynamic daily map of internal stress:
Daily Autonomic Threshold Framework (Dr. Bruce Rogers Protocol)
- Aerobic Ceiling (VT1 / LT1): DFA α1 ≈ 1.13 – 1.15 | RR-a1 ≈ 0.50 (HR ~143 bpm | ~188 W)
- Anaerobic Threshold (VT2 / LT2): DFA α1 ≈ 0.50 | RR-a1 ≈ 1.00 (HR ~168 bpm | ~265 W)
- Severe Strain / VO2 Max Domain: DFA α1 < 0.50 | RR-a1 ≥ 1.50+ (HR >172+ bpm | >280 W)
To account for individual autonomic ceilings, Dr. Rogers highlighted taking your peak recorded α1, adding 0.50, and dividing by 2. As a result, by plugging in my highest recorded α1 from the ride (1.765), my personalized daily VT1 baseline calculates to precisely 1.13 α1 (~142 bpm / 188 W)—right in line with my Garmin Connect IQ setting of 1.15.
Pacing Execution in AlphaHRV Vo2Max Training
To evaluate this real-time feedback, each 4-minute interval was executed in two distinct halves. Specifically, the first two minutes were anchored near 265 W Threshold (on a simulated 2% trainer slope), whereas the final two minutes stepped up into VO2max territory (275 W – 295 W on a simulated 3% slope).
| Interval | 1st 2 Min Power | 2nd 2 Min Power | 1st 2 Min Resp Rate | 2nd 2 Min Resp Rate | 1st 2 Min RR-a1 (Stability) | 2nd 2 Min RR-a1 (Instability) | Left Torque Effectiveness (1st vs 2nd) |
|---|---|---|---|---|---|---|---|
| Interval 1 | 276.5 W | 295.0 W | 34.2 br/min | 48.2 br/min | 0.42 (±0.13) | 1.77 (±0.68) | 86.5% → 89.0% |
| Interval 2 | 264.2 W | 284.7 W | 37.4 br/min | 50.3 br/min | 0.48 (±0.09) | 1.45 (±0.67) | 85.2% → 87.7% |
| Interval 3 | 272.5 W | 271.9 W | 38.6 br/min | 50.9 br/min | 0.53 (±0.10) | 2.10 (±1.08) | 88.6% → 88.1% |
| Interval 4 | 260.5 W | 272.4 W | 38.2 br/min | 50.0 br/min | 0.60 (±0.11) | 1.80 (±0.83) | 86.3% → 88.1% |
Key Physiological Observations:
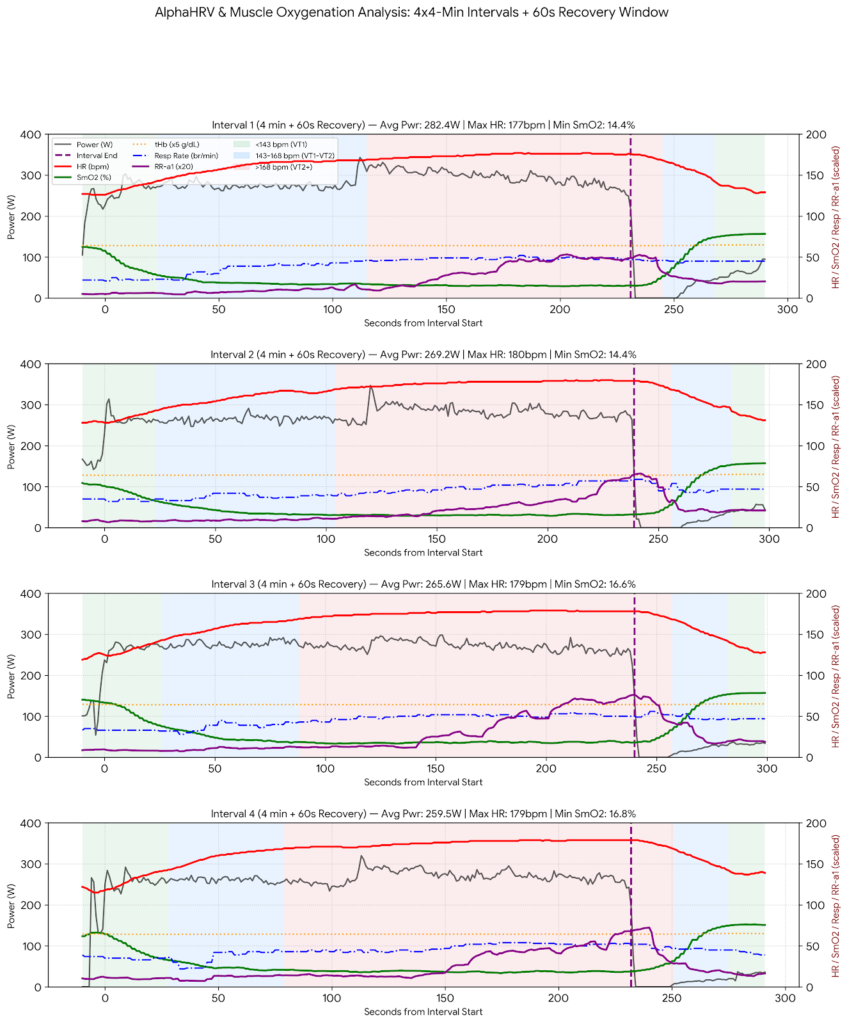
- The Threshold Domain (First 2 Minutes @ ~265 W): Respiration Rate remained controlled at 34–38 br/min, while the RR-a1 ratio locked into a remarkably stable baseline between 0.42 and 0.60 (±0.09–0.13). Consequently, parasympathetic control and metabolic demand were in complete equilibrium below VT2.
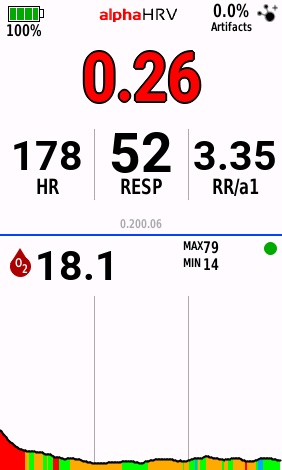
- The VO2max Surge (Final 2 Minutes @ 275 W – 295 W): Stepping onto the 3% slope required pushing 170+ Newtons of pedal force. Thus, Respiration Rate surged to 48–51 br/min, and the RR-a1 ratio exploded to 1.45–2.10+ with massive variance (±0.67–1.08), reflecting severe hypercapnic ventilatory drive.
- Pedal Force & Torque Effectiveness: Higher pedal force under slope resistance automatically engaged the full kinetic chain (hip flexors, biceps femoris, anterior tibialis). As a result, Left Torque Effectiveness increased from 85.2% to 89.0%.
- Muscle Oxygen Extraction (SmO2): Quadriceps oxygen saturation plummeted by an additional 7.7% to 10.8%, ultimately hitting a deep desaturation floor of 14.4%–16.8%.
Physiology First: Evaluating AlphaHRV Vo2Max Training Success
Operating under a Physiology First framework makes AlphaHRV Vo2Max Training far more reliable than chasing arbitrary power numbers. Evaluating internal biological cost over external wattage output made this workout an unquestionable success.
By using live internal markers, the workout achieved every target physiological marker: maximum muscle oxygen extraction (SmO2 < 18%), high cardiorespiratory demand (HR > 104% LTHR / 180 bpm max), hyperventilation drive, and sustained autonomic suppression (DFA α1 ≈ 0.50–0.60).
Where Garmin Algorithms Fail in AlphaHRV Vo2Max Training
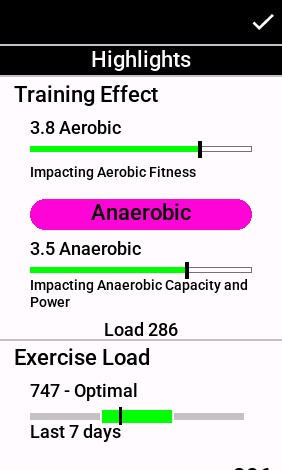
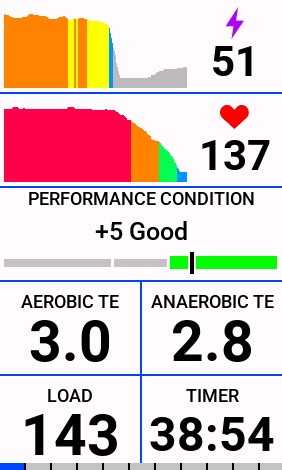
Despite the textbook aerobic progression, Garmin flagged the overall session’s primary training impact as Anaerobic Capacity rather than VO2max. Why did this occur? Because Firstbeat’s algorithm relies on static, pre-programmed tables, peak power surges, and time spent above fixed threshold percentages. Therefore, it sees heart rates reaching 105%+ of LTHR and simply tallies up “anaerobic stress units.”
Firstbeat’s Inflexibility Ignores Internal Context:
- It does not measure live autonomic control or real-time RR-a1 ratio instability.
- In addition, it cannot read real-time muscle oxygenation (SmO2) extraction or resaturation rates.
- Finally, it cannot adapt to daily shifts in nervous system fatigue, hydration, or fuel status.
Technology, Application, Attention, Success
Since 2002, I have guided cyclists under a core coaching mantra:
“Technology, Application, Attention, Success.”
Advanced metrics like DFA α1, SmO2, and real-time RR-a1 ratios are powerful tools. However, having data on a screen is only step one (Technology). Learning how to adjust your pace mid-interval (Application) requires real-time focus (Attention) to deliver results (Success).
Are you ready to optimize your AlphaHRV Vo2Max Training? While sensors and head units collect the numbers, it is the minute-by-minute, second-by-second coaching in our VQ Velocity virtual studio that transforms raw data into athletic performance. We guide you through every surge, pedal stroke, and breath—ensuring you hit your exact workout targets every single time.