
Mastering Garmin Performance Condition: Decoding Autonomic Stability and Aerobic Coherence Through Strategic Hydration
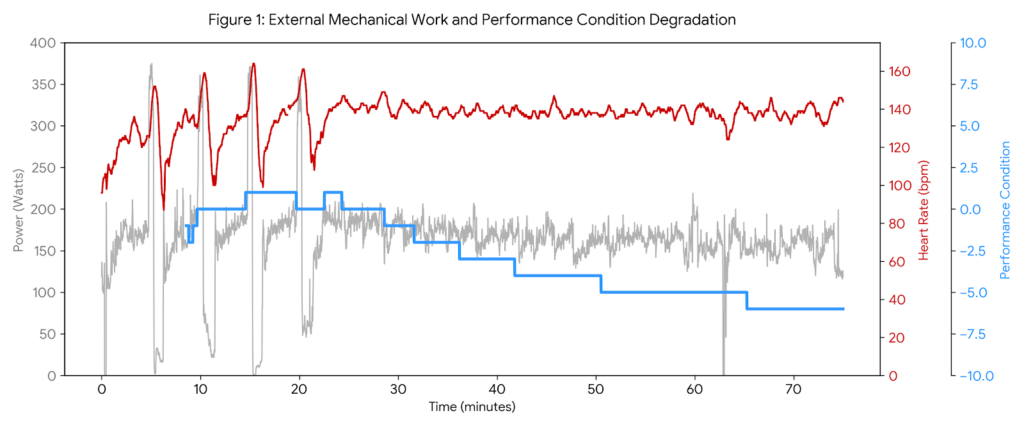
Mastering Garmin Performance Condition: Decoding Autonomic Stability and Aerobic Coherence Through Strategic Hydration For any cyclist serious about internal metabolic load, optimizing your training relies heavily on advanced metrics like Garmin Performance Condition tracking. Far more than a transient number that pops up ten minutes into your ride, it serves as a real-time metabolic voltmeter. […]
When “Easy” Power Isn’t Easy: A VO2 Master Data Deep Dive
Analyzing VO2 Master data reveals a stark reality check from my ride this Friday morning. I expected a straightforward, low-intensity recovery base day. Instead, my body gave me a loud warning. Even though I intentionally kept my external intensity low, the internal cost of the ride was exceptionally high. This ride is a textbook example […]
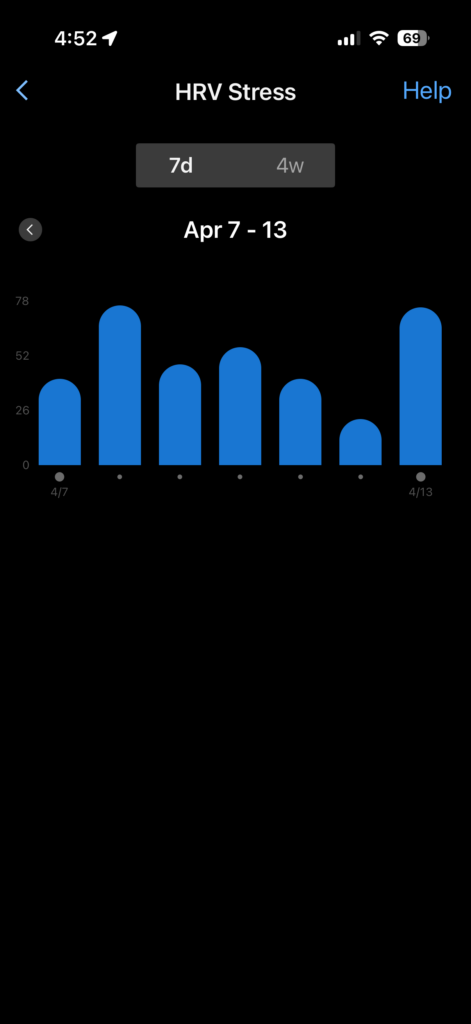
The Autonomic Pivot: When Less Training Volume Equals Deeper Recovery
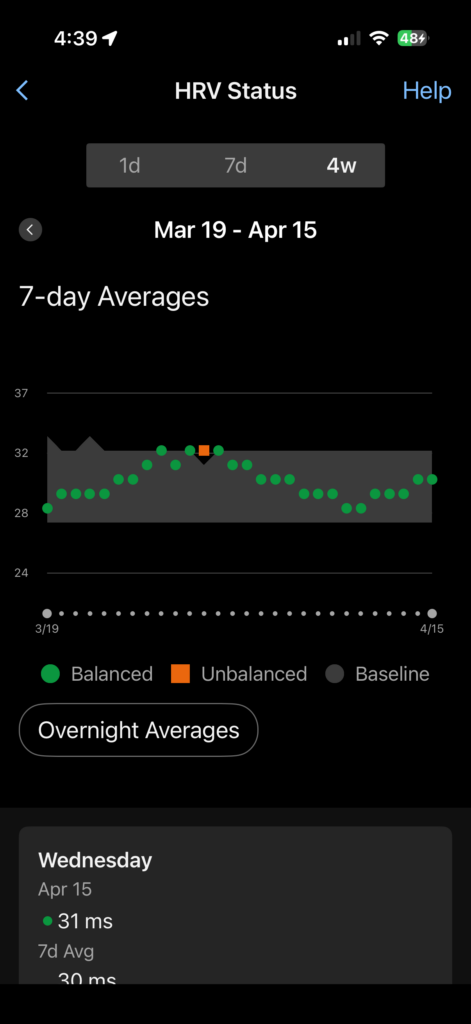
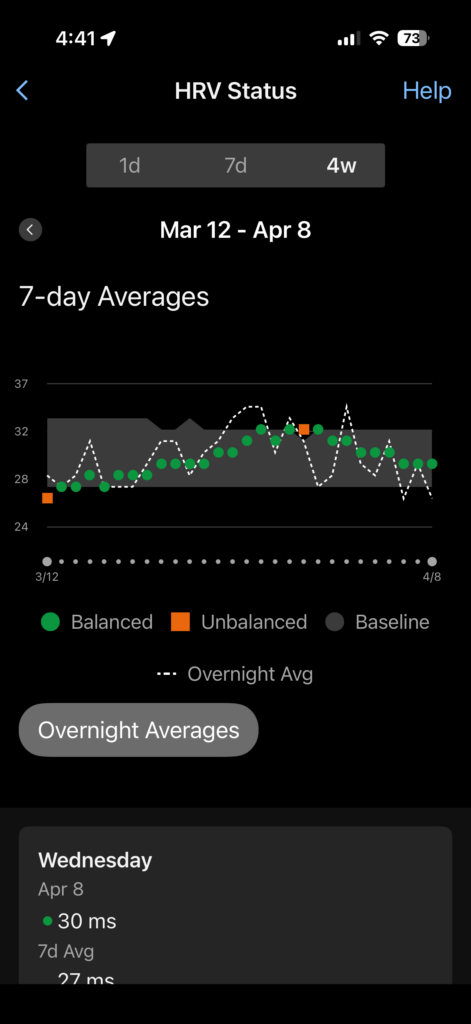
The Autonomic Pivot: When Less Training Volume Equals Deeper Recovery By Coach Richard Wharton, OBC | Published: May 25, 2026 Tracking my **Garmin HRV Stress** over the last few months has revealed a fascinating tug-of-war within my autonomic nervous system. Specifically, it shows exactly how shifting training workloads register on the body. Looking back at […]
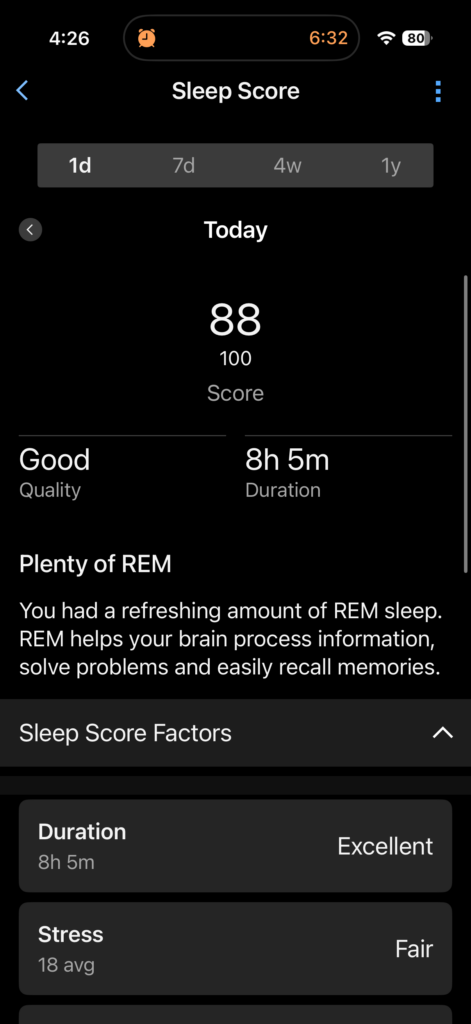
Sleep Score HRV Stress: The Yin and Yang of Recovery
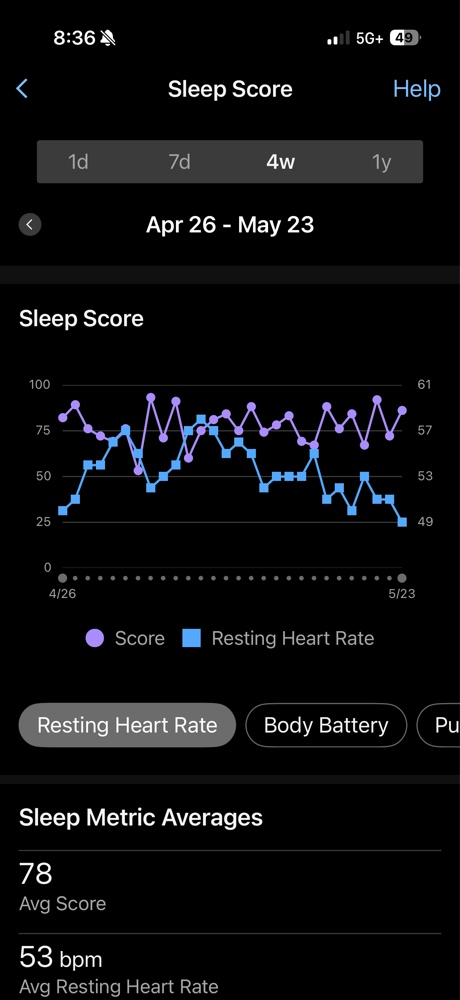
The Yin and Yang of Recovery Physiology First Training | By Coach Richard Wharton Managing your Sleep Score HRV Stress data is the ultimate balancing act for any serious athlete. I’ve spent the last 48 hours in the “pain cave” building a trailer, manhandling heavy steel. When I pulled my metrics this morning, I saw […]
Garmin HRV Stress Balance: When Life Gets in the Way
Garmin HRV Stress Balance: When Life Gets in the Way My training, recovery, and daily decisions start with Garmin HRV Stress Balance. I love the fantasy version of training: ride hard, lift heavy, eat clean, sleep eight hours, repeat. And with all the data my Garmin wearables give me — especially my older Garmin Fenix […]
The Garmin Ecosystem: Why Your Watch is More Important Than Your Power Meter
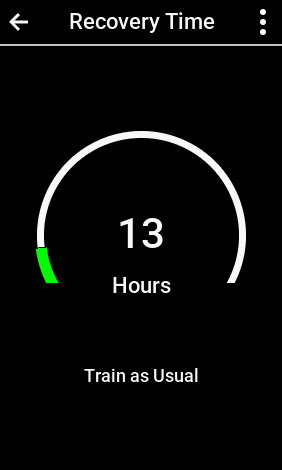
Garmin Recovery Time: Why Your Watch Beats Your Power Meter By The Garmin Guru | April 24, 2026 Understanding Garmin Recovery Time is essential for any athlete following a “Physiology First” approach. As a coach with over 20 years in the industry, I know that your bike computer is only half the story. To truly […]
Garmin Stamina VO2 Threshold: Mapping the Fatigue Trigger
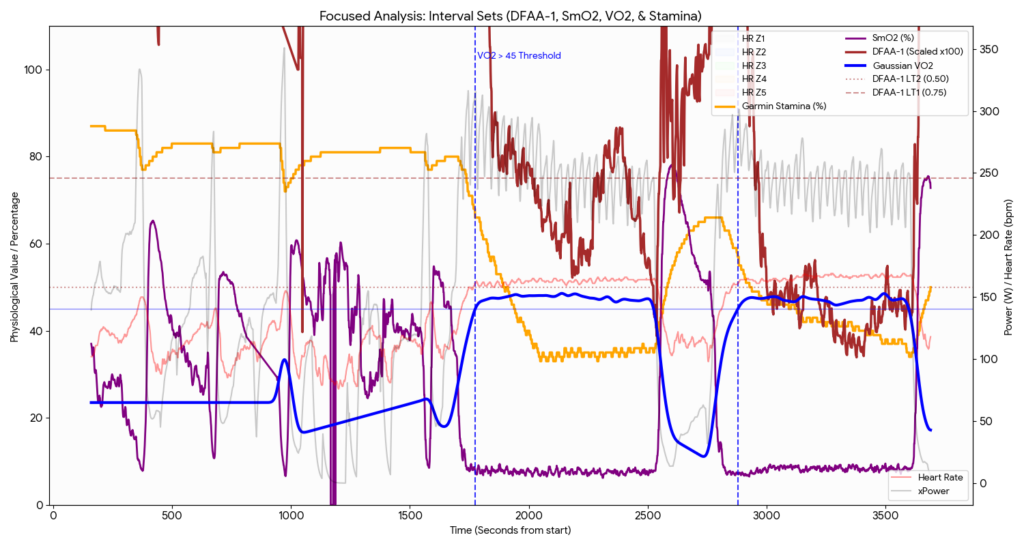
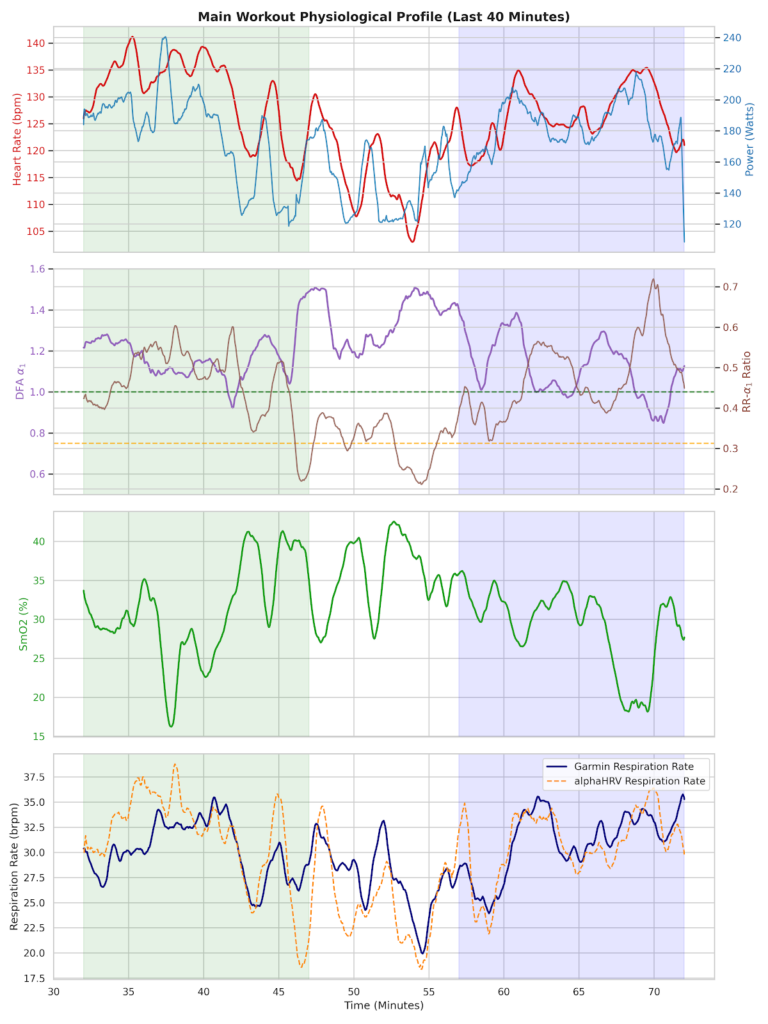
Garmin Stamina VO2 Threshold: Mapping the Fatigue Trigger In my ongoing pursuit of the “Physiology First” training approach at Onlinebikecoach.com, I have used the Garmin Stamina VO2 Threshold to map exactly where my internal stability ends and metabolic exhaustion begins. To build a more resilient aerobic engine, I need to know my limits. With my […]
Using Garmin Sleep and HRV Stress to Plan My Workouts: Today’s Real Example
When Garmin HRV Stress Hits 72: A Practical Morning Read on Sleep, Load, and What to Do Next Published: April 8, 2026 · Quick, physiology‑driven guidance for the morning after a high HRV Stress reading. I woke to an HRV Stress of 72 on my Garmin and a Garmin Sleep Score in the […]
Predicting the Redline: Using Garmin Sleep Scores to Master Ronnestad 30-15 Intervals
Physiology First: Using Garmin Sleep Scores to Predict Ronnestad 30-15 Success Part I: The Garmin Sleep Score Ronnestad Preflight We often treat training like a game of chance, but the reality is that your body provides a daily “weather report” if you know where to look. Before I even touched my bike this morning, I […]
Physiology First: Navigating a “Red Light” Morning with AlphaHRV
Physiology First: My Red Light Recovery Ride This morning was a masterclass in why I apply a Physiology First framework to every session, looking at the internal engine before I look at the wattage. Between a late meal and the devastating news about my friend Murray being struck by a motorist—suffering a serious […]