The Autonomic Pivot: When Less Training Volume Equals Deeper Recovery
By Coach Richard Wharton, OBC | Published: May 25, 2026
Tracking my **Garmin HRV Stress** over the last few months has revealed a fascinating tug-of-war within my autonomic nervous system. Specifically, it shows exactly how shifting training workloads register on the body. Looking back at a full 90-day macro-arc across March, April, and May, the internal telemetry has finally shifted from a state of chronic sympathetic survival to a profound parasympathetic rebound. Ultimately, this long-term trend in my autonomic data has broken downward, clearing the path for an overall surge in systemic wellness.
Garmin HRV Stress Analysis: 90 Days of Autonomic Data
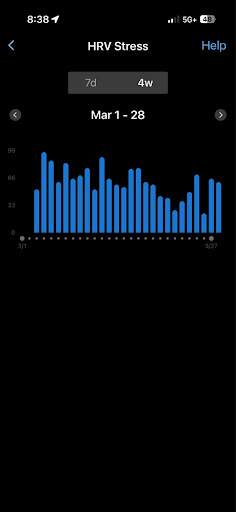
This is the March 2026 HRV Stress chart off of Garmin Connect. It reveals a significant structural drop in daily HRV stress, clearing out chronic sympathetic dominance.
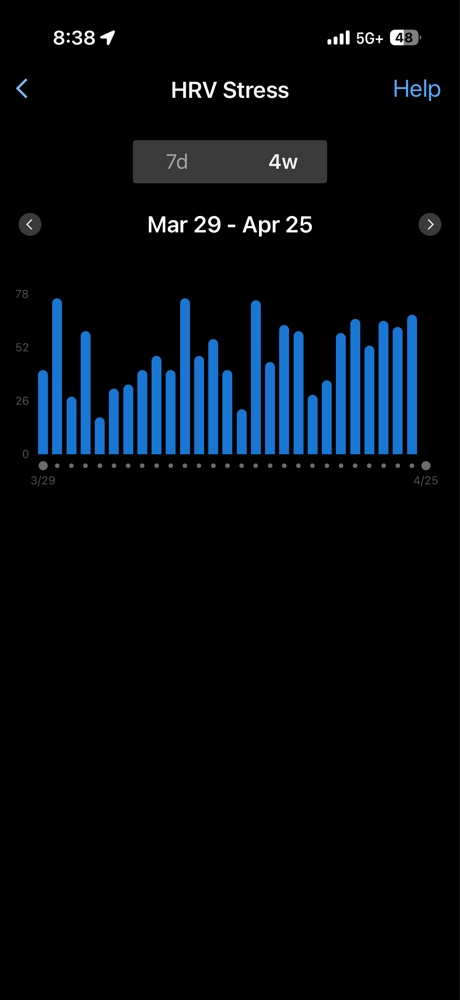
A visual summary of the high sympathetic strain period: observe the dominance of towering blue bars indicating consistently elevated physiological load and reduced autonomic headroom.
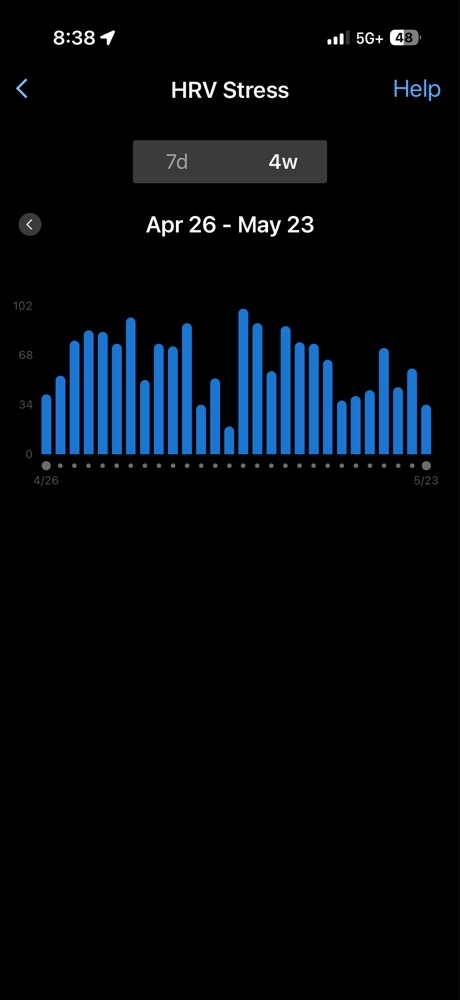
The picture of recovery: This chart shows the improved, stable period where the massive stress spikes disappear, indicating deep parasympathetic rest.
During March and April, my baseline tracking was characterized by persistent, towering blue bars frequently spiking into the 70s and 80s. Consequently, my body was absorbing a heavy physiological tax, leaving little autonomic headroom. When I first started tracking these metrics, I detailed the foundational mechanics in my post on Measuring HRV Stress with Garmin.
Looking at the recent April 26 to May 23 cycle, the structural floor of that baseline strain has completely dropped out. Therefore, this reduction in chronic tension has allowed my overnight HRV Status to climb steadily. It eventually pushed past the upper boundary of my previous baseline into a highly resilient 36 to 39 ms range. My nervous system is finally catching its breath.
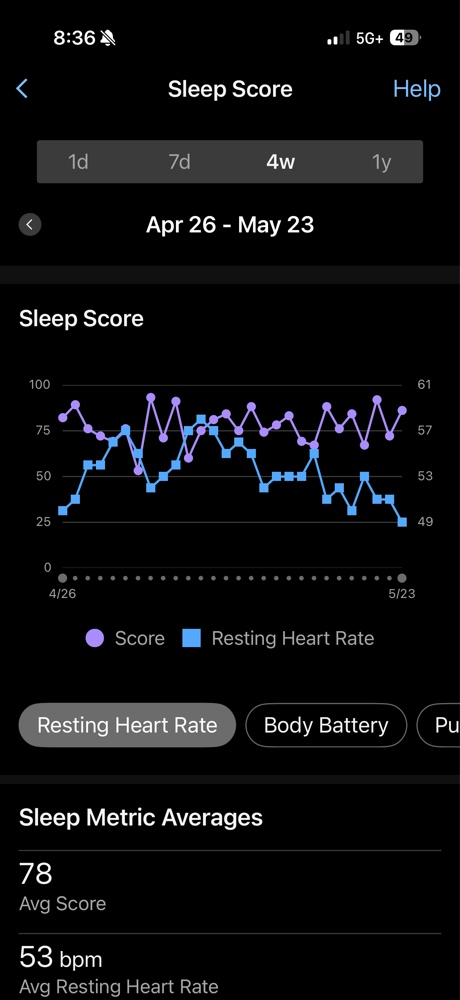
The clear inverse relationship between stress and sleep: as overnight resting heart rate steps down toward 49 bpm, sleep scores consistently peak in the high 80s and low-to-mid 90s.
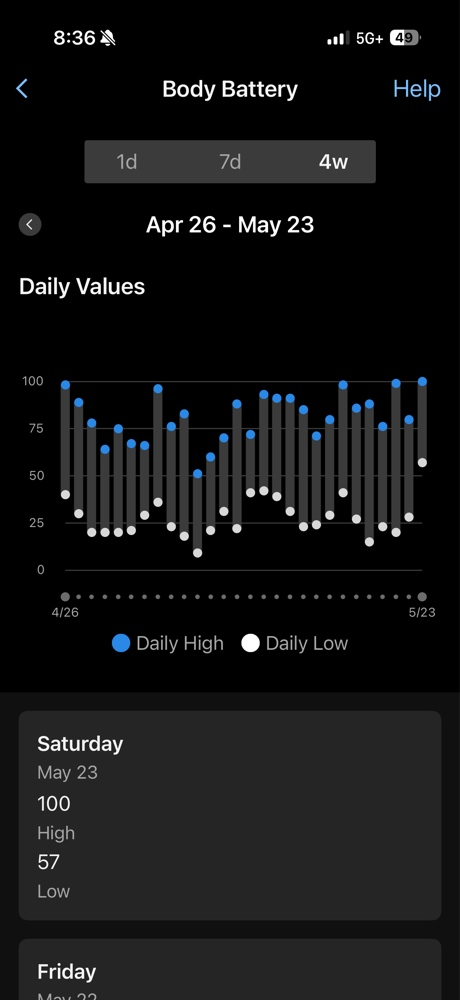
Clean, efficient overnight recovery in action: lowered systemic stress allows the body to fully charge back to a perfect 100 by morning.
Tracking the Inverse RHR Correlation
This downward trend in my physiological recovery metrics directly mirrors a massive optimization in my sleep architecture. For instance, I am now regularly capturing overnight sleep scores in the high 80s and low-to-mid 90s. This is backed by a daily Body Battery that frequently tops out at a perfect 100. If you look closely at the correlation between my sleep score and Resting Heart Rate (RHR) over the last month, the story tells itself. As my resting heart rate stepped down from the mid-50s to a crisp 49 bpm, my overall sleep quality soared.
The Roughneck Phase: Steel, Spark, and Structural Loading
The most fascinating part of this physiological pivot is the paradox of the workload. I haven’t been sitting on the couch. Instead, I’ve significantly reduced my structured cycling volume while simultaneously raising my overall physical workload. To do this, I’ve partnered with a neighbor just 500 meters down the road to fabricate and build a container home and steel projects completely by hand.
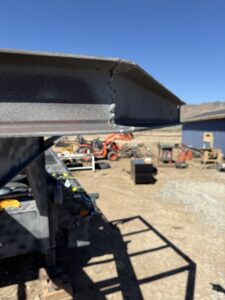
Putting the small tractor to work—handling the early site layout and material moving right down the road.
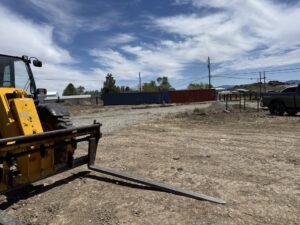
The heavy muscle: This commercial forklift is essential for maneuvering massive steel pipe, beams, and chains.
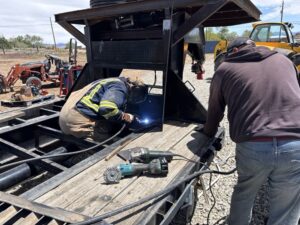
Welding and fabricating the long-bed material trailer from scratch—pure structural loading at its finest.
Replacing Watts With Heavy Equipment
Lately, my days aren’t measured in watts, but in steel prep and fabrication. We are currently building two separate custom trailers entirely by hand designed to haul heavy materials up and down the site. One is at the absolute maximum legal length, alongside a shorter companion unit. The work is pure, raw manual labor. This involves operating a massive commercial forklift, maneuvering a compact tractor with a front loader, and wrangling heavy steel pipe and massive chains to move material around.
Consequently, it feels less like a traditional fitness routine and more like working as a roughneck in an oil patch. However, it comes with the distinct advantage that I can literally walk to work and back.
This lifestyle shift has swapped acute, high-intensity neurological exhaustion for steady, functional, structural movement. As a coach using a physiology first training approach, it’s fascinating to watch how constant lifting, grinding, and welding drives excellent muscle density and physical conditioning. This structural load builds capacity without the high-end sympathetic tax that typically suppresses the body’s natural recovery systems. To better understand how autonomic stress metrics mirror these training loads across different monitoring platforms, you can review the extensive physiological research hosted by Dr. Marco Altini.
Maximizing the Metric: Hitting the Physiological Floor
The ultimate proof of this lifestyle optimization shows up clearly in my long-term health metrics. In just over six weeks, I will be turning 56. Yet, my Garmin Fitness Age is currently sitting at nine years younger than my chronological age—comfortably pinned at 46.
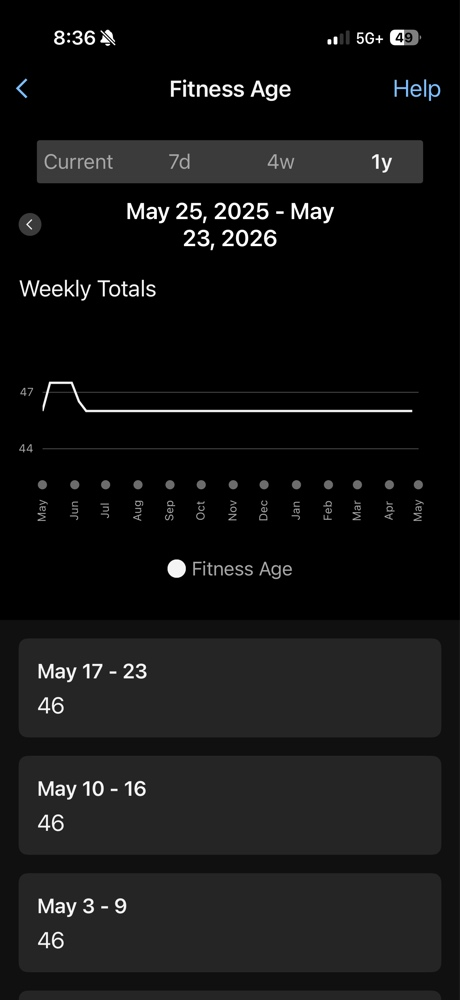
For those familiar with the modern ecosystem, a nine-year reduction is the absolute physiological floor. This is the maximum delta the system allows. Achieving and maintaining this score isn’t down to a single variable. Rather, it is the direct consequence of a multi-dimensional approach to wellness that keeps my **Garmin HRV Stress** consistently suppressed:
- Cardiovascular Consistency: Keeping a deep, stable baseline of cardiorespiratory fitness without over-cooking the engine.
- Structural Resistance Training: Using real-world manual labor to load the skeleton and musculature, building functional density.
- Environmental Balance: Getting the right mix of indoor focus and outdoor exposure while intentionally lowering ambient life stress.
By prioritizing internal metrics over external data points like standard power numbers, I’ve found that changing the nature of the work is the ultimate key to unlocking true systemic longevity. Your metrics aren’t just goals to chase; they are a mirror reflecting how harmoniously you are living your life.

Ready to crack your own Physiological Code With Garmin Metrics?
Step 1: Join my VQ Velocity Virtual Studio to keep your fitness sharp with live, data-driven sessions.
Step 2: Support my mission to bring the physiological data of wearables to the forefront of training. It’s a Laboratory on your Handlebars!