Physiology First: Using Garmin Sleep Scores to Predict Ronnestad 30-15 Success
Part I: The Garmin Sleep Score Ronnestad Preflight
We often treat training like a game of chance, but the reality is that your body provides a daily “weather report” if you know where to look. Before I even touched my bike this morning, I ran my “Physiology First” check to see how my Garmin Sleep Score Ronnestad data was trending. I wasn’t looking for motivation; I was looking for a Go/No-Go signal for one of the most demanding workouts in a cyclist’s arsenal: Ronnestad 30-15 intervals.
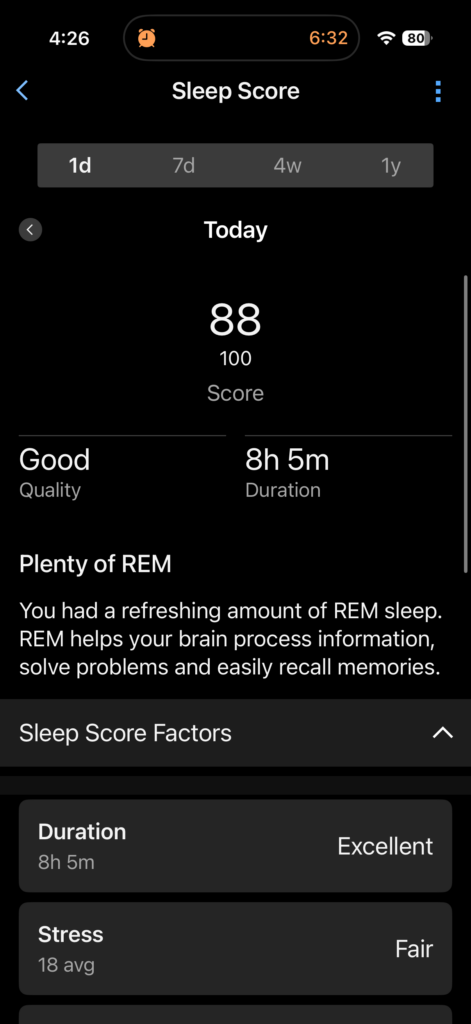
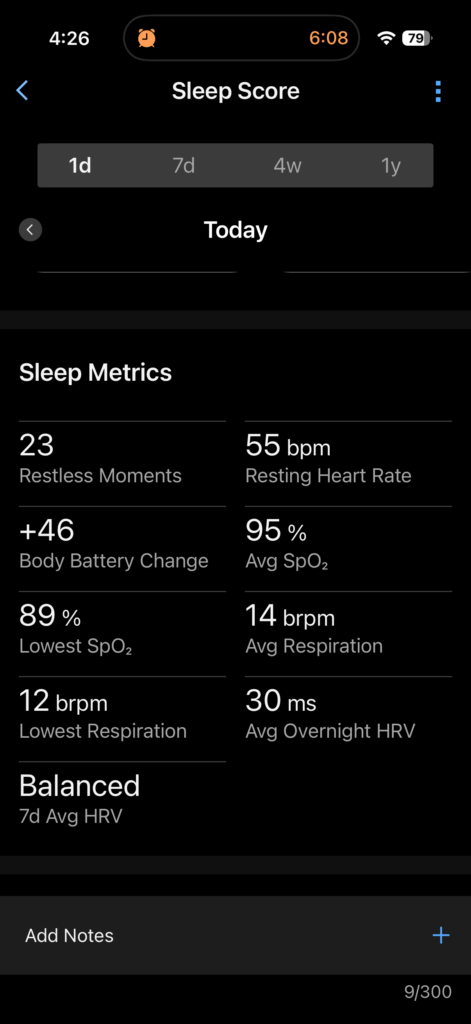
An 88 Sleep Score is a massive win. With over 8 hours of total sleep and a strong 2-hour REM block, the structural foundation for high-intensity work was perfectly set. On paper, the physics said my body was ready to handle a high-level training session.
The Internal Weather Report: By the Numbers
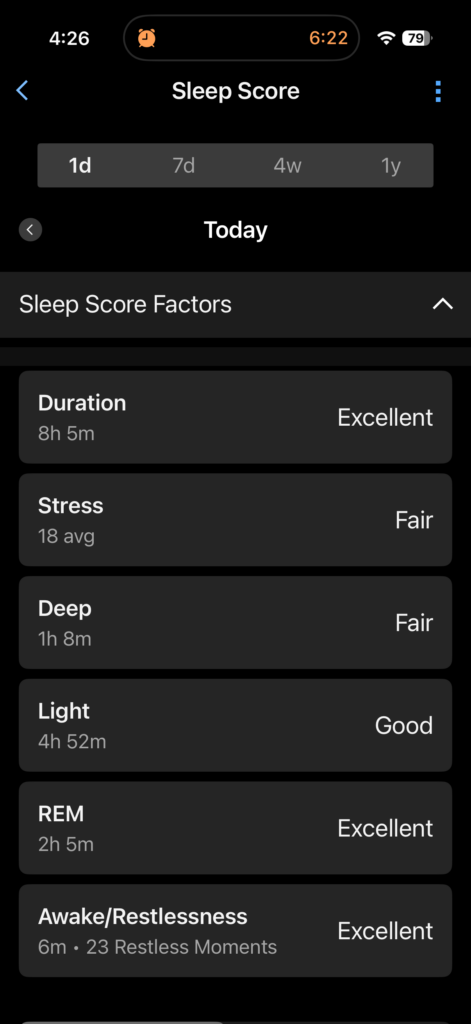
While the Sleep Score headline is impressive, the raw metrics reveal the “why” behind the performance readiness:
- Body Battery: +46 Change – A massive overnight recharge.
- HRV: 30ms Overnight Average – Balanced and stable within the 7-day average.
- Oxygenation: 95% Average SpO2 – Stable respiratory performance.
- Respiration: 14 bpm Average – Solid pulmonary recovery.
- Sleep Quality: 23 Restless Moments – Minor interruptions balanced by deep architecture.
Evaluating the Garmin Sleep Score Ronnestad Results
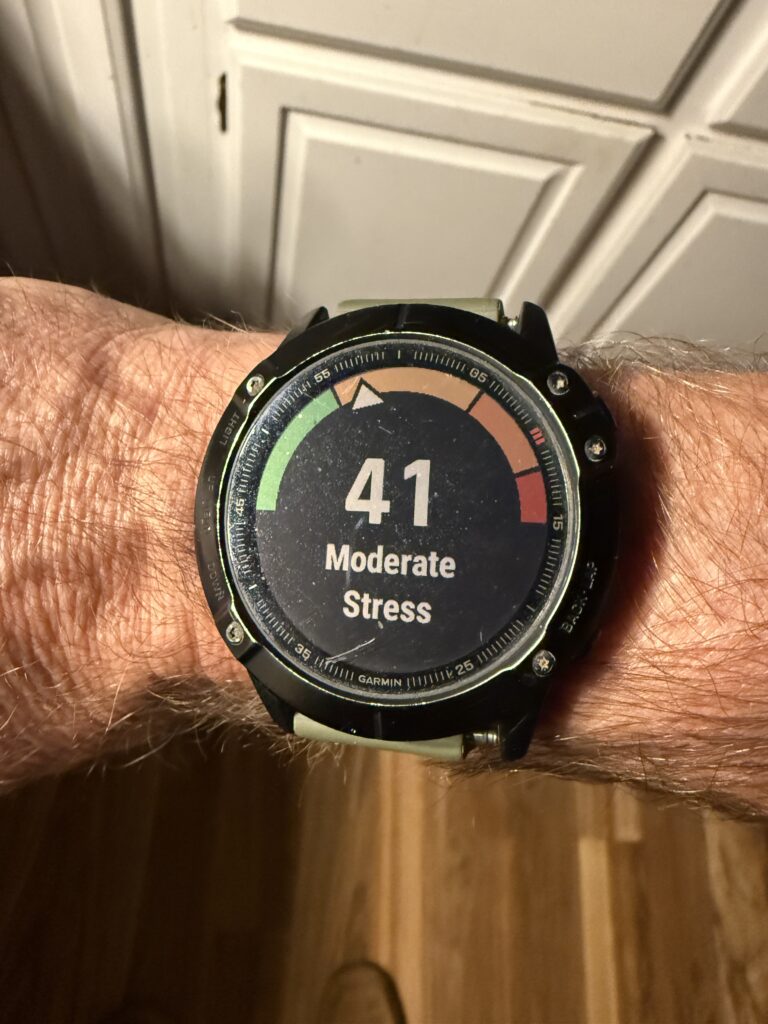
However, the Preflight isn’t a single-metric check. While the Sleep Score gave me the green light, my HRV Stress Score sat at 41 (Moderate). This was my “Yellow Light.” It signaled that while the battery was charged, the autonomic nervous system was still carrying some tension, which could influence the Garmin Sleep Score Ronnestad outcome.
Part II: Mapping the Garmin Sleep Score Ronnestad Breakthrough
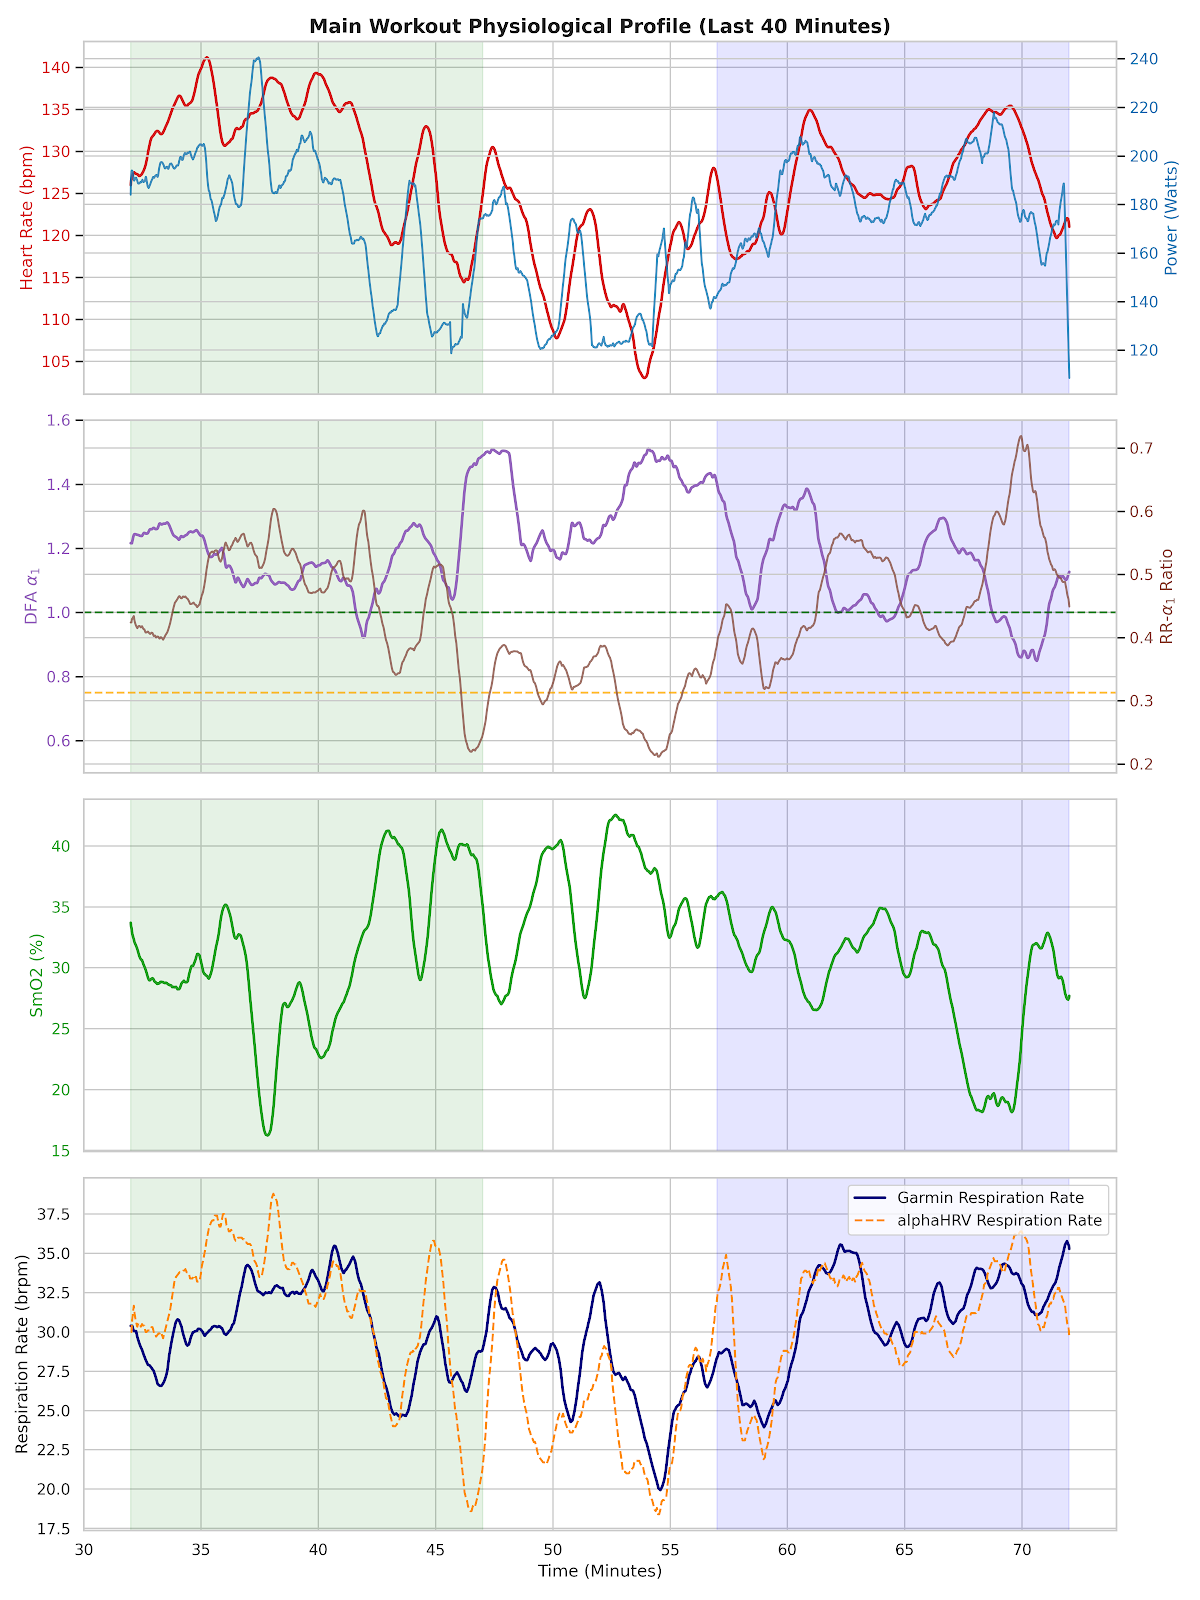
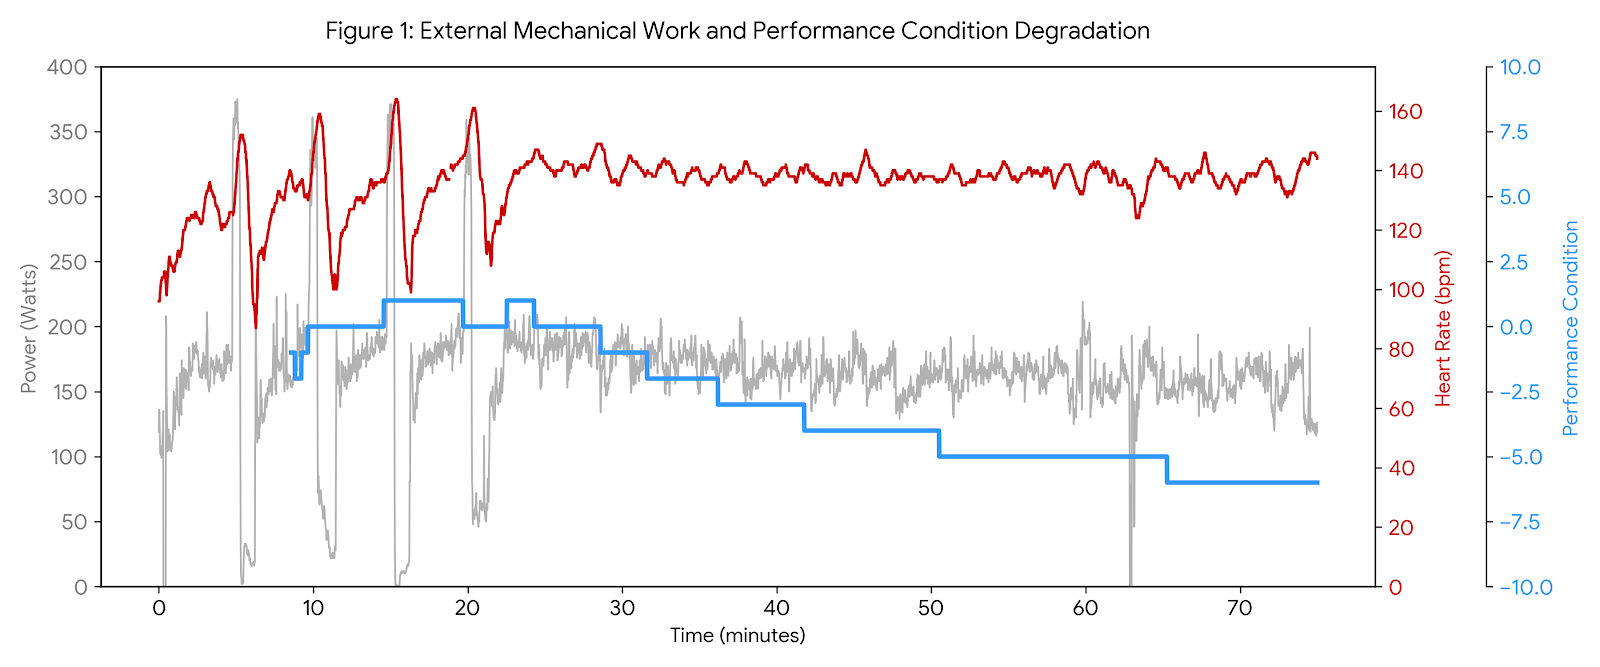
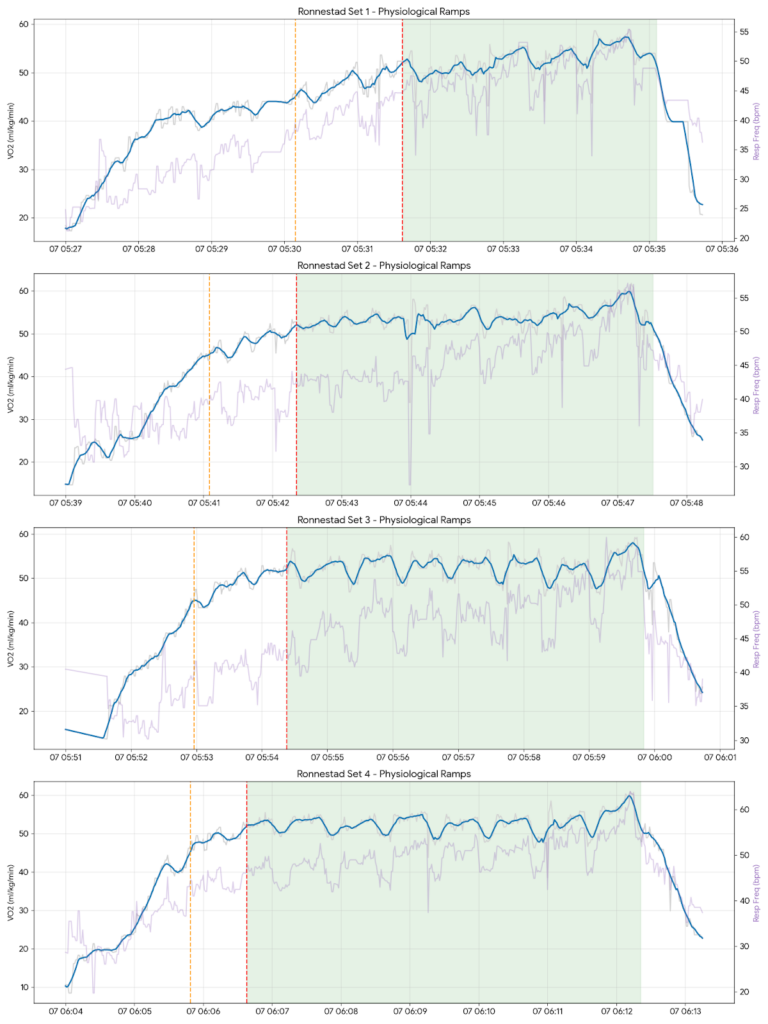
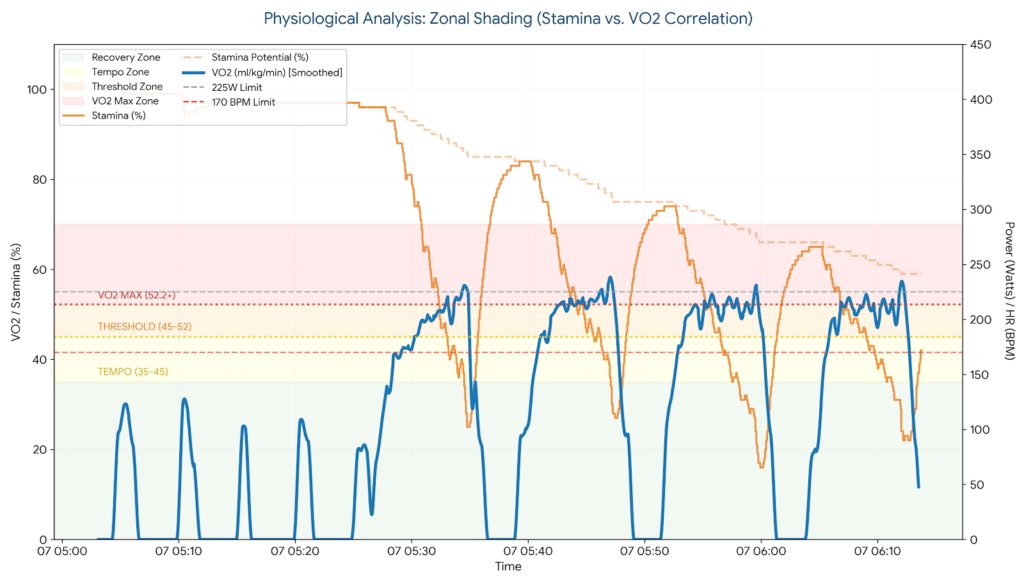
The mission: four sets of 10x 30-15s. This specific protocol, popularized by research from Bent Rønnestad, is designed to maximize the total time spent at or above 90% of VO2max. To look past the “Power Illusion,” I utilized Gaussian-smoothed VO2 data to see the true physiological redline during these efforts.
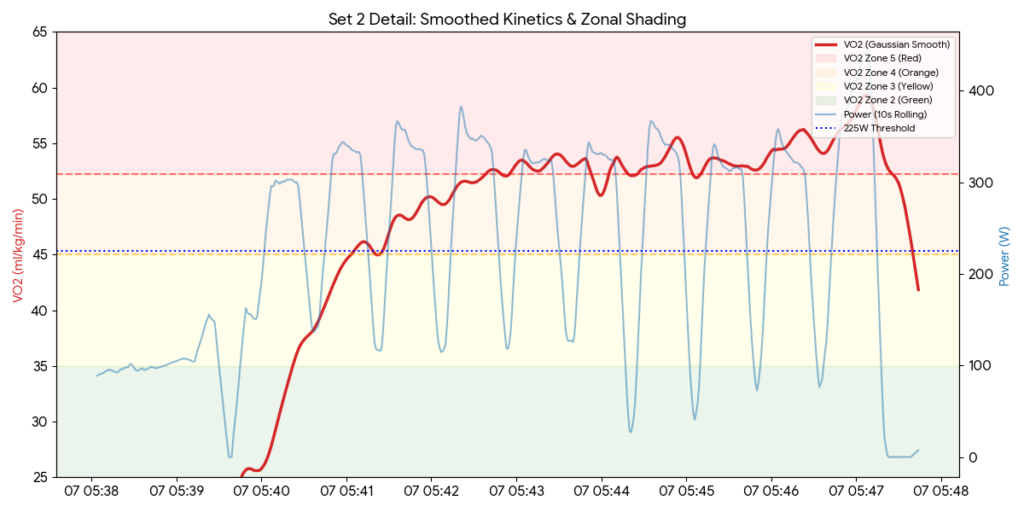
Set 2: The Efficiency Masterclass
In Set 2, my time in the Red Zone (above 52.2 VO2) peaked at 246 seconds. This represents the ultimate training goal: maximum aerobic stimulus with a controlled mechanical cost. By holding a steady 90 rpm cadence, I kept my oxygen extraction floor (SmO2 at 6.3%), validating the initial Garmin Sleep Score Ronnestad prediction.
The Fatigue Tax
By Set 4, the “Yellow Light” from the morning HRV Stress finally made its presence known. My Garmin Stamina reserves plummeted, and heart rate spent 100 seconds above 171 bpm. The fatigue was real, showing that even with a strong recovery, there is a tax for supramaximal work.
Physiological Efficiency Breakdown
| Set | Time > 52 VO2 (s) | Avg SmO2 (at >52) | Avg Cadence | NP (Watts) | Time HR > 171 (s) |
|---|---|---|---|---|---|
| 1 | 141 | 7.2 | 85 | 276 | 15 |
| 2 | 246 | 6.3 | 90 | 260 | 32 |
| 3 | 217 | 6.5 | 92 | 249 | 44 |
| 4 | 215 | 6.7 | 90 | 253 | 100 |
Conclusion: The Garmin Sleep Score Ronnestad Truth
Today proved that the Garmin Sleep Score Ronnestad correlation is a powerful predictor of successful training. By respecting the 225W threshold and monitoring real-time response, I turned a “Yellow Light” into 13 minutes of elite VO2 work. The data doesn’t lie: when you prioritize physiology, the breakthroughs follow.