
VO2 Master meets Garmin Dynamics: Quantifying Metabolic Economy and Chassis Demands on Peavine Dirt
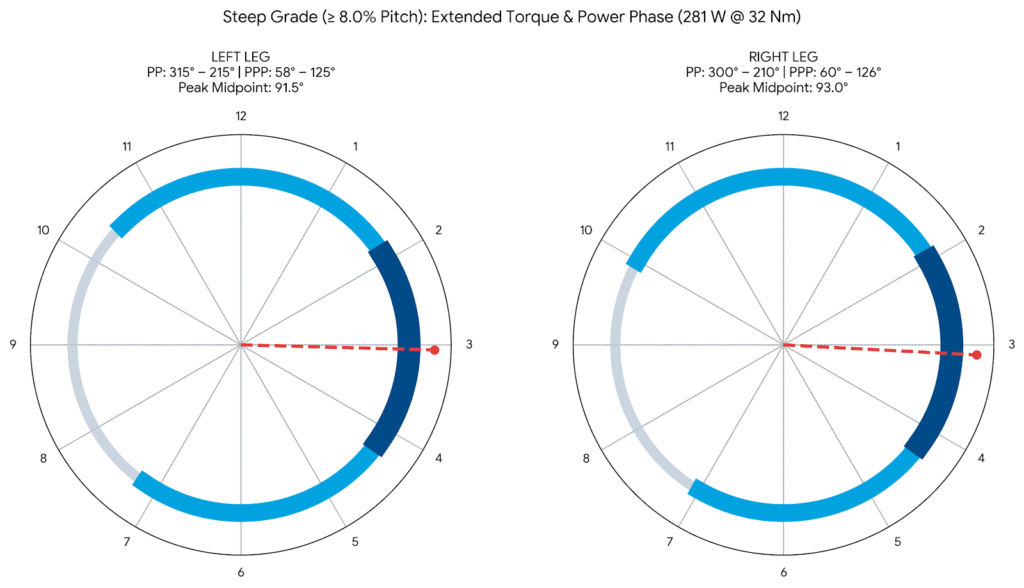
When analyzing Garmin Cycling Dynamics MTB telemetry across a full season, true progress isn’t just about riding faster—it’s about understanding how I rode faster. By comparing my lab-calibrated VO2 Master telemetry, dual-sided power metrics, and pedaling dynamics from my June 20th, 2026 baseline effort against my August 10th PR on the Halo Loop, the underlying […]
Tire Selection vs. Terrain: How Vittoria Rubber Saved 7.5% Effort on the Halo Loop
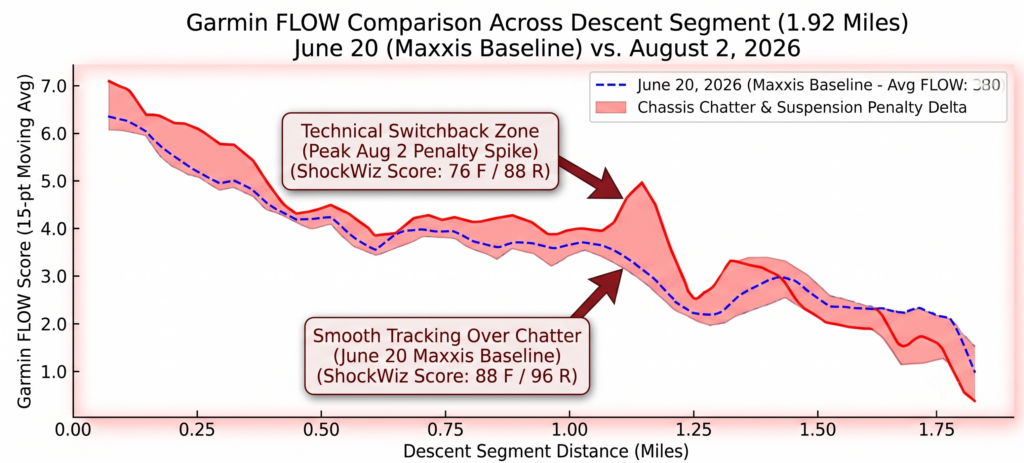
Tire Selection vs. Terrain: How Vittoria Rubber Saved 7.5% Effort on the Halo Loop By Richard Wharton | August 2, 2026 Proper tire selection on technical mountain bike trails plays a far greater role in overall efficiency than raw horsepower alone. If you ride strictly by feel, hot, dry summer dirt on Peavine Mountain’s benchmark […]
Mastering Garmin Performance Condition: Decoding Autonomic Stability and Aerobic Coherence Through Strategic Hydration
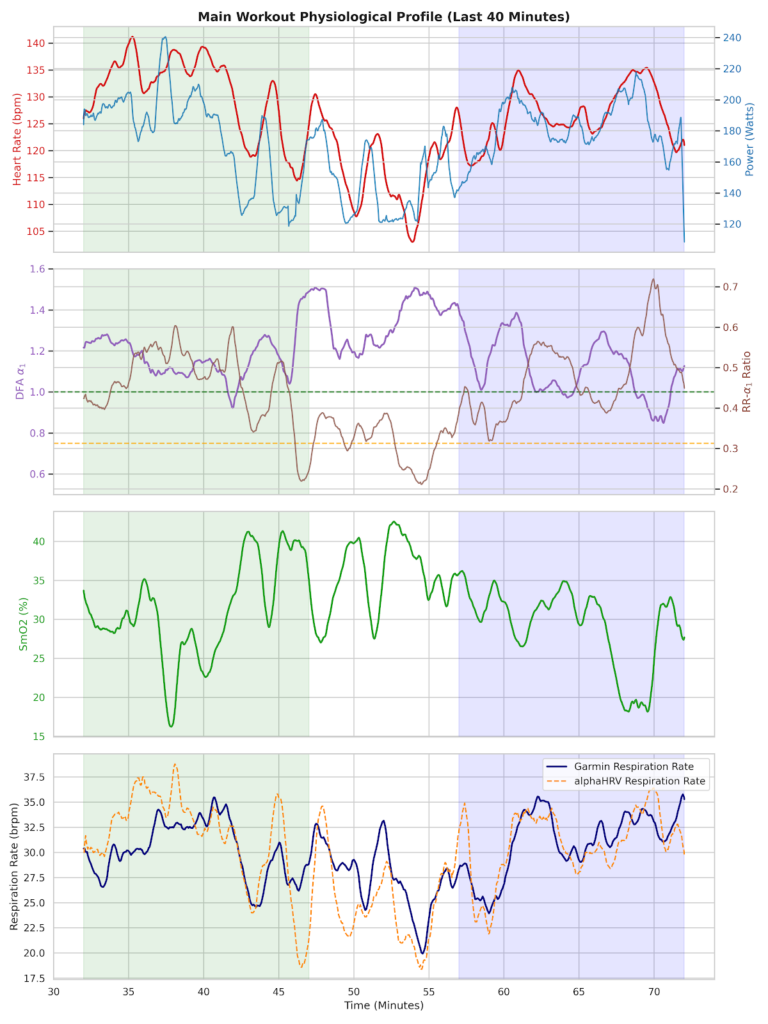
Mastering Garmin Performance Condition: Decoding Autonomic Stability and Aerobic Coherence Through Strategic Hydration For any cyclist serious about internal metabolic load, optimizing your training relies heavily on advanced metrics like Garmin Performance Condition tracking. Far more than a transient number that pops up ten minutes into your ride, it serves as a real-time metabolic voltmeter. […]
The Dissociation of the Internal and External Relays: Why a ‘Physiology First’ Approach Rules Ronnestad Intervals
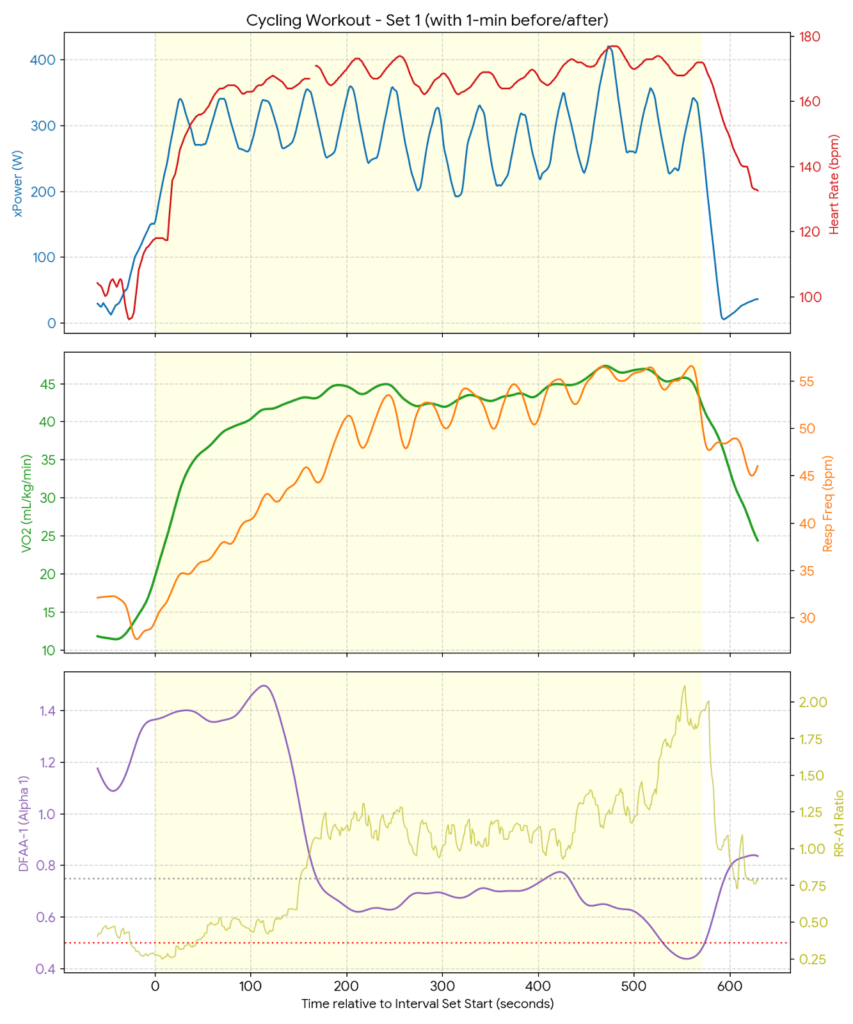
The Dissociation of the Internal and External Relays: Why a ‘Physiology First’ Approach Rules Ronnestad Intervals By Richard Wharton | Onlinebikecoach.com As coaches and hard-charging endurance athletes, we often fall into a trap. Specifically, we let external metrics dictate our training success. For example, we program an interval at a static target wattage. Next, we […]
Cracking the Code: My Physiology First Tabata VO2 Max Deep Dive
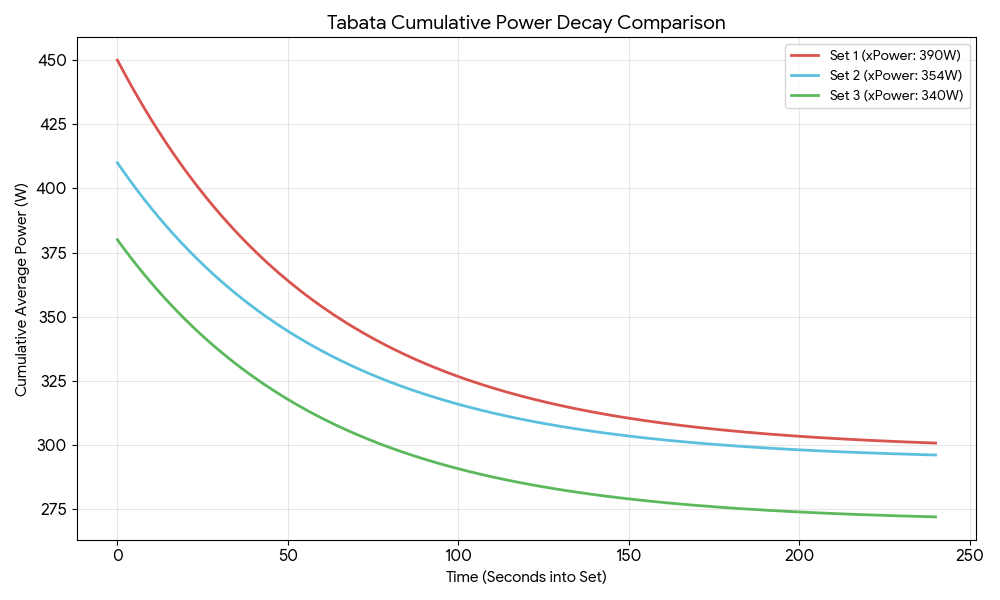
Cracking the Code: My Physiology and the Tabata Triple Threat Preface: The Metabolic Green Light vs. The CNS Red Light Before I even turned a pedal, the data was already telling a nuanced story. I woke up with a solid 83 sleep score and a body battery that recharged to 85—clear signals that my recovery […]
Rocky Terrain Suspension Efficiency: The Open vs. Locked Debate

May 7, 2026 Rocky Terrain Suspension Efficiency: The Open vs. Locked Debate; A Peavine Challenge In November 2025, I conducted a “Physiology First” experiment on Reno’s Peavine Mountain to analyze rocky terrain suspension efficiency. This ride has since become the archetype and benchmark for my 2026 training season. The mission was simple: Two laps on […]
Why Your “Free” Garmin Metrics are More Accurate Than You Realize
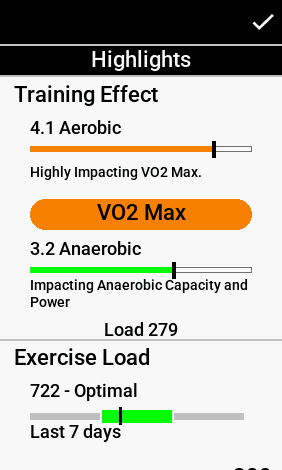
Why Your “Free” Garmin Metrics are More Accurate Than You Realize When athletes ask about Garmin VO2 Max accuracy, they are usually skeptical about whether a consumer wearable can truly measure the high-octane reality of a 15-15 interval set. On paper, today’s session was a classic builder—two sets of 15-minute micro-intervals—but as a physiology-first coach, […]
Life Stress is Training Stress: Navigating the 52-Hour Recovery Debt
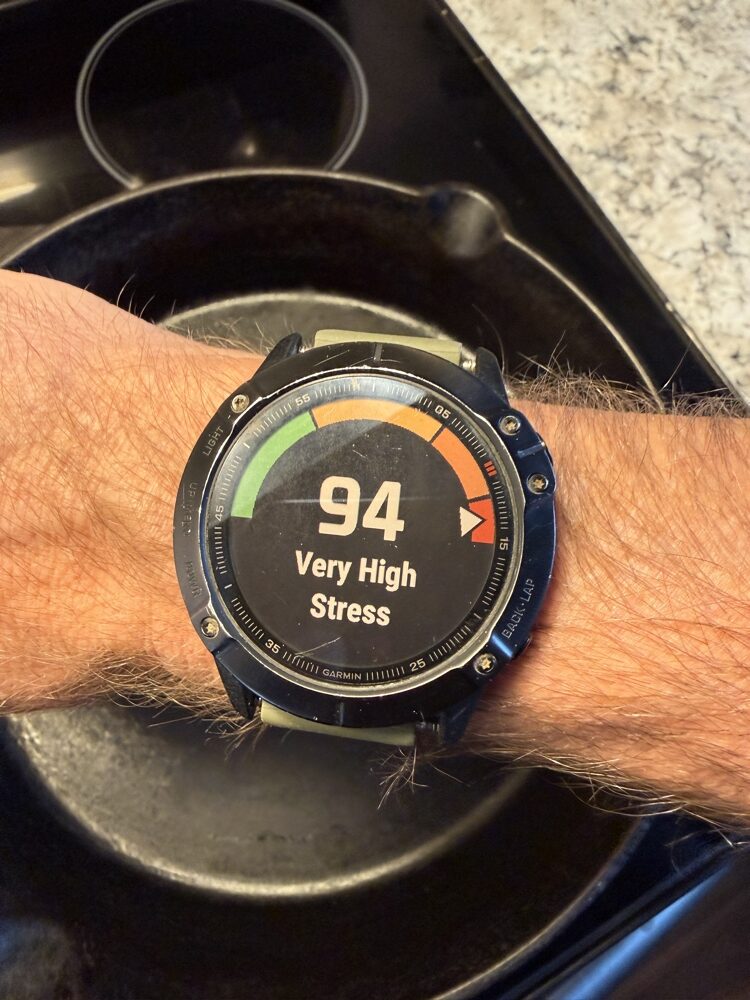
Garmin Recovery Metrics: When “Life Stress” Becomes a Physiological Debt Coach Richard Wharton Published: May 11, 2026 Understanding your Garmin recovery metrics is the only way to stay objective when non-training stress starts to bleed into your performance. Following our May 5th deep-dive into what those orange bars actually mean during sleep, today I’m showing […]
The Half-Glass Difference: How Alcohol Sabotages Your Garmin Recovery

When analyzing Garmin sleep recovery, alcohol is often the “X-factor” that derails even the most disciplined athlete. We’ve all heard it before: “It was just a couple of glasses of wine.” But as a coach who lives by the mantra Physiology is King, I’m less interested in what the menu says and more interested in […]
98% Charged: The +61 Garmin Body Battery Bounce Back
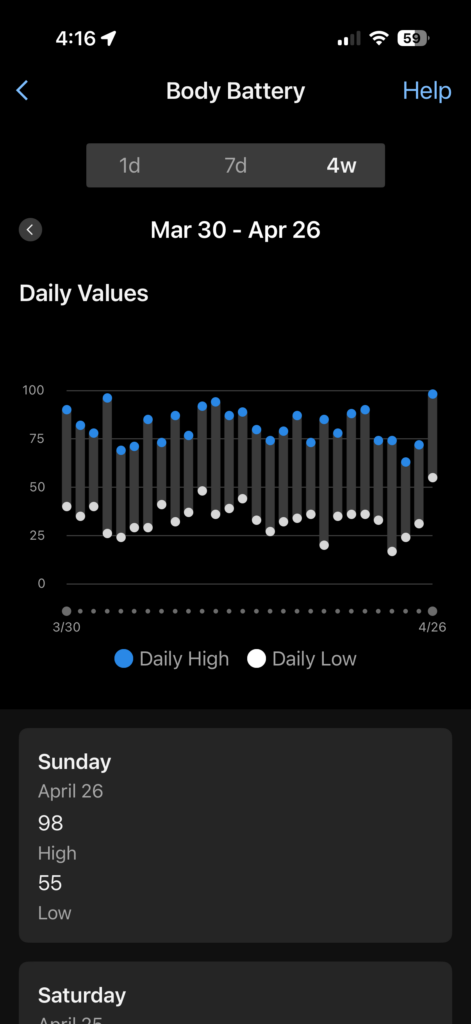
The Great Recharge: How I Pushed My Garmin Body Battery Back to 98 By Richard Wharton Achieving a massive Garmin Body Battery recharge is the ultimate goal after the physical toll of outdoor labor drains you to zero. Following up on my last post, I wanted to share the physiological “bounce back” results that took […]