Why Your “Free” Garmin Metrics are More Accurate Than You Realize
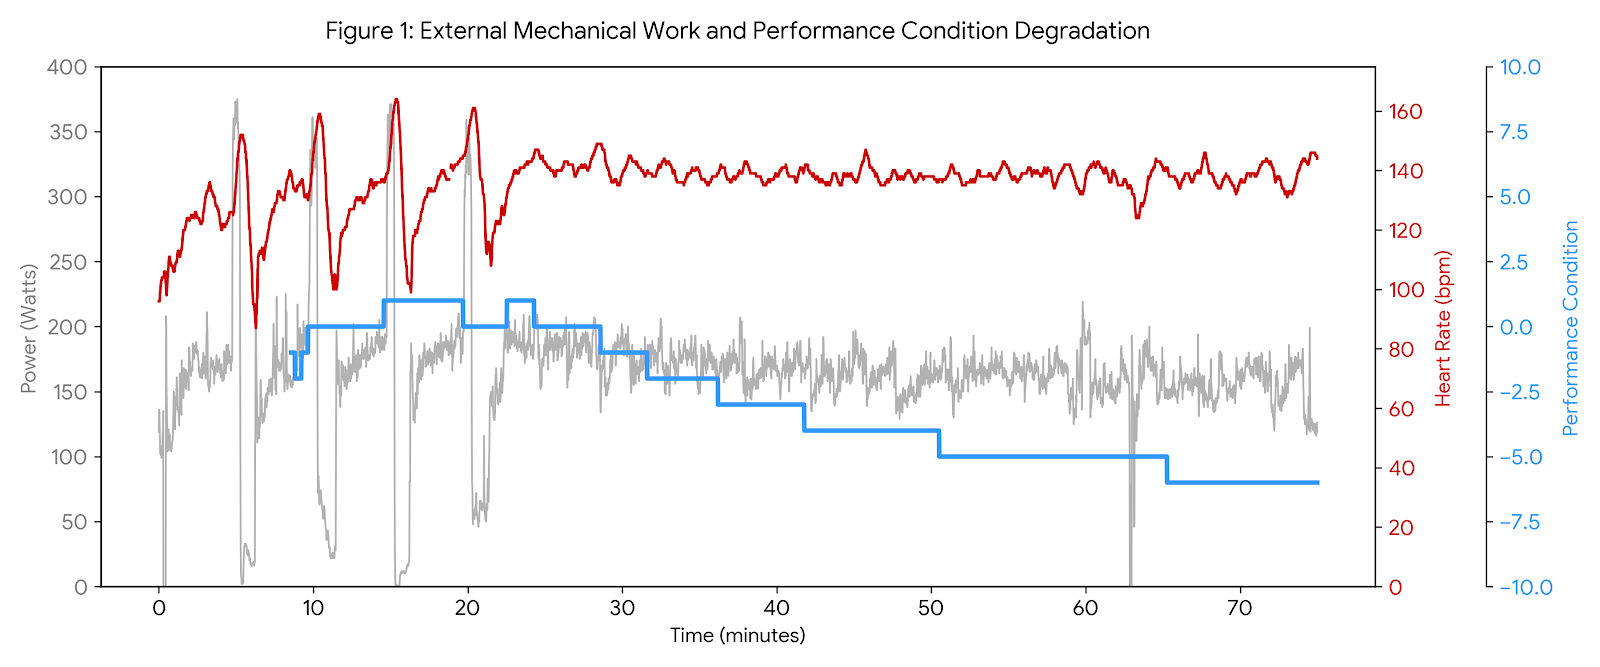
When athletes ask about Garmin VO2 Max accuracy, they are usually skeptical about whether a consumer wearable can truly measure the high-octane reality of a 15-15 interval set. On paper, today’s session was a classic builder—two sets of 15-minute micro-intervals—but as a physiology-first coach, my goal was to audit the algorithm. Does the “free” software on your wrist actually match the laboratory-grade data from a VO2Master?
After a three-day block off the bike, the data revealed a stark reality. While the brain remembered the protocol, the “engine” showed exactly how quickly peak aerobic power can decay without consistent high-intensity stimulus. The lowered volume leads to a significantly lower VO2 max response, proving that you must continue with high-intensity interval (HiiT) protocols on a regular basis to maintain fitness and health.
Testing Garmin VO2 Max Accuracy: The Execution Gap
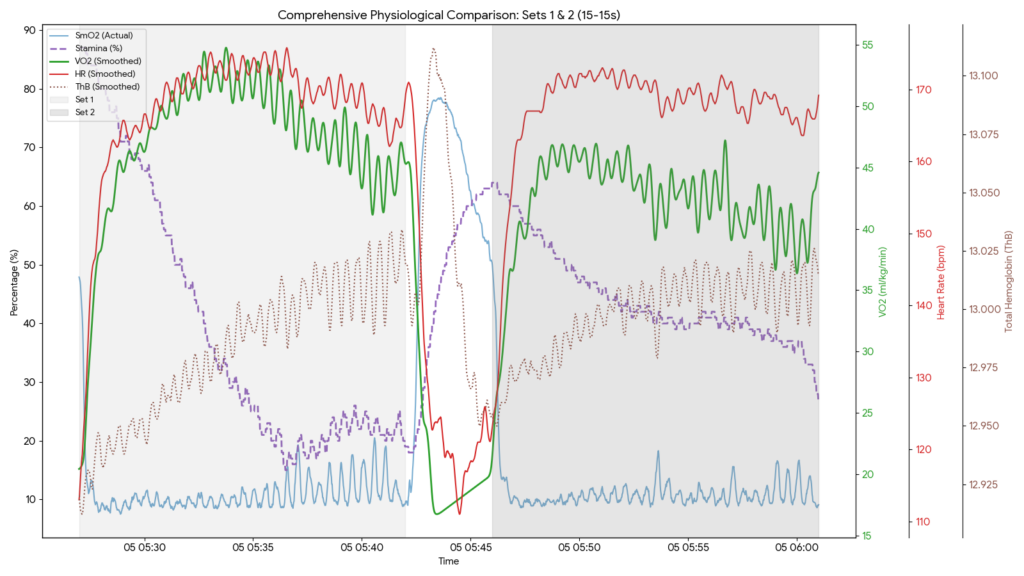
The divergence between the two sets tells the story of the “Execution Gap.” In Set 1, the intensity was sufficient to drive a true VO2 response. In Set 2, a mere 10% drop in power output was enough to fall out of the training zone entirely, despite the high internal strain. When we look at the data, the Garmin VO2 Max accuracy for this session was within a few percentage points of the lab-grade VO2Master, despite the drop in power.
| Metric | Set 1 Execution | Set 2 Execution |
|---|---|---|
| xPower (Skiba) | 254.1 W | 231.1 W |
| Peak VO2 (MM30s) | 53.18 ml/kg/min | 46.22 ml/kg/min |
| Active Avg VO2 (Post 2-min) | 48.77 ml/kg/min (91.7% of Peak) | 43.00 ml/kg/min (93.0% of Peak) |
| Avg Heart Rate | 170 bpm | 169 bpm |
| DFA Alpha-1 (Avg) | 0.52 | 0.47 |
Garmin VO2 Max Accuracy and the DFA Alpha-1 Correlation
One of the most fascinating aspects of modern training is the correlation between consumer metrics like Garmin Stamina and deep clinical markers like DFA Alpha-1. In the first set, as soon as the intensity drove DFA Alpha-1 below the 0.50 threshold, the Stamina metric began a precipitous drop. This real-time validation is why I believe Garmin VO2 Max accuracy is high enough for serious training decisions, provided you know how to interpret the “uncoupling” that occurs with fatigue.
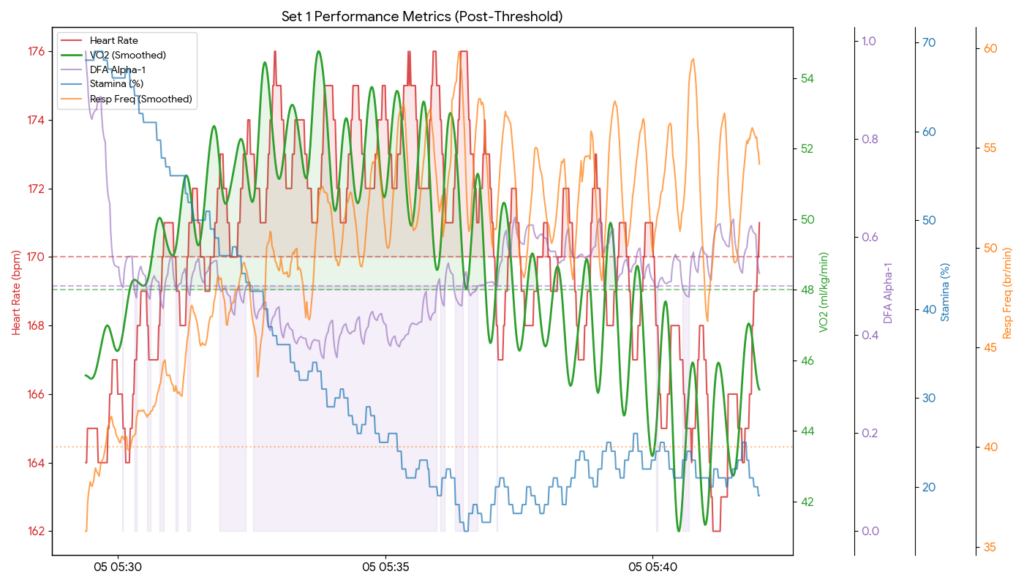
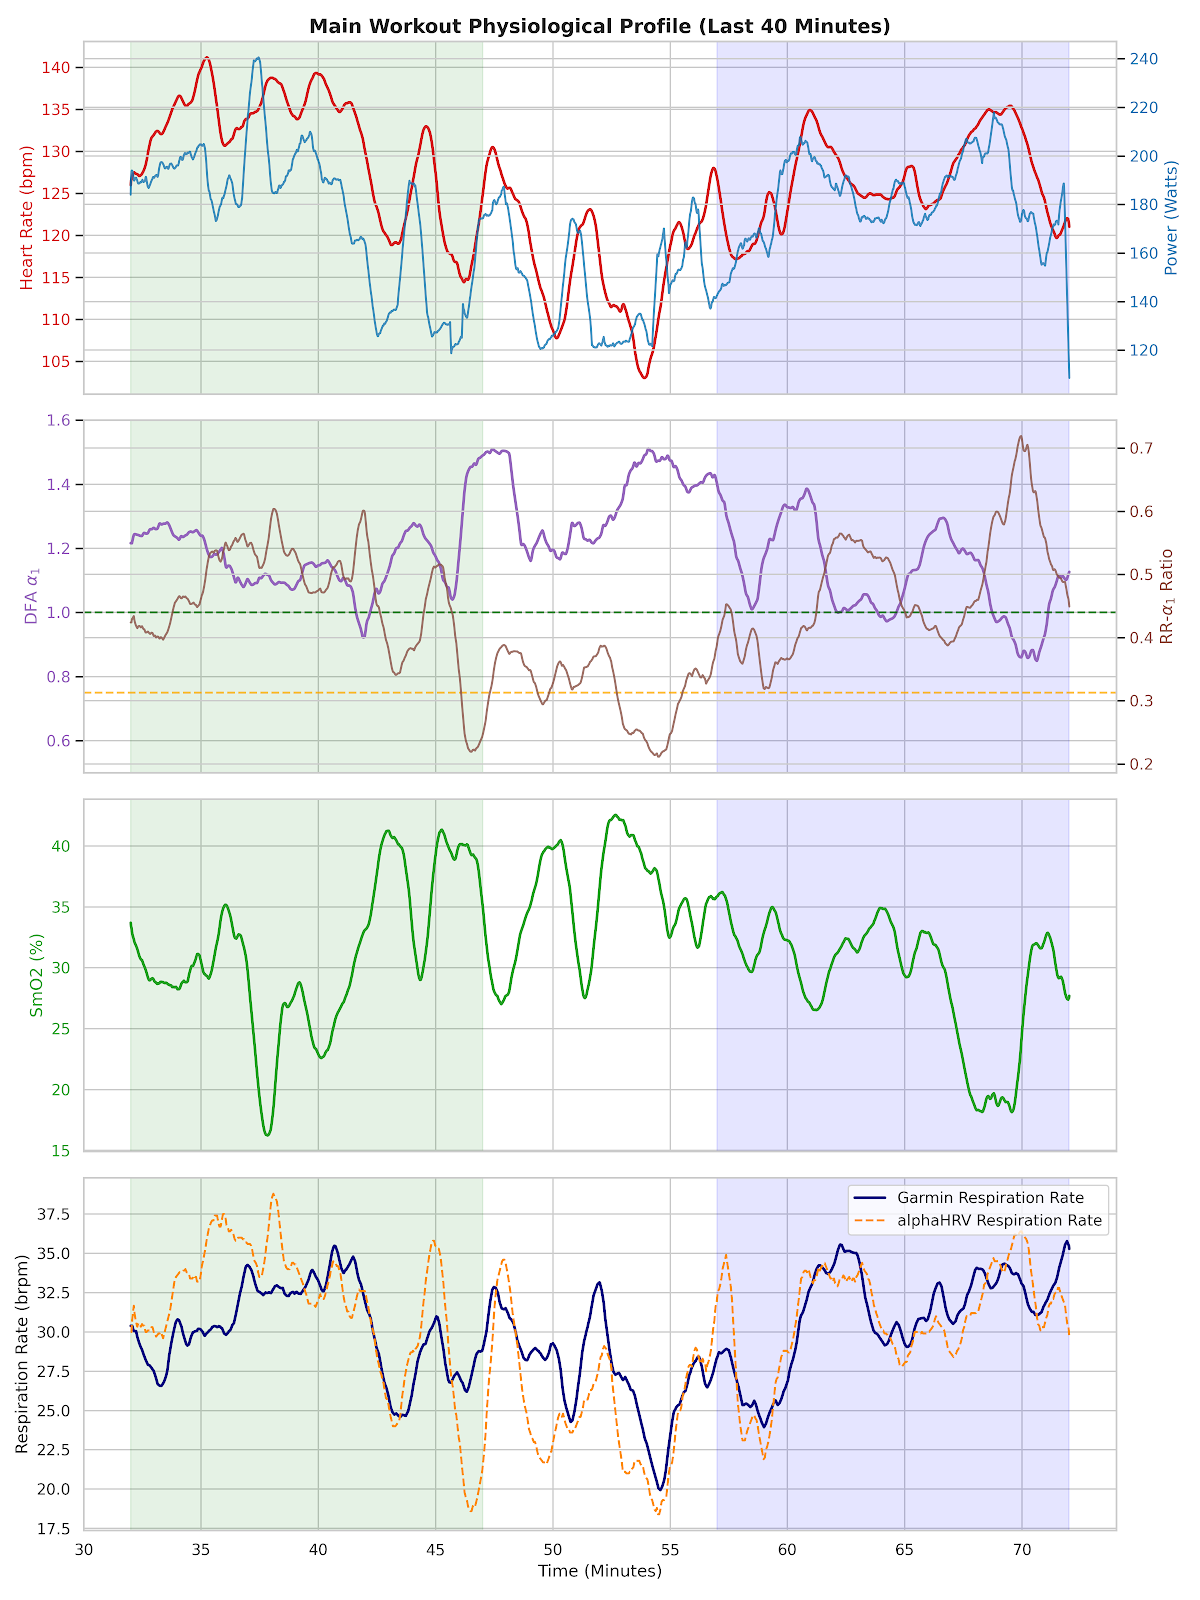
The Homeostasis Defense: Respiration vs. Heart Rate
As fatigue set in, a physiological “uncoupling” occurred. The heart rate settled in above threshold, but as the power sagged, the heart rate actually dropped back into Zone 4 and DFA Alpha-1 rose. However, Respiratory Frequency (RF) remained pinned at an extremely high level as the body desperately tried to blow off CO2 and return to homeostasis.
Muscular Defense Mode
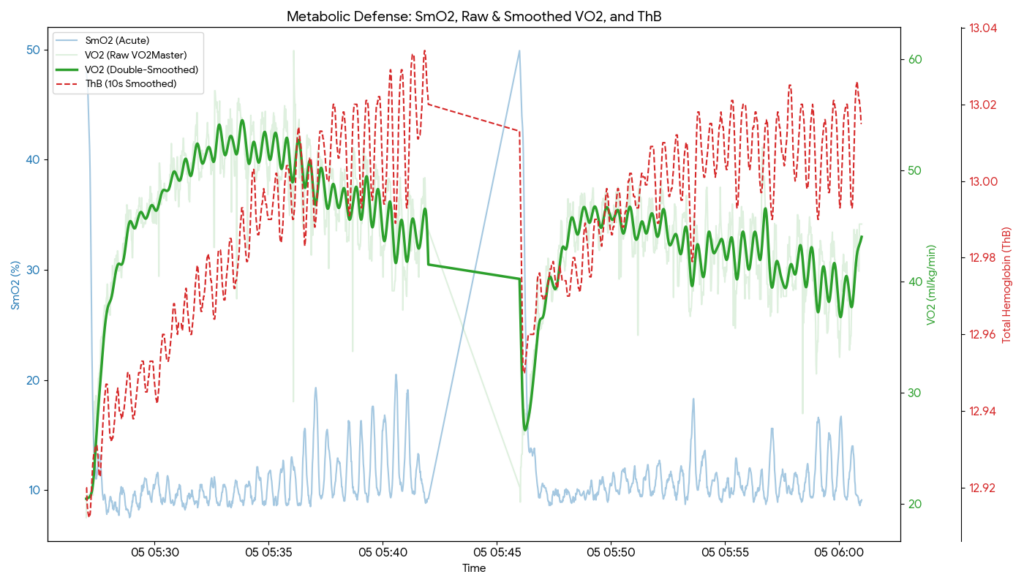
Looking at SmO2 and ThB (Total Hemoglobin), we can see the body entering “defense mode.” As SmO2 plummeted, ThB rose significantly—a clear sign that the vascular system was attempting to shunt as much blood as possible into the working tissue. Despite these defensive efforts, the aerobic ceiling was significantly lowered in the second set.
Sidebar: Garmin VO2 Max Accuracy vs. “Implied” Breathing
Using the VO2Master as the gold standard, we analyzed how “implied” respiratory rates from Garmin and AlphaHRV stack up. Both sources consistently underestimated actual breathing during high-intensity bursts. If you’re serious about your watts per kilogram, you need to look at the physical act of breathing, perhaps via a product like Tymewear.
| Metric | Garmin Enhanced RF | AlphaHRV (ECG-Implied) |
|---|---|---|
| Mean Error | -1.25 br/min | -3.82 br/min |
| Std. Deviation | 4.12 br/min | 4.33 br/min |