
Breaking the Plateau: How Step-Up Intervals Unlock Deep Vo2 Kinetics
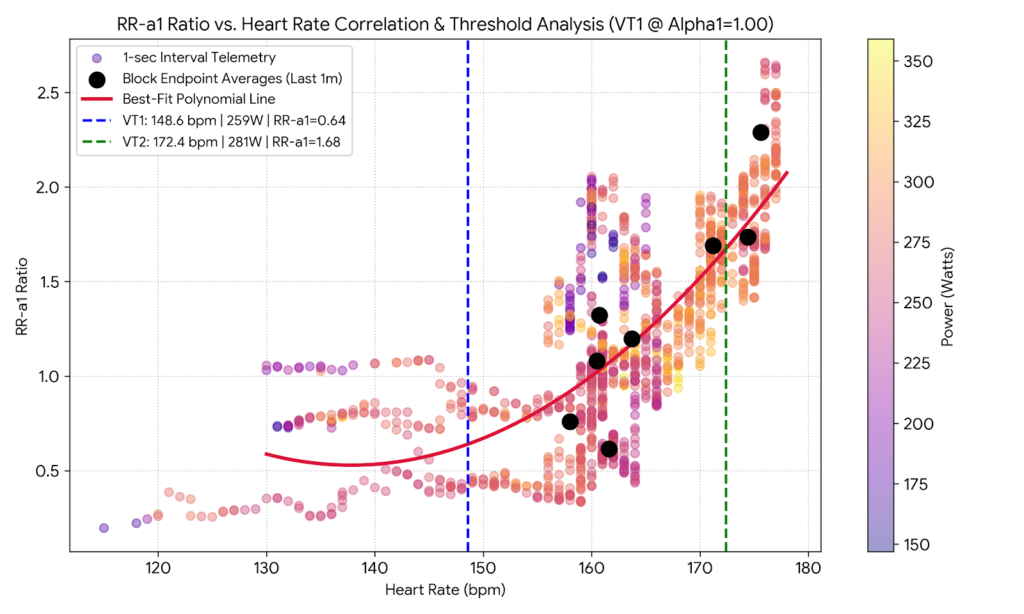
Breaking the Plateau: How Step-Up VO2 Max Intervals Unlock Deep Oxygen Kinetics By Richard Wharton | OnlineBikeCoach.com Executing step-up VO2 max intervals is one of the most effective strategies I use to drive time near maximal oxygen uptake without causing premature neuromuscular exhaustion. Standard flat-power VO2 max sets often result in either a slow […]
Trust Your Physiology First: Real-Time VO2max Pacing with AlphaHRV and Moxy
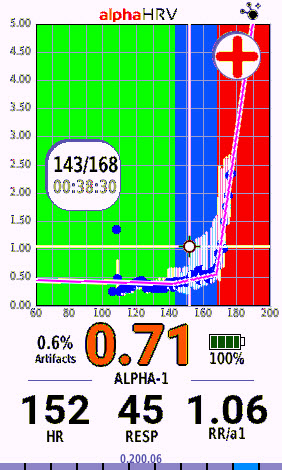
Trust Your Physiology First: Real-Time VO2max Pacing with AlphaHRV and Moxy By Coach Richard Wharton | Published: September 4, 2026 | Online Bike Coach AlphaHRV Vo2Max Training allows athletes to bypass static, pre-set heart rate zones and monitor live autonomic stress as it happens on the bike. Every morning we clip into the pedals, our […]
When “Easy” Power Isn’t Easy: A VO2 Master Data Deep Dive
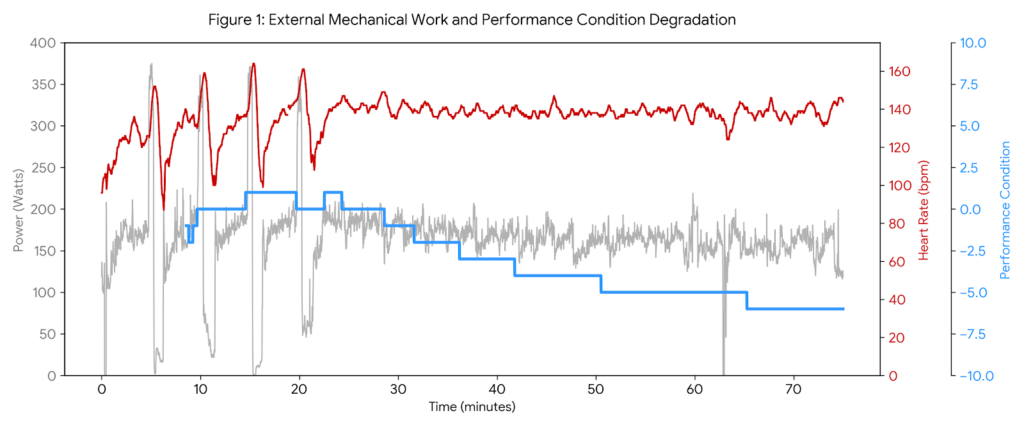
Analyzing VO2 Master data reveals a stark reality check from my ride this Friday morning. I expected a straightforward, low-intensity recovery base day. Instead, my body gave me a loud warning. Even though I intentionally kept my external intensity low, the internal cost of the ride was exceptionally high. This ride is a textbook example […]
Draining the Voltmeter: A 5 AM Lesson in Under-Fueling and Autonomic Collapse
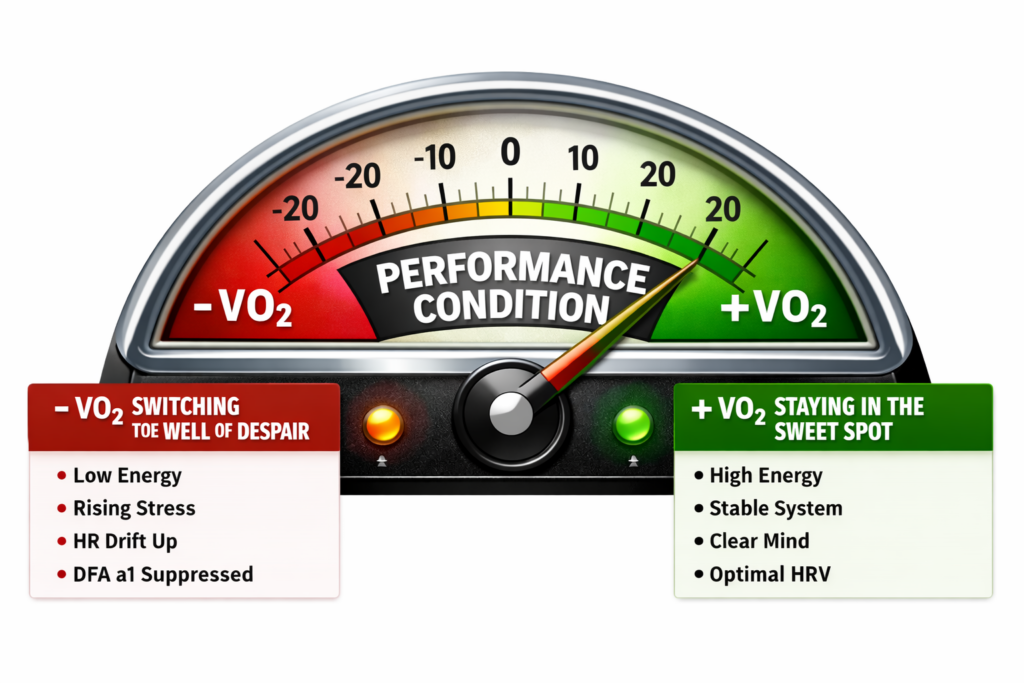
Forget Your Software’s Threshold: Your Physiology Rewrites the Rules in Real Time We’ve all been conditioned to treat our threshold like a monument carved in stone. Your bike computer, your smartwatch, or your coaching software gives you a single, static number—say, a functional threshold power (FTP) of 250W or a threshold heart rate of 162 […]
The Dissociation of the Internal and External Relays: Why a ‘Physiology First’ Approach Rules Ronnestad Intervals
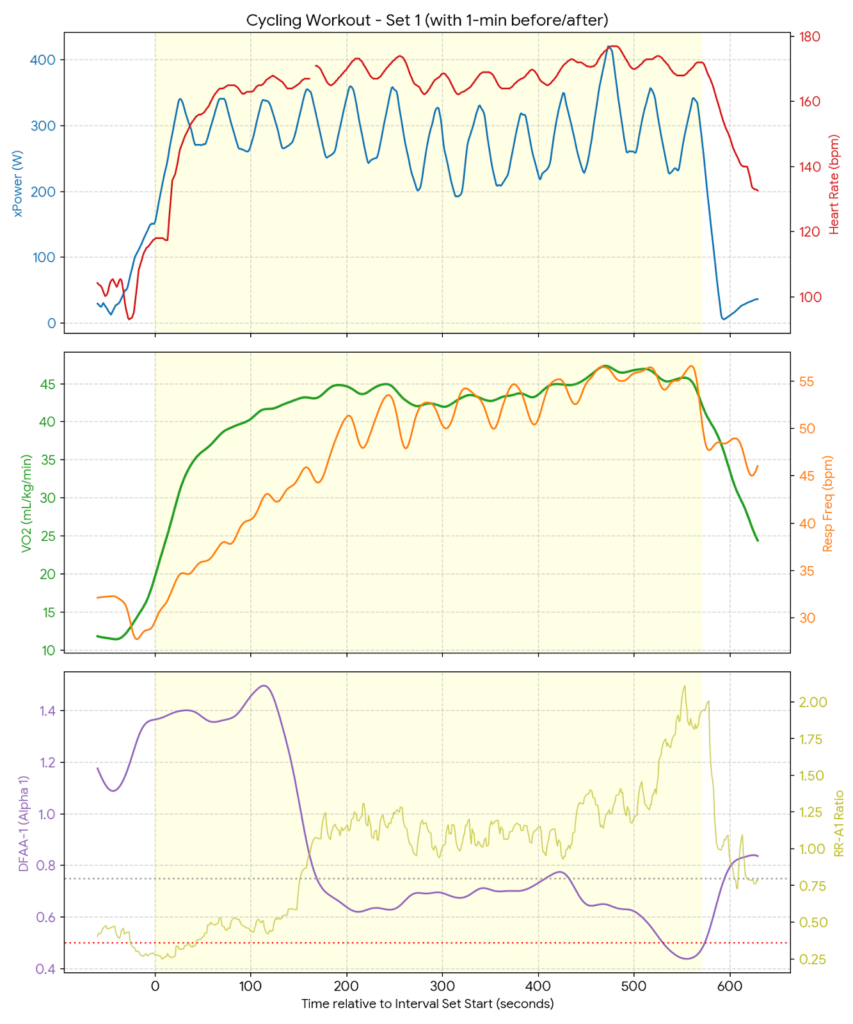
The Dissociation of the Internal and External Relays: Why a ‘Physiology First’ Approach Rules Ronnestad Intervals By Richard Wharton | Onlinebikecoach.com As coaches and hard-charging endurance athletes, we often fall into a trap. Specifically, we let external metrics dictate our training success. For example, we program an interval at a static target wattage. Next, we […]
Cracking the Code: My Physiology First Tabata VO2 Max Deep Dive
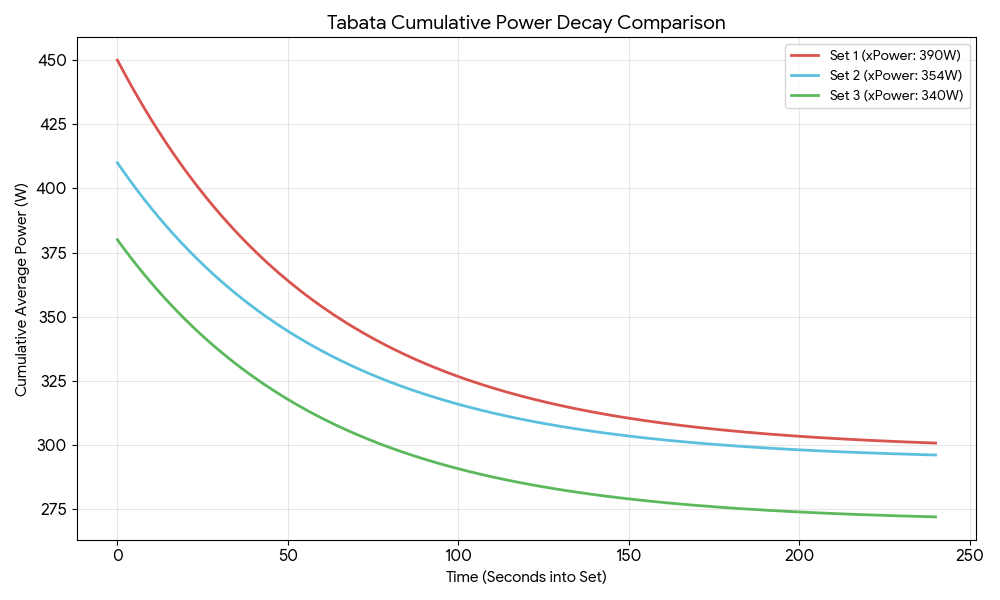
Cracking the Code: My Physiology and the Tabata Triple Threat Preface: The Metabolic Green Light vs. The CNS Red Light Before I even turned a pedal, the data was already telling a nuanced story. I woke up with a solid 83 sleep score and a body battery that recharged to 85—clear signals that my recovery […]
Stamina, Speed, Strength, and Skill – 4 Spokes With a Hub called “Consistency”.
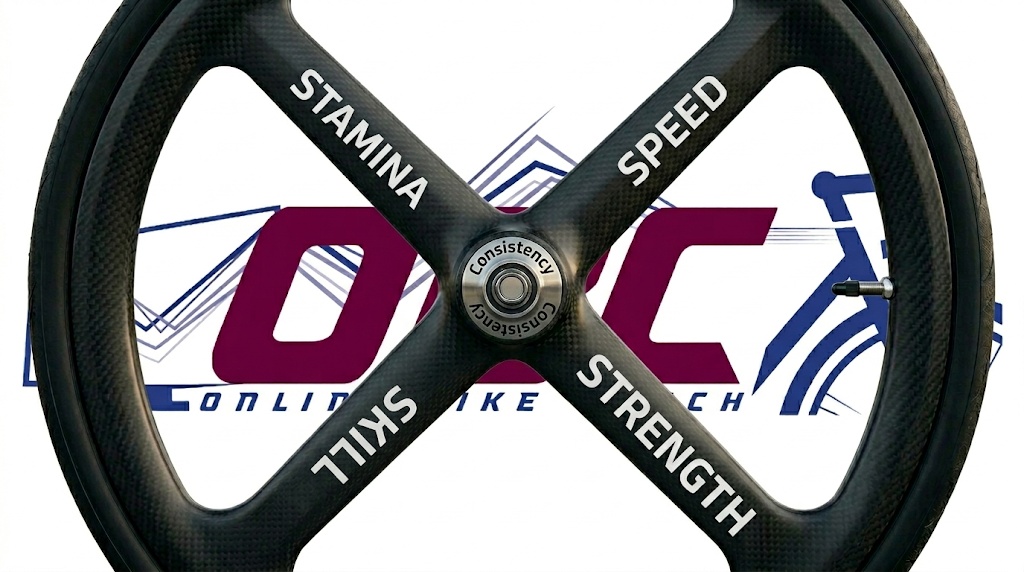
Cycling Stamina and Strength: The S4 Framework Building elite cycling stamina and strength is the foundation of the S4 performance framework used by high-performance athletes.In the world of professional cycling, we often get distracted by the latest gear or chasing the highest wattage. But at its core, your performance is a wheel supported by four […]
The Garmin Daily Double Dip: A Stamina and Potential Deep Dive
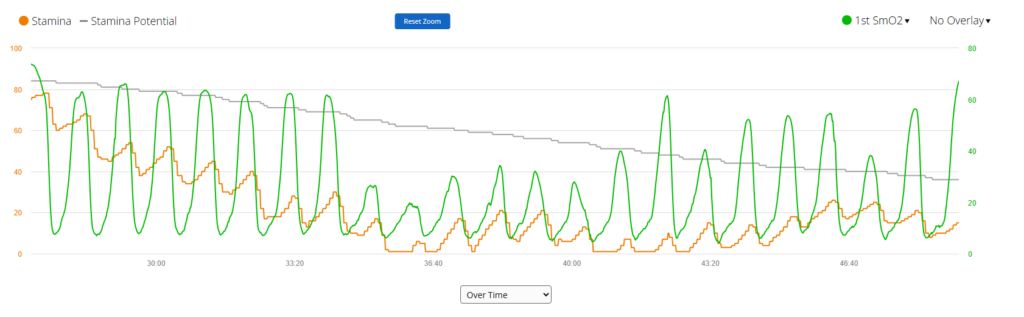
The Garmin Daily Double Dip: A Stamina and Potential Deep Dive Coach Wharton – May 7, 2026 Understanding Garmin Stamina metrics like Actual Stamina and Stamina Potential has fundamentally changed the way we analyze real-time capacity and athletic recovery. While Potential represents your total “fuel tank” for the entire ride, Actual Stamina reflects what you […]
Rocky Terrain Suspension Efficiency: The Open vs. Locked Debate

May 7, 2026 Rocky Terrain Suspension Efficiency: The Open vs. Locked Debate; A Peavine Challenge In November 2025, I conducted a “Physiology First” experiment on Reno’s Peavine Mountain to analyze rocky terrain suspension efficiency. This ride has since become the archetype and benchmark for my 2026 training season. The mission was simple: Two laps on […]
Why Your “Free” Garmin Metrics are More Accurate Than You Realize
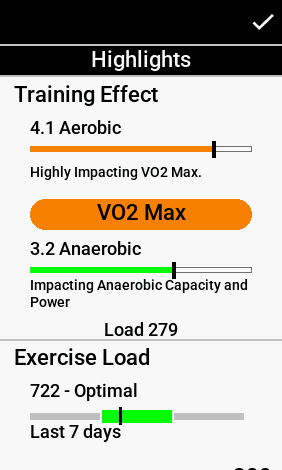
Why Your “Free” Garmin Metrics are More Accurate Than You Realize When athletes ask about Garmin VO2 Max accuracy, they are usually skeptical about whether a consumer wearable can truly measure the high-octane reality of a 15-15 interval set. On paper, today’s session was a classic builder—two sets of 15-minute micro-intervals—but as a physiology-first coach, […]