The Garmin Daily Double Dip: A Stamina and Potential Deep Dive
Coach Wharton – May 7, 2026
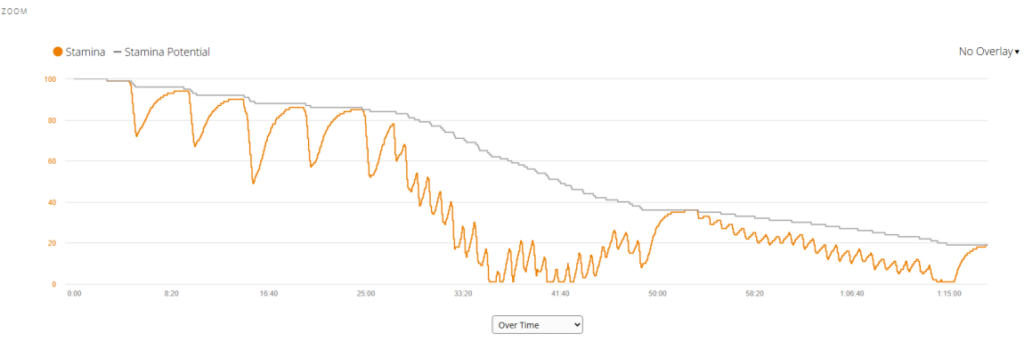
Understanding Garmin Stamina metrics like Actual Stamina and Stamina Potential has fundamentally changed the way we analyze real-time capacity and athletic recovery. While Potential represents your total “fuel tank” for the entire ride, Actual Stamina reflects what you have left right now for high-intensity work.
In this session, I went looking for the absolute floor. This is the story of the “Daily Double Dip”—a workout so intense that it forced the Garmin algorithm to flatline at 0% twice in a single session. This isn’t just about pushing pedals; it’s about a physiological “ball-buster” that reconciles muscle oxygenation with digital modeling.
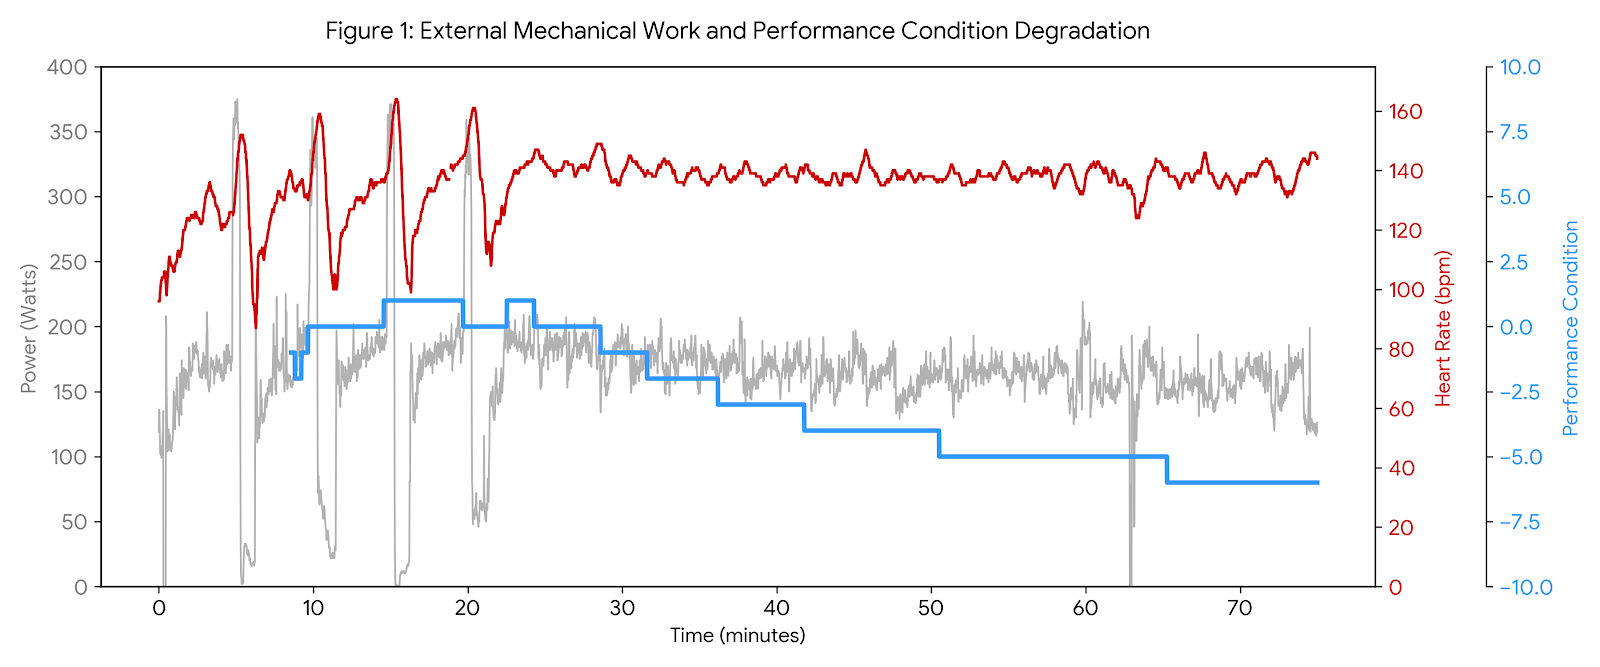
The Protocol: Analyzing Garmin Stamina Metrics and the Acute Metabolic Penalty
The workout consisted of two sets, each approximately 21 minutes long. The structure was a classic 15-second “on” effort followed by 45 seconds of recovery. While the average power for the sets provides a baseline, the real story lies in how the Acute Metabolic Penalty of those 15-second bursts impacts your Garmin Stamina metrics.
By applying the 4th-power math of Skiba’s xPower to the individual work phases, we can see the massive gap between what the hub feels and what the body pays for.
| 15-Second Work Phase | Set 1 Average | Set 2 Average |
|---|---|---|
| Average Power (On) | 524 W | 537 W |
| Burst xPower (Acute Penalty) | 561 W | 559 W |
Why use Burst xPower? Because the body’s physiological cost isn’t linear. While the drivetrain sees ~530W, your metabolic systems “perceive” an effort closer to 560W. When you perform nearly 50 of these penalized bursts, the anaerobic capacity ($W’$) doesn’t just drain; it gets hammered, leading to a total collapse of your Garmin Stamina metrics.
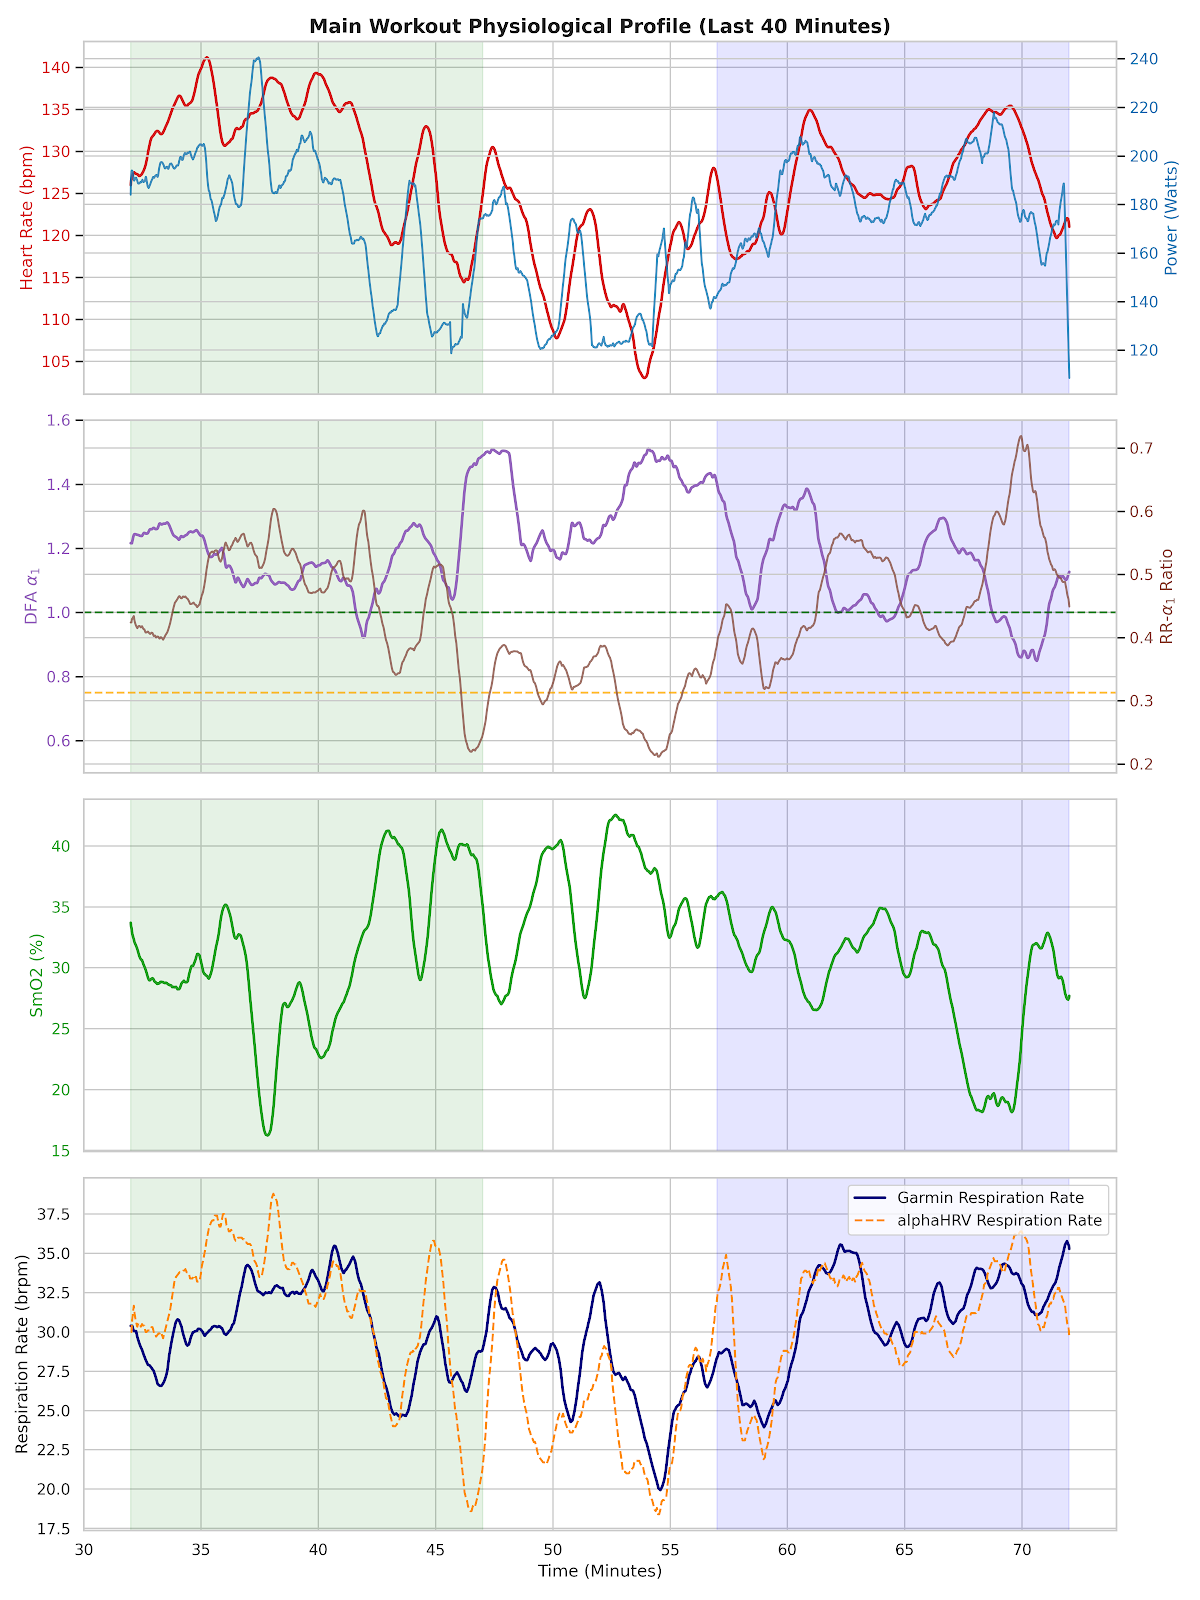
The Single-Digit Sufferfest (SmO2)
The Moxy SmO2 sensor provides the ground truth behind the digital display. During these efforts, I hit single-digit saturation on every single interval. Across 49 distinct efforts, SmO2 plummeted to between 4.0% and 9.9%. This is near-total oxygen extraction from the vastus lateralis.
To quantify the recovery, we look at Max Resat (Maximum Resaturation). In the table below, notice how the “refill” collapses toward the end of the ride.
| Interval | Min SmO2 (%) | Max Resat at 40s (%) |
|---|---|---|
| 1 | 5.7% | 35.1% |
| 20 | 5.3% | 61.2% |
| 48 | 4.8% | 6.4% |
Visualizing Depletion: Garmin Stamina Metrics vs. SmO2
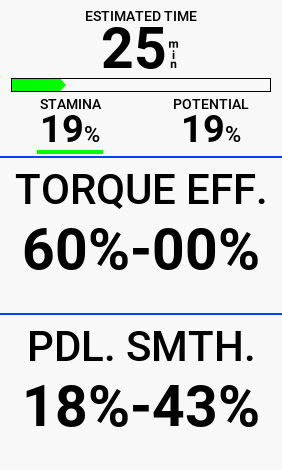
The relationship between this oxygen debt and Garmin Stamina metrics is undeniable. By setting our Threshold to 240W, we anchor the model to a high-performance baseline. Even at this aggressive threshold, the intensity of the work phases (560W Burst xPower) creates an unsustainable deficit.
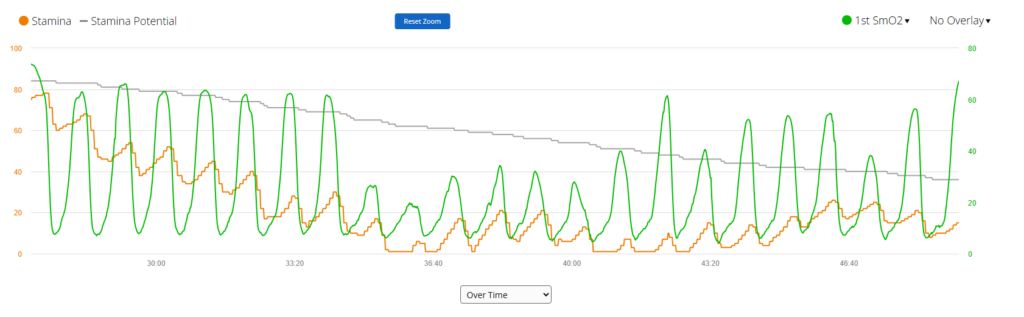
When SmO2 fails to recover, the Actual Stamina (orange) is forced to converge with the floor. As oxygen availability disappears, the algorithm recognizes that the anaerobic tank is empty.
Real-Time Evidence: Understanding Garmin Stamina Metrics on the Head Unit
The screenshots from the Garmin head unit tell the final story. Synchronizing the BMP timestamps with the Moxy data allows us to “read” the physiological state behind the screen and validate these Garmin Stamina metrics in real-time.
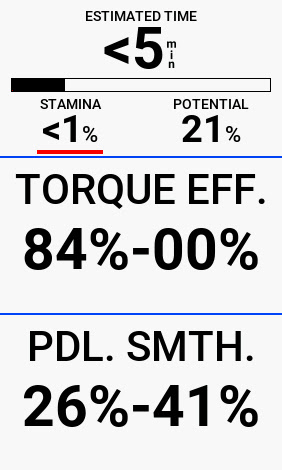
The Final Flatline (06:18:53 AM): At this moment, we see the absolute convergence. Power has dropped to 0W during the cooldown, but the Actual Stamina is pegged at 0%. Why? Because the recovery ceiling vanished—the SmO2 was sitting at 13.0% during this recovery phase, proving that the muscle hadn’t yet cleared the metabolic byproduct of the final set.
Summary: The Physiological Bill of These Garmin Stamina Metrics
The Garmin algorithm didn’t just guess that I was finished—it calculated a debt that my body couldn’t repay in real-time. As I’ve discussed in my previous post on W′, Critical Power, and Recovery Kinetics, the rate at which you “refill the tank” is non-linear and highly dependent on how close you stay to your threshold.
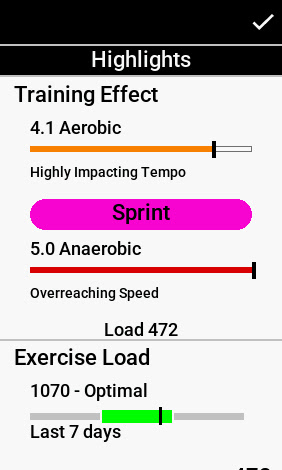
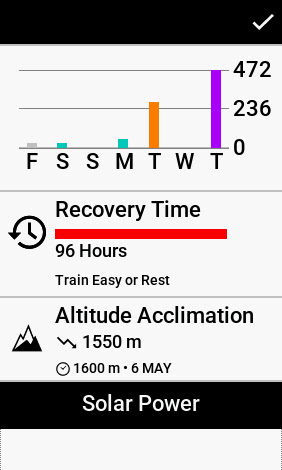
This workout resulted in a 5.0 Anaerobic Training Effect—the definition of an overreaching “Sprint” session. The exercise load of 472 was so substantial that Garmin triggered a 96-hour recovery time. This matches the SmO2 data perfectly; I had pushed the muscle so deep into single-digit saturation that the metabolic recovery would take days, not hours, to fully resolve.
The Saddle Penalty
I also analyzed the cost of performing these intervals in the saddle versus standing:
- In Saddle (417W Avg): More efficient, maintaining higher systemic balance.
- Out of Saddle (494W Avg): Higher peak power, but with a massive autonomic penalty. Standing allowed me to hit those single-digit SmO2 floors, but it accelerated the depletion of capacity significantly.
Addendum: The Adaptability of Garmin Stamina Metrics
One of the most fascinating aspects of Garmin Stamina metrics is their potential to adapt based on demonstrated performance. I suspect that because I successfully zeroed out the stamina twice, the algorithm will now adjust its internal parameters to account for this higher ceiling of suffering.
Essentially, I’ve shown the device that my system can handle deeper depletion and longer durations in the “red zone” than it previously modeled. If I were to attempt this “Daily Double Dip” again, I expect it would be significantly more difficult to reach that flatline. The watch has learned that my 0% is deeper than it thought; it will now expect even more work before it grants me that flatline status again.
This workout is proof that when you lead with physiology, the Garmin Stamina metrics follow. Understanding your “floor” is the key to mastering your capacity.
If you want to see just how valuable Garmin Metrics are in REAL-TIME…
Join my VQ Velocity virtual cycling classes for data-driven group coaching that actually moves the needle.
If you can’t join me for regular classes, Replays, or on-demand training, but like what you’re reading and feel it brings value to your Garmin experience, support the lab work and help me keep the data flowing.