
Mastering Garmin Performance Condition: Decoding Autonomic Stability and Aerobic Coherence Through Strategic Hydration
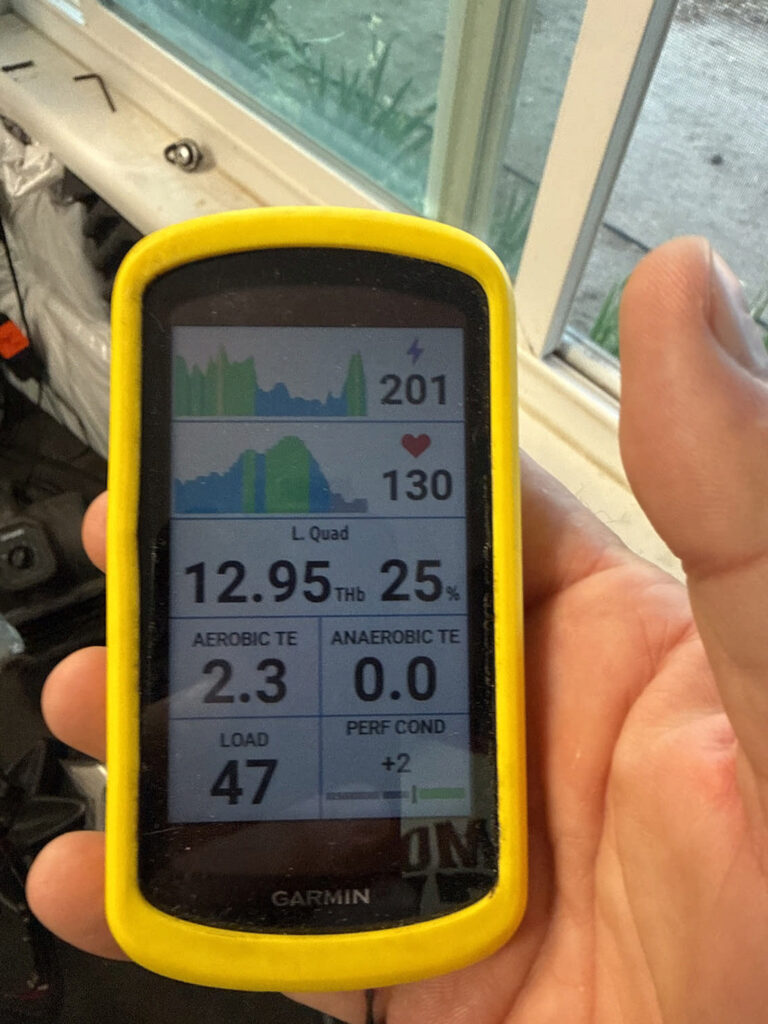
Mastering Garmin Performance Condition: Decoding Autonomic Stability and Aerobic Coherence Through Strategic Hydration For any cyclist serious about internal metabolic load, optimizing your training relies heavily on advanced metrics like Garmin Performance Condition tracking. Far more than a transient number that pops up ten minutes into your ride, it serves as a real-time metabolic voltmeter. […]
When “Easy” Power Isn’t Easy: A VO2 Master Data Deep Dive
Analyzing VO2 Master data reveals a stark reality check from my ride this Friday morning. I expected a straightforward, low-intensity recovery base day. Instead, my body gave me a loud warning. Even though I intentionally kept my external intensity low, the internal cost of the ride was exceptionally high. This ride is a textbook example […]
The Dehydration Decoupling: Managing Real-Time Metabolic Cost
The Dehydration Decoupling: Managing Real-Time Metabolic Cost By Rich Wharton – The Garmin Guru • Physiology First / Garmin Ecosystem Analysis Managing a sudden dehydration decoupling is the absolute secret to keeping your internal engine from running scorching hot during baseline workouts. Consequently, I started my Monday morning baseline endurance ride feeling like absolute gold, […]
Draining the Voltmeter: A 5 AM Lesson in Under-Fueling and Autonomic Collapse
Forget Your Software’s Threshold: Your Physiology Rewrites the Rules in Real Time We’ve all been conditioned to treat our threshold like a monument carved in stone. Your bike computer, your smartwatch, or your coaching software gives you a single, static number—say, a functional threshold power (FTP) of 250W or a threshold heart rate of 162 […]
Stop Ignoring Garmin Performance Condition: How to Use It as a Real-Time Health Governor
How I Used Performance Condition to Stay Healthy on Today’s Base Ride This morning’s ride wasn’t about speed or hero watts. It was about physiology, recovery, and learning how to leverage Garmin Performance Condition to protect my autonomic system. For the first time, I used this real-time metric as the primary governor for the entire […]
Real-Time Decompensation: Decoupling and the Anatomy of My Failed Workout
Every endurance athlete knows the feeling of hitting a wall, but few can see it coming down the track with mathematical precision, which is why monitoring your Garmin Performance Condition is so vital during hard blocks. Yesterday, I set out to complete a critical high-intensity maintenance block: 7×3-minute VO2max intervals targeting north of 270 watts. […]
Cracking the Code: My Physiology First Tabata VO2 Max Deep Dive
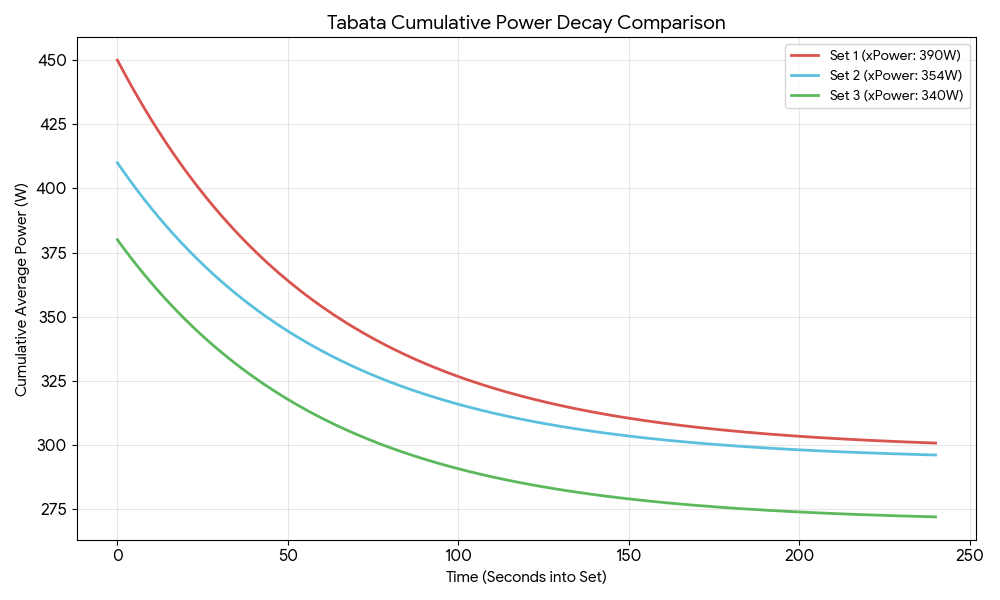
Cracking the Code: My Physiology and the Tabata Triple Threat Preface: The Metabolic Green Light vs. The CNS Red Light Before I even turned a pedal, the data was already telling a nuanced story. I woke up with a solid 83 sleep score and a body battery that recharged to 85—clear signals that my recovery […]
The Anatomy of a Good Ride; Physiology, Recovery, and the Portola Block

The Anatomy of a Good Ride: Physiology, Recovery, and the Portola Block I’ve always said that success on the bike isn’t a roll of the dice; it’s a deliberate convergence of external work and internal readiness. This week, I conducted a deep cycling physiology analysis of the Portola block to prove how disciplined recovery yields […]
Stamina, Speed, Strength, and Skill – 4 Spokes With a Hub called “Consistency”.

Cycling Stamina and Strength: The S4 Framework Building elite cycling stamina and strength is the foundation of the S4 performance framework used by high-performance athletes.In the world of professional cycling, we often get distracted by the latest gear or chasing the highest wattage. But at its core, your performance is a wheel supported by four […]
The Garmin Daily Double Dip: A Stamina and Potential Deep Dive
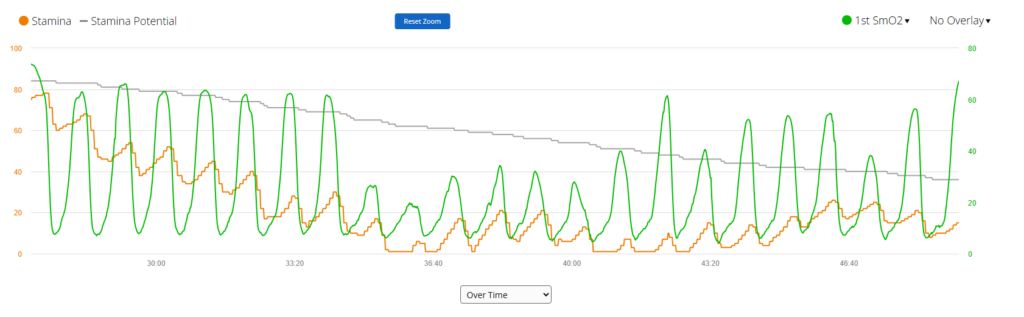
The Garmin Daily Double Dip: A Stamina and Potential Deep Dive Coach Wharton – May 7, 2026 Understanding Garmin Stamina metrics like Actual Stamina and Stamina Potential has fundamentally changed the way we analyze real-time capacity and athletic recovery. While Potential represents your total “fuel tank” for the entire ride, Actual Stamina reflects what you […]