The Anatomy of a Good Ride: Physiology, Recovery, and the Portola Block
I’ve always said that success on the bike isn’t a roll of the dice; it’s a deliberate convergence of external work and internal readiness. This week, I conducted a deep cycling physiology analysis of the Portola block to prove how disciplined recovery yields breakthrough numbers. My physiology was primed, and I saw something rare: more watts on fewer beats than in any previous effort.
Part 1: The Foundation of Autonomic Recovery
I knew this ride started four days ago. I’ve been watching my 28-day Body Battery and HRV Stress trends like a hawk, waiting for the sympathetic and parasympathetic systems to find their perfect balance. This “Gas and Brake” interplay is the engine of all performance. When the parasympathetic system is fully dominant, your body is ready to absorb the highest training loads.
We saw this at the highest level during Wout van Aert’s record-breaking win at the 2026 Paris-Roubaix. Blurry recce photos of his Garmin showed a Training Readiness score that signaled a multi-year physiological peak. Like Wout, I was waiting for that “Green Light.” By Saturday morning, it was unmistakable.
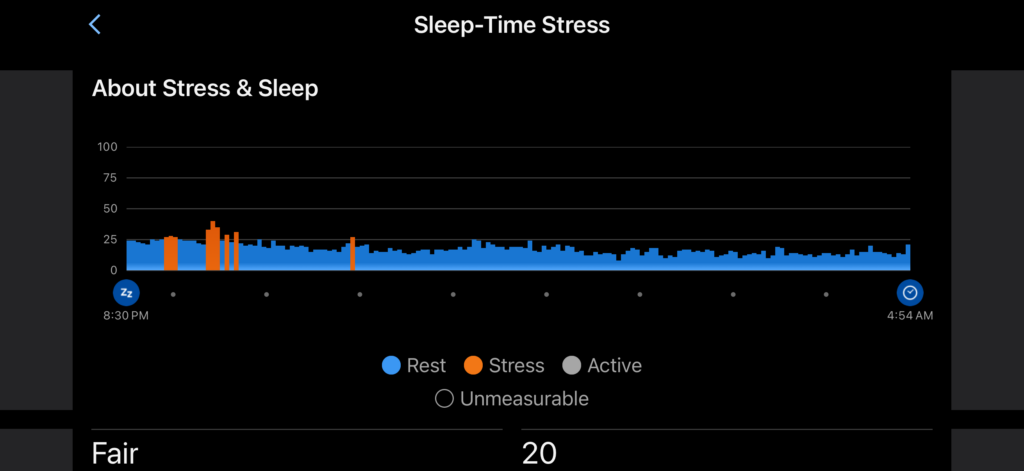
My Readiness Snapshot:Overnight Sleep Score: 84 (Great)
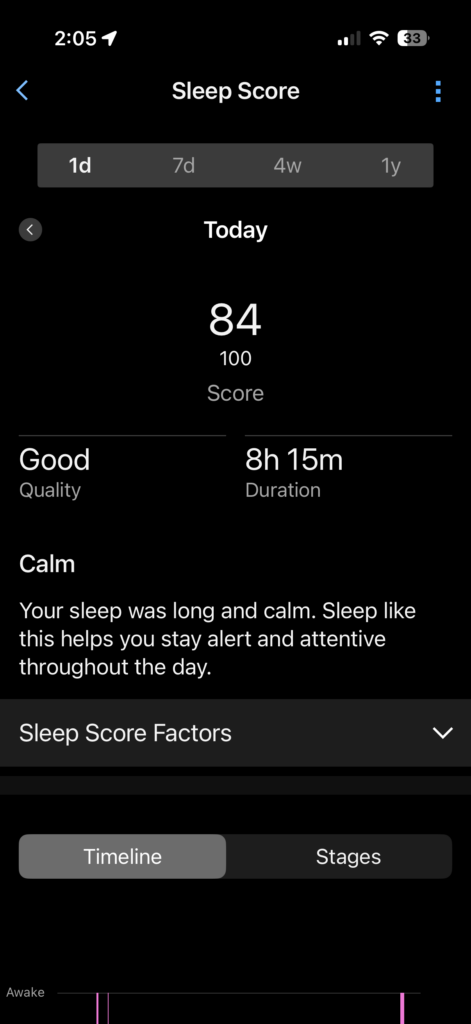
Overnight Stress: 20
Part 2: Breaking the Efficiency Barrier with Cycling Physiology Analysis
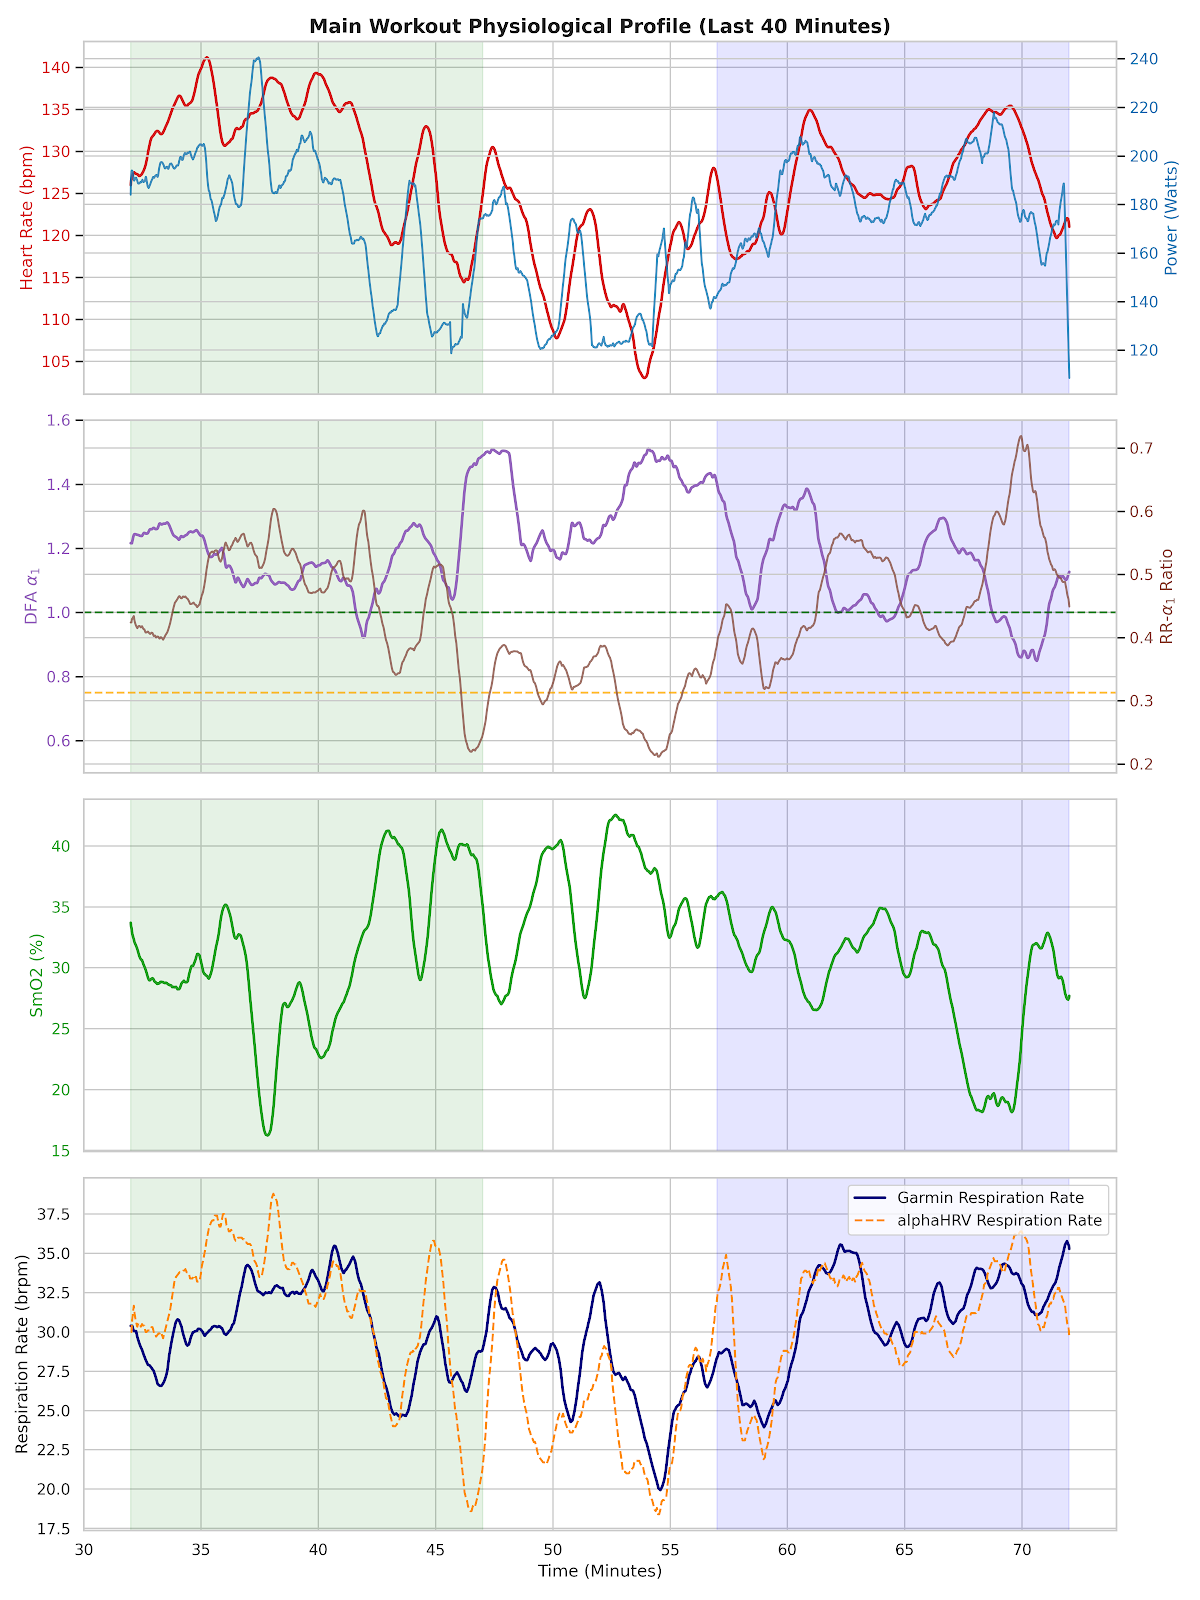
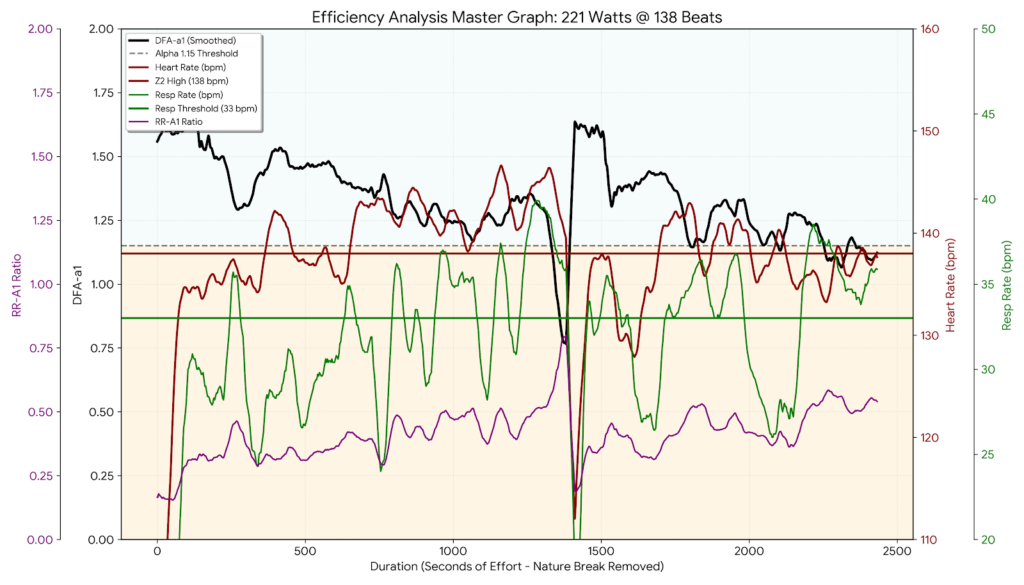
The real story of this ride was the efficiency. Below VT1, I held a steady 221 Watts at just 138 bpm. Crucially, my Alpha 1 (DFA-a1) average was a 1.33. This fractal indicator proves my autonomic nervous system was under remarkably low stress while producing a high power floor.
Part 3: The “Stamina Gap” – A Cycling Physiology Analysis
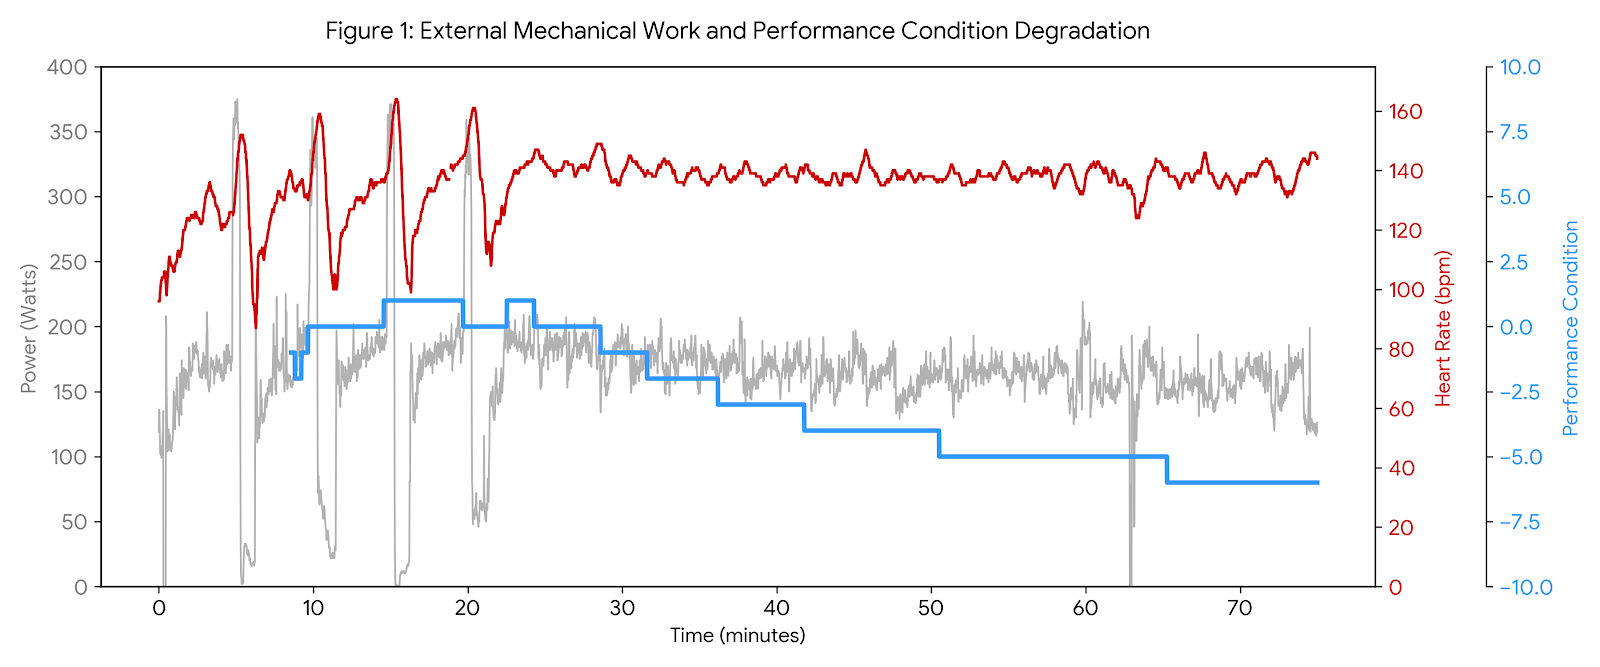
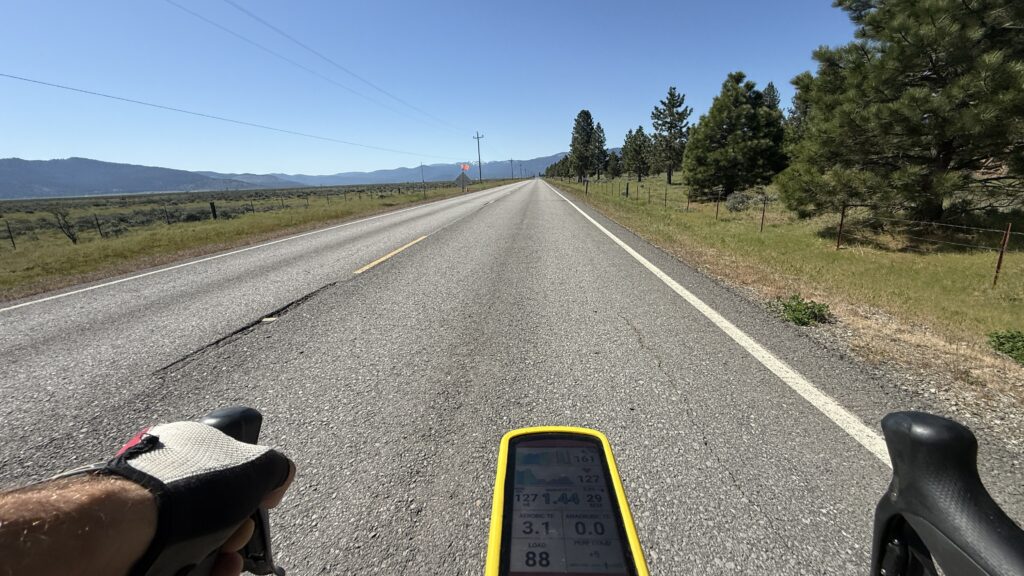
When we made the turn in Portola, I tested the ceiling. I pushed into a high-intensity climb, holding 280 Watts—what I now estimate as my actual Critical Power. As I looked at my Garmin, I saw my Stamina falling off a cliff, dropping from 36% to 1%.
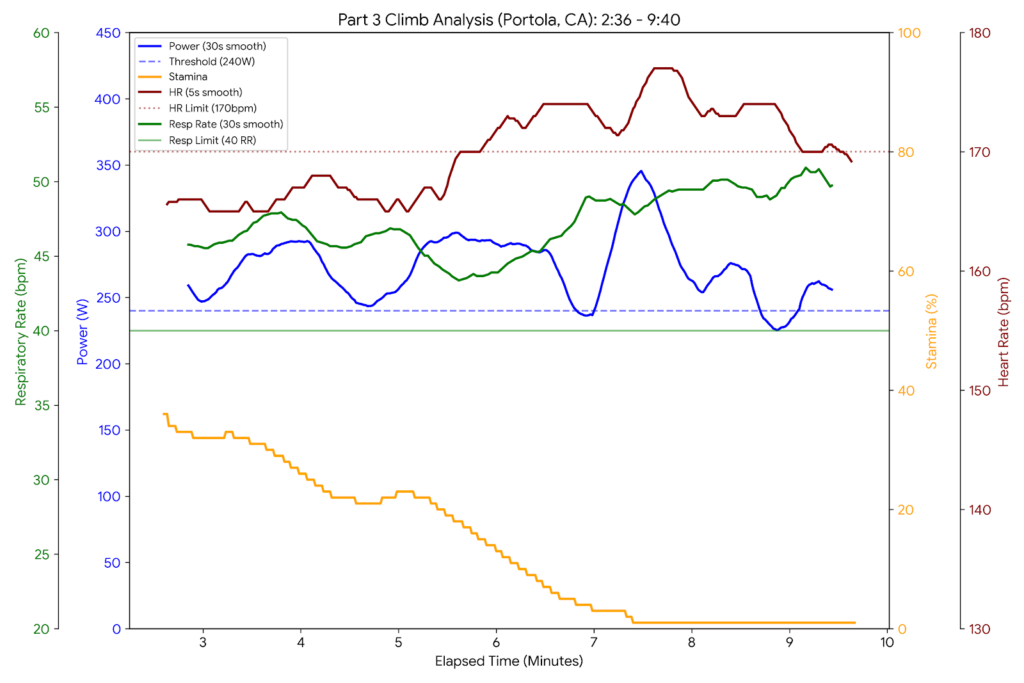
Why the discrepancy? My Garmin was still programmed with a Threshold of 240 Watts. Because I was holding 40 Watts above that setting, the device thought I was blowing up. But even as my DFA-a1 averaged 0.41—confirming I was in the high-intensity domain—I was still managing the load. This cycling physiology analysis reveals a gap between my current Critical Power and the software’s estimate.
Drainage Rate: -4.95% per minute
Conclusion: A New Physiological Anchor
This ride was a breakthrough. By analyzing my Critical Power and the autonomic recovery shift following high-intensity blocks, we can confirm that a 0.5 DFA-a1 and a 1.5 RR-A1 are valid markers for my VT2.
I am confidently moving my Conservative Threshold Power to 265–270 Watts. The lesson: Physiology is King. Tuesday is the real test.
Learn how to use Garmin Metrics and Custom Fields in REAL TIME, 5 days a week.
Step 1: Join the VQ Velocity Virtual Studio to keep your fitness sharp with live, data-driven sessions.
Step 2: Support my mission to bring physiological data of Garmin wearables to the forefront of training.