
Cracking the Code: My Physiology First Tabata VO2 Max Deep Dive
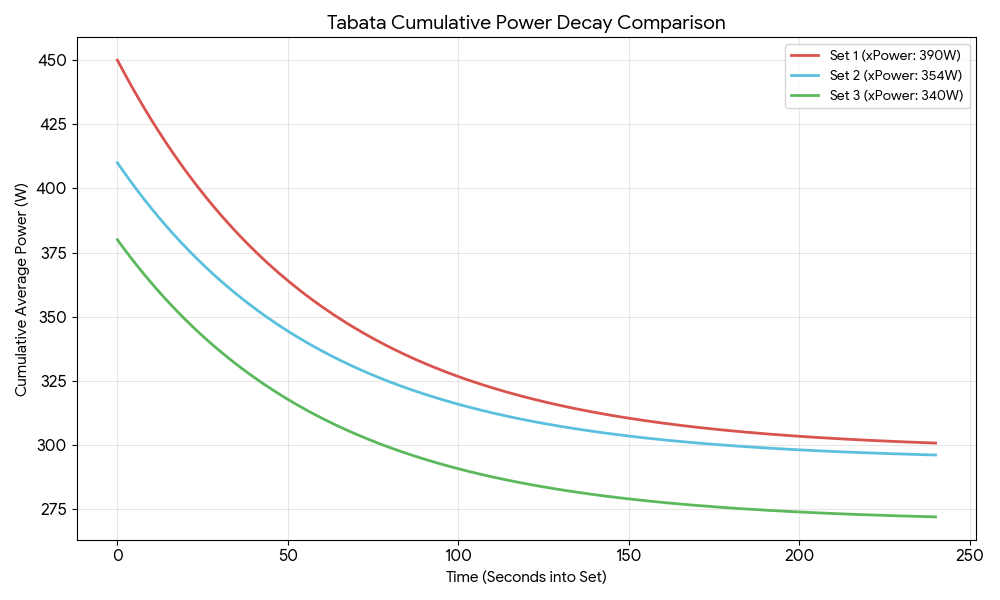
Cracking the Code: My Physiology and the Tabata Triple Threat Preface: The Metabolic Green Light vs. The CNS Red Light Before I even turned a pedal, the data was already telling a nuanced story. I woke up with a solid 83 sleep score and a body battery that recharged to 85—clear signals that my recovery […]
The Anatomy of a Good Ride; Physiology, Recovery, and the Portola Block

The Anatomy of a Good Ride: Physiology, Recovery, and the Portola Block I’ve always said that success on the bike isn’t a roll of the dice; it’s a deliberate convergence of external work and internal readiness. This week, I conducted a deep cycling physiology analysis of the Portola block to prove how disciplined recovery yields […]
Why Your “Free” Garmin Metrics are More Accurate Than You Realize
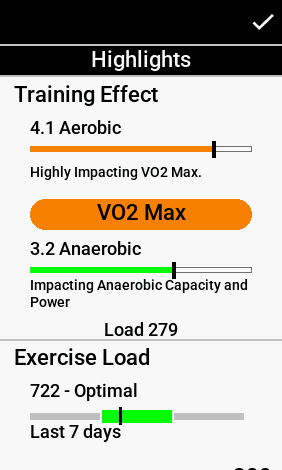
Why Your “Free” Garmin Metrics are More Accurate Than You Realize When athletes ask about Garmin VO2 Max accuracy, they are usually skeptical about whether a consumer wearable can truly measure the high-octane reality of a 15-15 interval set. On paper, today’s session was a classic builder—two sets of 15-minute micro-intervals—but as a physiology-first coach, […]
Billat 30-30 Physiology: Using SmO2 and ThB to Identify True VO2max Stimulus
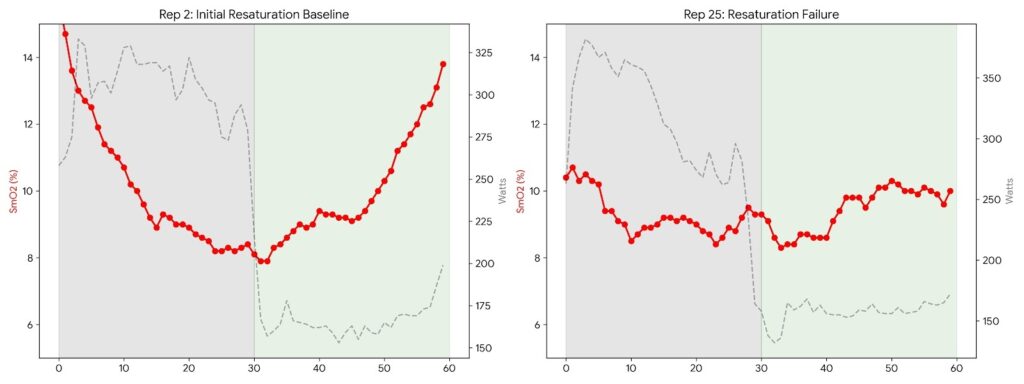
Billat 30-30 Physiology: Why Garmin Stamina Contradicts the SmO2 Test By Coach Wharton April 29, 2026 Billat 30-30 Physiology is a foundational concept in high-intensity training, typically involving 30 seconds of maximal aerobic power followed by 30 seconds of active recovery. The goal is simple on paper—spend as much time as possible at VO2max intensity. […]
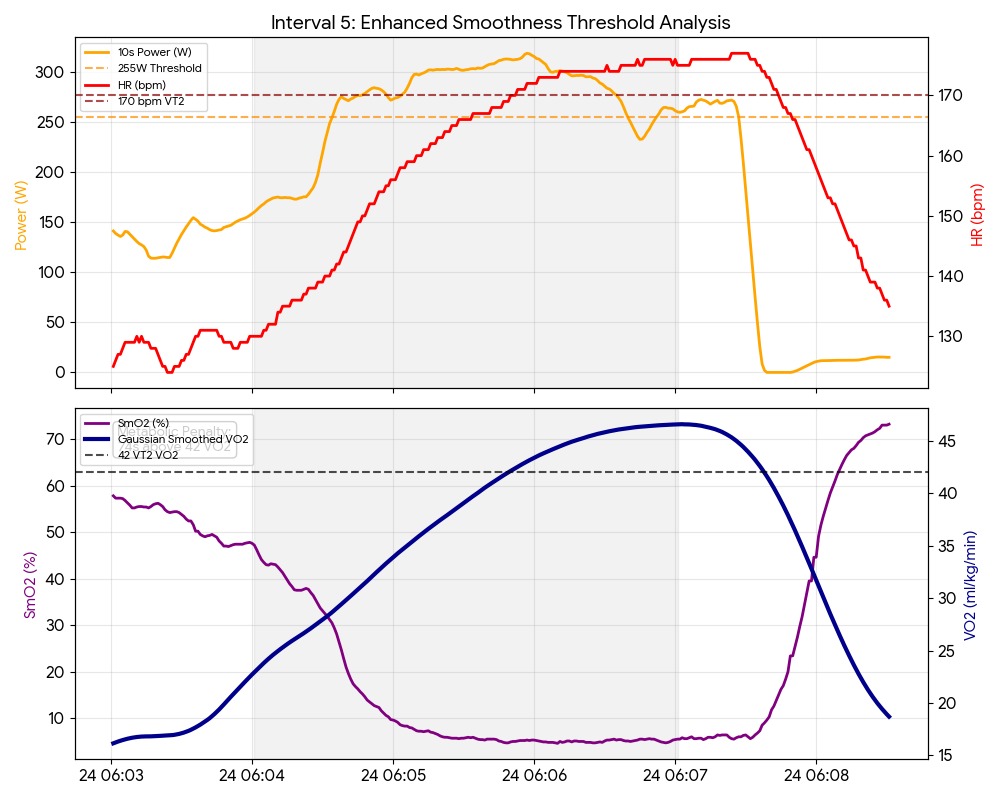
Garmin Guru Deep Dive: Decoding the Internal Response to 4-Minute VO2max Intervals
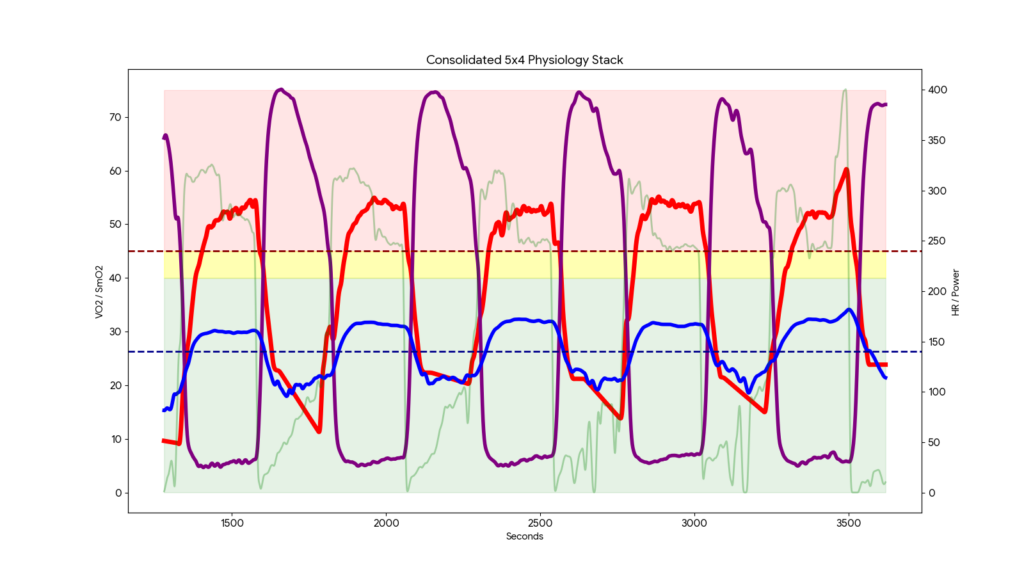
Garmin Guru Deep Dive: Decoding the Internal Response to 4-Minute VO2max Intervals Today’s session of 4-minute VO2max intervals was a masterclass in why I lead with physiology, not physics. As the Garmin Guru at Online Bike Coach, I’m constantly looking for the “truth” behind the numbers. Today, that truth was found in gas exchange and […]
Decoding the Flux: How the Reverse Fibonacci Protocol Re-Maps Your Threshold
Beyond the Score The Garmin Guru Series | Decoding the Fast-Adapter | By OnlineBikeCoach.com Programming Reverse Fibonacci intervals is the ultimate way to shatter the lie of the “Static Zone” in high-performance cycling. We move past the idea that a single FTP test or a heart rate formula from a 1980s textbook is […]
Predicting the Redline: Using Garmin Sleep Scores to Master Ronnestad 30-15 Intervals
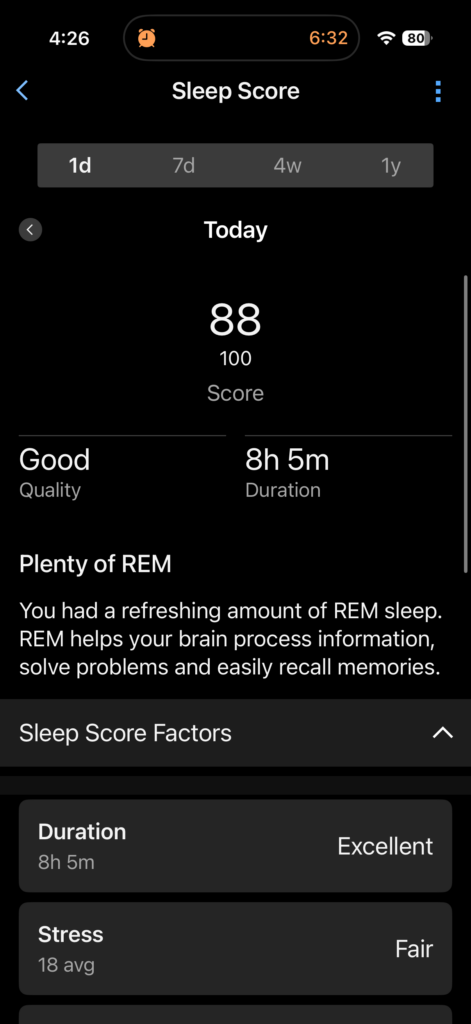
Physiology First: Using Garmin Sleep Scores to Predict Ronnestad 30-15 Success Part I: The Garmin Sleep Score Ronnestad Preflight We often treat training like a game of chance, but the reality is that your body provides a daily “weather report” if you know where to look. Before I even touched my bike this morning, I […]
Decoding the Hard-Start: How Ronnestad Intervals Impact Garmin Stamina & Training Effect
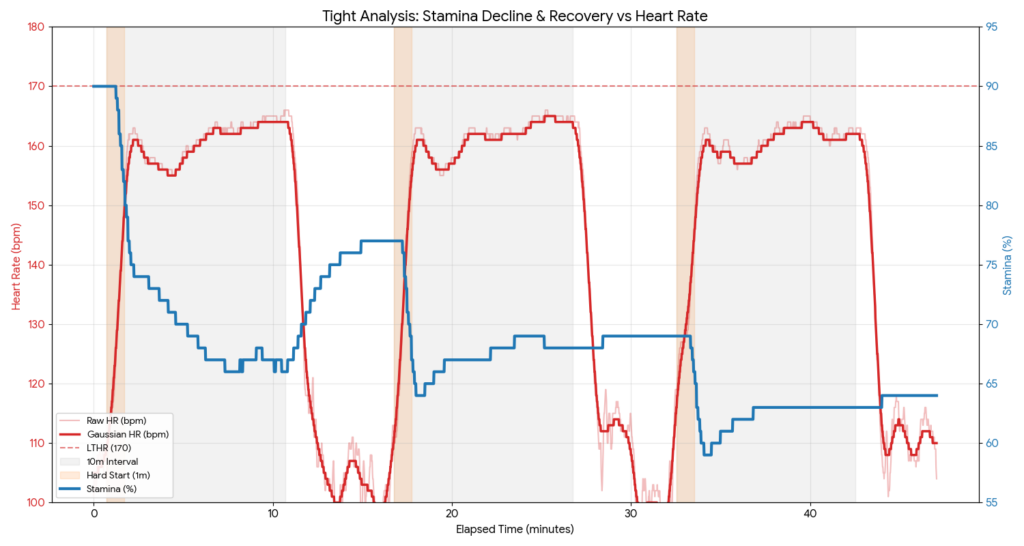
The “Hard-Start” Evolution: Pushing the Limits of the Rønnestad Protocol Testing the Ronnestad Hard-Start Intervals protocol this week provided a fascinating look at oxygen kinetics and internal load. Before this session, I attempted to link my VO2 Master to the phone for a full metabolic calibration. Despite several attempts, the mask simply wouldn’t handshake. Rather […]
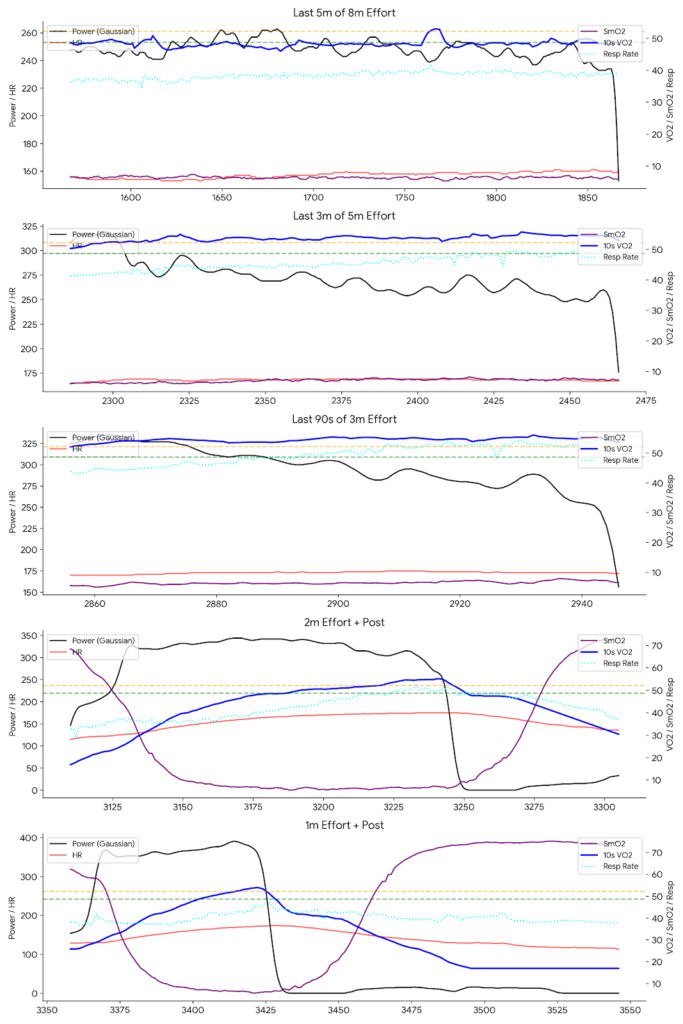
VO₂max Intervals: The Most Misunderstood Workout in Cycling—And How to Do Them “Right”
VO2Max State vs. Zone: What’s Happening Under the Hood https://youtube.com/shorts/gjB6seZEVec?feature=share I recently started using my VO₂Master again. In this session, I wanted to explore the VO2max state vs zone debate by looking at the actual physiological cost of high-intensity efforts. Earlier this week, I performed five separate 3-minute intervals at an intensity well above […]
W′, Critical Power, and the Physiology Behind High‑Intensity Training

Photo by Markus Spiske on Unsplash Table of Contents Outline Introduction: performance metrics meet physiology AMP, AMPK, and the signal that tells cells to adapt Critical power and W′: two quantities, one practical model Why W′ matters beyond being “just a number” W′ as a fatigue tank: a practical mental model Practical example: why 400 […]