
Tire Selection vs. Terrain: How Vittoria Rubber Saved 7.5% Effort on the Halo Loop
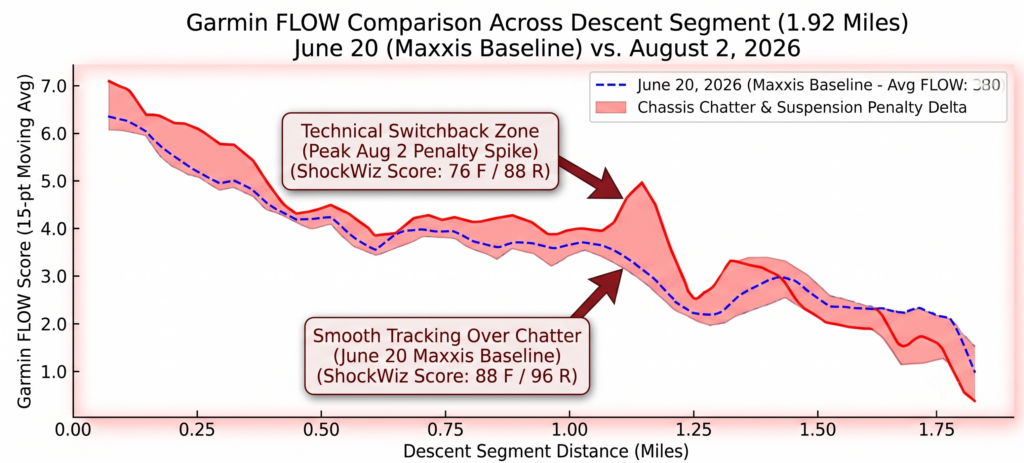
Tire Selection vs. Terrain: How Vittoria Rubber Saved 7.5% Effort on the Halo Loop By Richard Wharton | August 2, 2026 Proper tire selection on technical mountain bike trails plays a far greater role in overall efficiency than raw horsepower alone. If you ride strictly by feel, hot, dry summer dirt on Peavine Mountain’s benchmark […]
When “Easy” Power Isn’t Easy: A VO2 Master Data Deep Dive
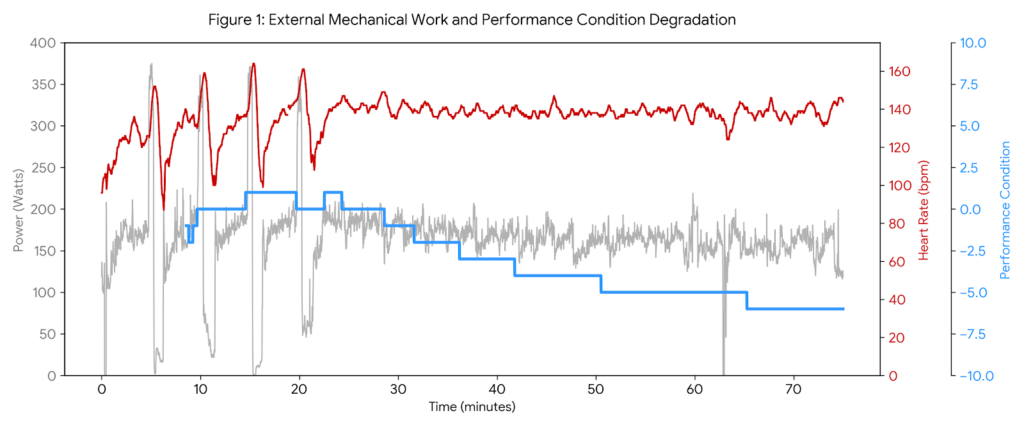
Analyzing VO2 Master data reveals a stark reality check from my ride this Friday morning. I expected a straightforward, low-intensity recovery base day. Instead, my body gave me a loud warning. Even though I intentionally kept my external intensity low, the internal cost of the ride was exceptionally high. This ride is a textbook example […]
Stop Ignoring Garmin Performance Condition: How to Use It as a Real-Time Health Governor
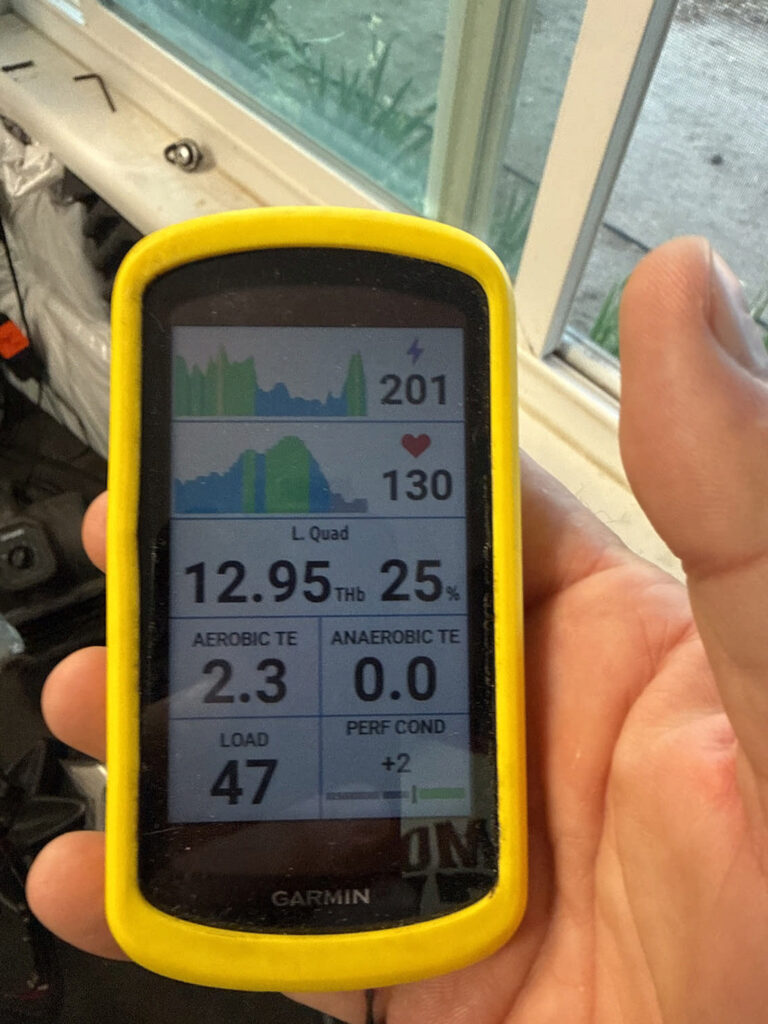
How I Used Performance Condition to Stay Healthy on Today’s Base Ride This morning’s ride wasn’t about speed or hero watts. It was about physiology, recovery, and learning how to leverage Garmin Performance Condition to protect my autonomic system. For the first time, I used this real-time metric as the primary governor for the entire […]
Cracking the Code: My Physiology First Tabata VO2 Max Deep Dive
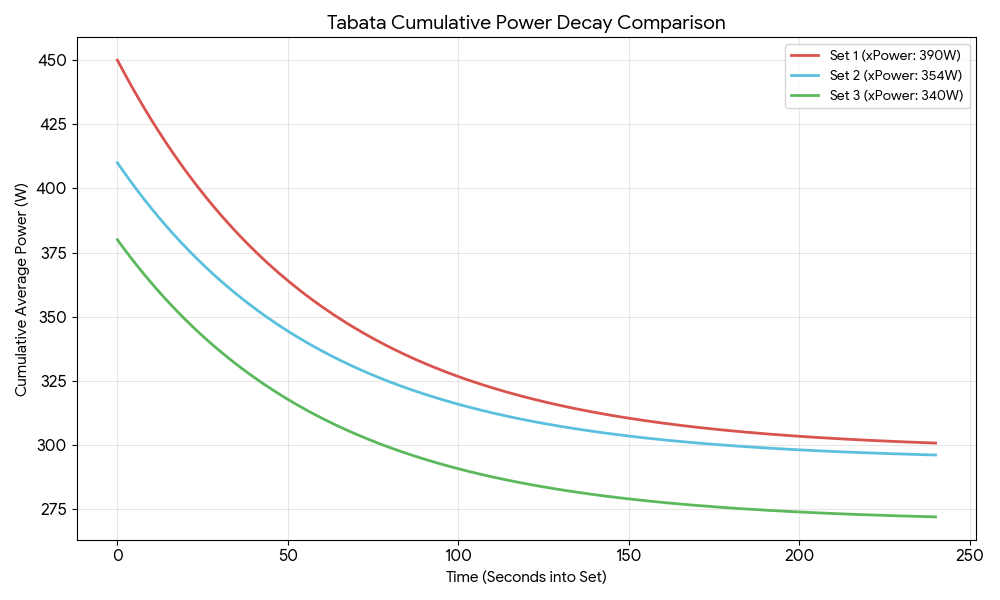
Cracking the Code: My Physiology and the Tabata Triple Threat Preface: The Metabolic Green Light vs. The CNS Red Light Before I even turned a pedal, the data was already telling a nuanced story. I woke up with a solid 83 sleep score and a body battery that recharged to 85—clear signals that my recovery […]
Stamina, Speed, Strength, and Skill – 4 Spokes With a Hub called “Consistency”.
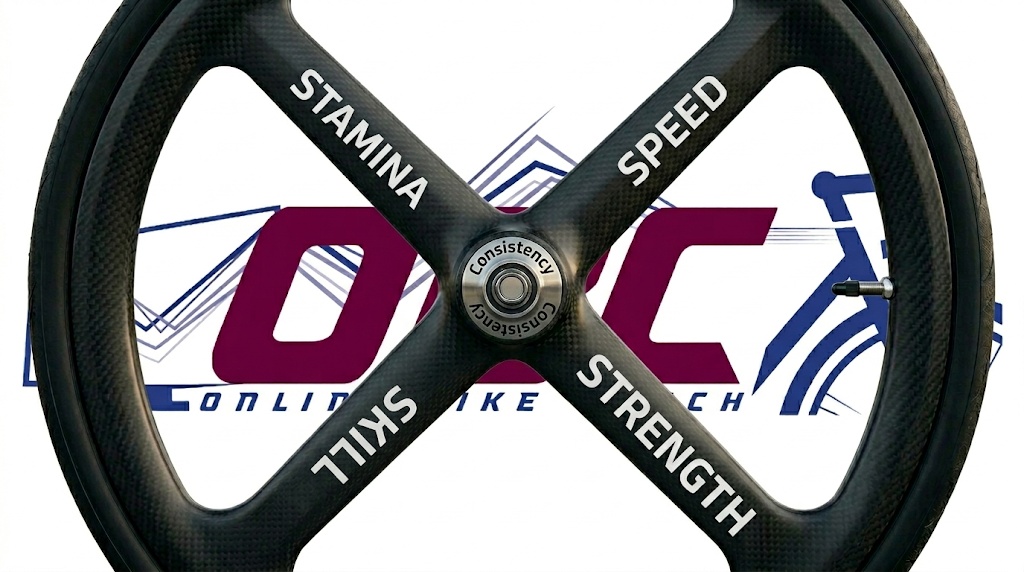
Cycling Stamina and Strength: The S4 Framework Building elite cycling stamina and strength is the foundation of the S4 performance framework used by high-performance athletes.In the world of professional cycling, we often get distracted by the latest gear or chasing the highest wattage. But at its core, your performance is a wheel supported by four […]
Why Your “Free” Garmin Metrics are More Accurate Than You Realize
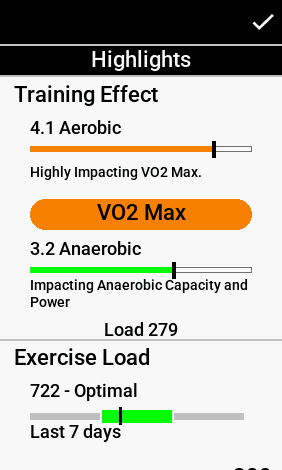
Why Your “Free” Garmin Metrics are More Accurate Than You Realize When athletes ask about Garmin VO2 Max accuracy, they are usually skeptical about whether a consumer wearable can truly measure the high-octane reality of a 15-15 interval set. On paper, today’s session was a classic builder—two sets of 15-minute micro-intervals—but as a physiology-first coach, […]
Billat 30-30 Physiology: Using SmO2 and ThB to Identify True VO2max Stimulus
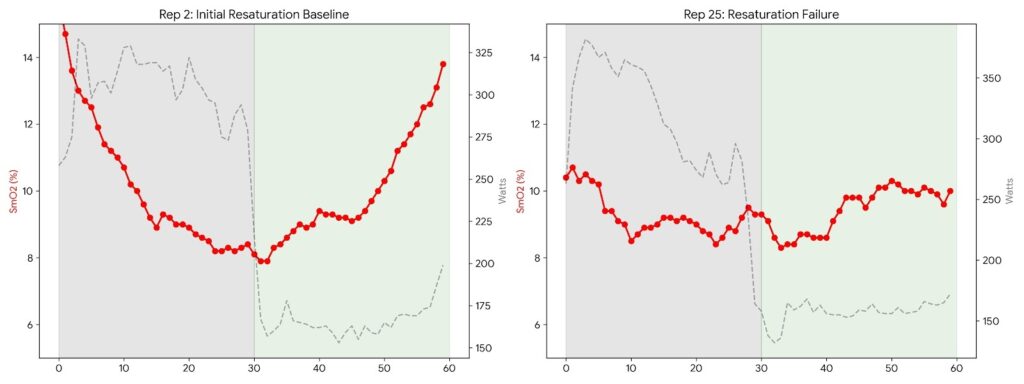
Billat 30-30 Physiology: Why Garmin Stamina Contradicts the SmO2 Test By Coach Wharton April 29, 2026 Billat 30-30 Physiology is a foundational concept in high-intensity training, typically involving 30 seconds of maximal aerobic power followed by 30 seconds of active recovery. The goal is simple on paper—spend as much time as possible at VO2max intensity. […]
The Garmin Ecosystem: Why Your Watch is More Important Than Your Power Meter
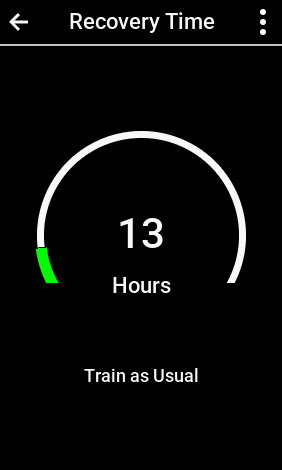
Garmin Recovery Time: Why Your Watch Beats Your Power Meter By The Garmin Guru | April 24, 2026 Understanding Garmin Recovery Time is essential for any athlete following a “Physiology First” approach. As a coach with over 20 years in the industry, I know that your bike computer is only half the story. To truly […]
Physiological Threshold Vs. FTP: The Power Illusion
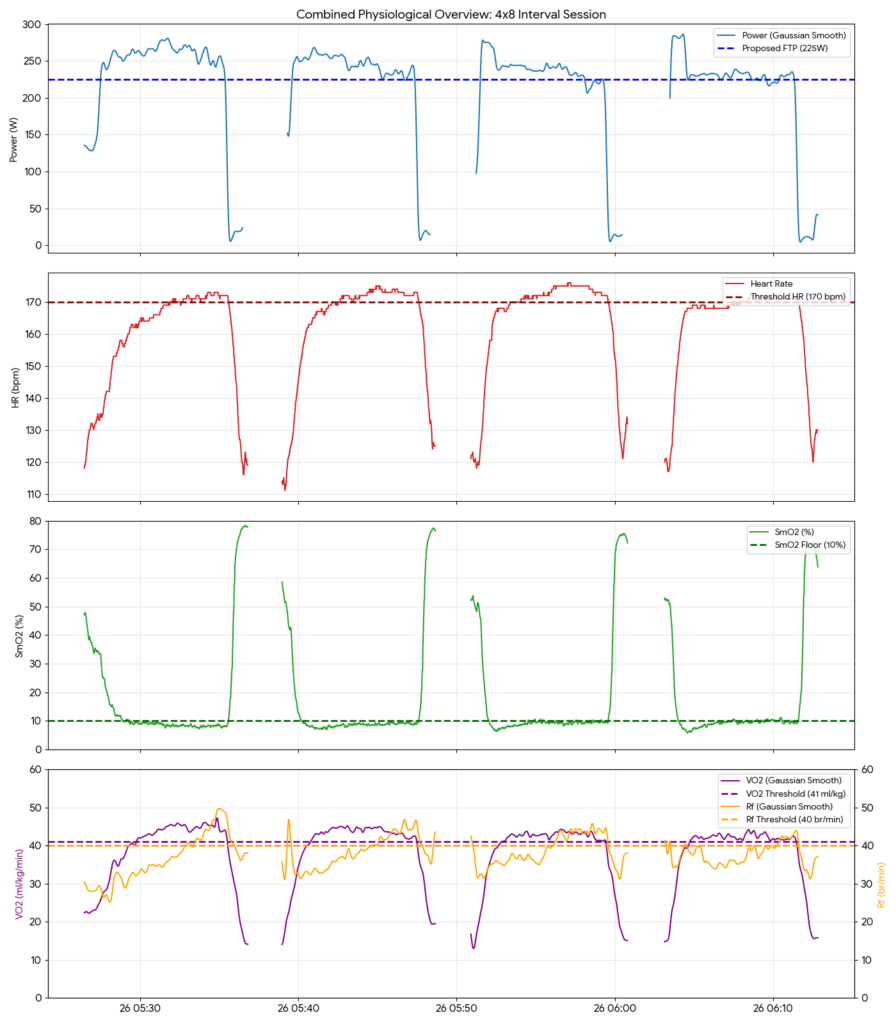
The Power Illusion: Resetting 20 Years of Training with Physiological Data After 20 years of cycling, I realized my FTP wasn’t telling the whole story of my actual physiological threshold. My identity as a cyclist was defined by a single, flickering number on a head unit: Watts. If you’ve spent any significant time in the […]
Altitude, Heat, and the Power Curve: Practical Physiology for Endurance Athletes
Elite performance is built on a careful balance between stress and recovery, biology and behavior. This article translates practical lessons from applied sports science into usable guidance for endurance athletes and coaches. It covers how simulated altitude works, why erythropoiesis is not as simple as “more red blood cells = better,” how heat affects different […]