
When “Easy” Power Isn’t Easy: A VO2 Master Data Deep Dive
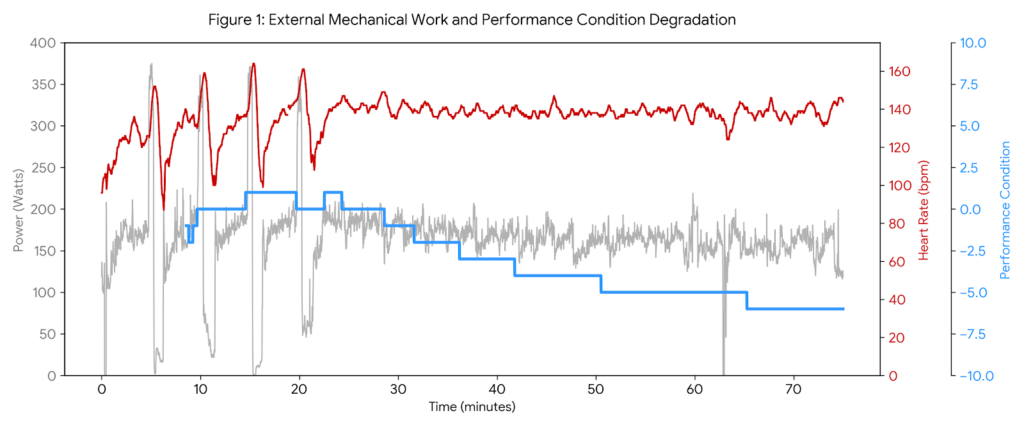
Analyzing VO2 Master data reveals a stark reality check from my ride this Friday morning. I expected a straightforward, low-intensity recovery base day. Instead, my body gave me a loud warning. Even though I intentionally kept my external intensity low, the internal cost of the ride was exceptionally high. This ride is a textbook example […]
Draining the Voltmeter: A 5 AM Lesson in Under-Fueling and Autonomic Collapse
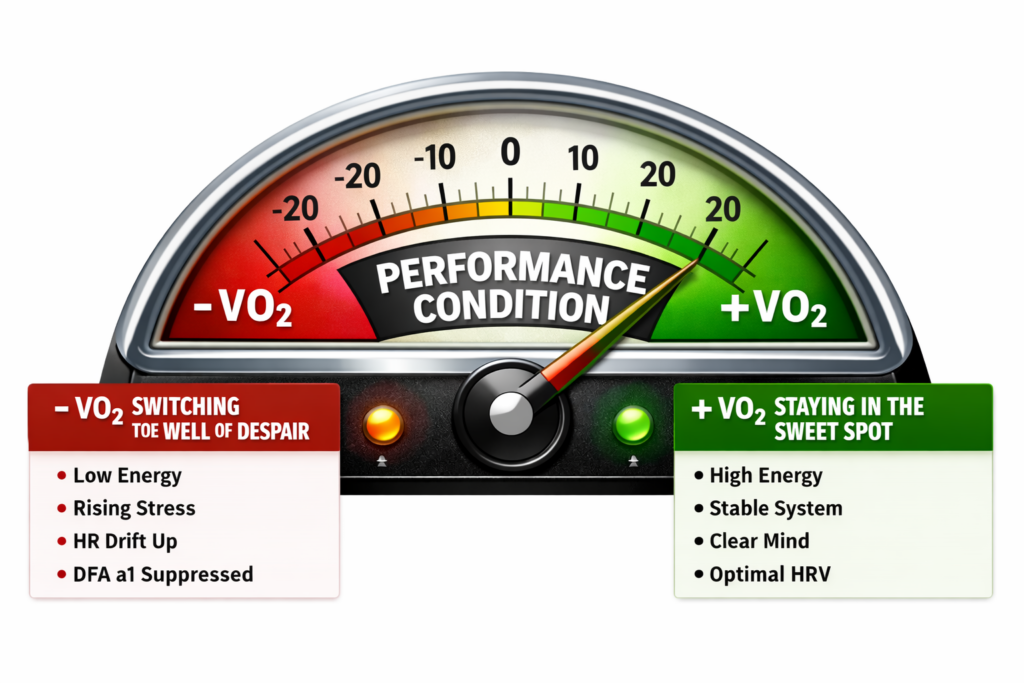
Forget Your Software’s Threshold: Your Physiology Rewrites the Rules in Real Time We’ve all been conditioned to treat our threshold like a monument carved in stone. Your bike computer, your smartwatch, or your coaching software gives you a single, static number—say, a functional threshold power (FTP) of 250W or a threshold heart rate of 162 […]
The Anatomy of a Good Ride; Physiology, Recovery, and the Portola Block
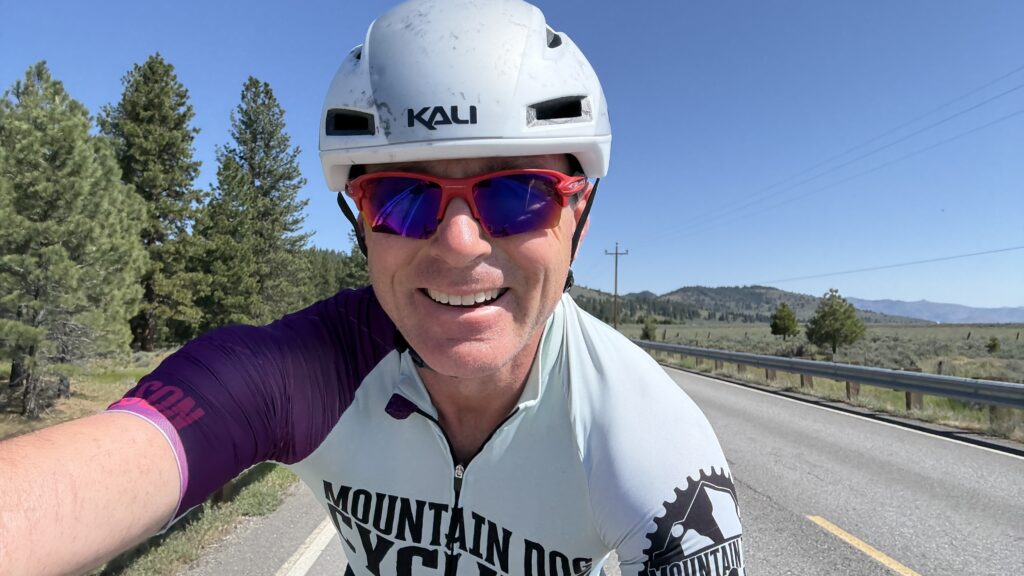
The Anatomy of a Good Ride: Physiology, Recovery, and the Portola Block I’ve always said that success on the bike isn’t a roll of the dice; it’s a deliberate convergence of external work and internal readiness. This week, I conducted a deep cycling physiology analysis of the Portola block to prove how disciplined recovery yields […]
Stamina, Speed, Strength, and Skill – 4 Spokes With a Hub called “Consistency”.
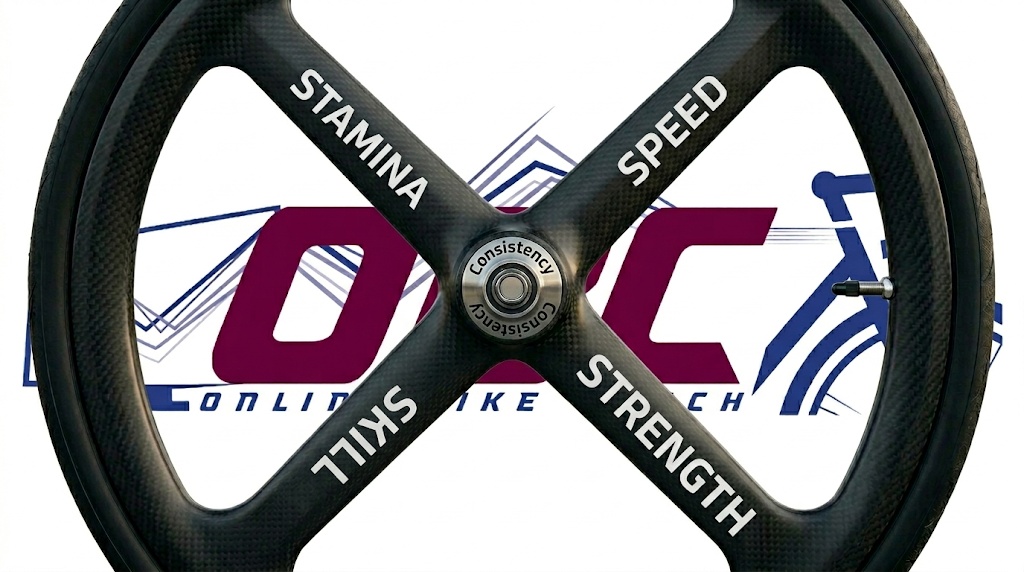
Cycling Stamina and Strength: The S4 Framework Building elite cycling stamina and strength is the foundation of the S4 performance framework used by high-performance athletes.In the world of professional cycling, we often get distracted by the latest gear or chasing the highest wattage. But at its core, your performance is a wheel supported by four […]
The Garmin Daily Double Dip: A Stamina and Potential Deep Dive
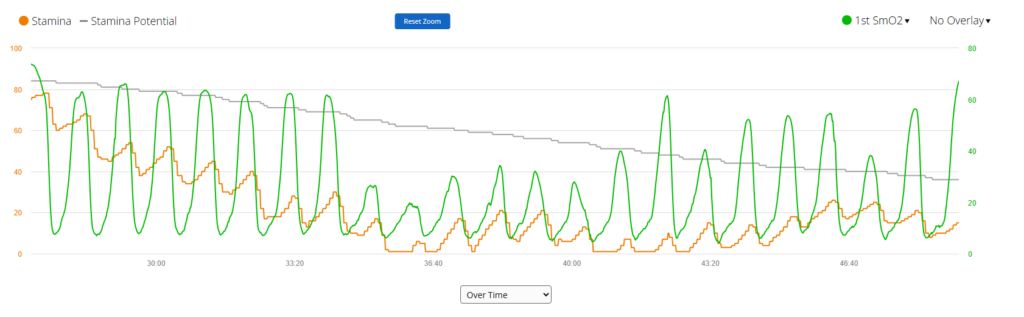
The Garmin Daily Double Dip: A Stamina and Potential Deep Dive Coach Wharton – May 7, 2026 Understanding Garmin Stamina metrics like Actual Stamina and Stamina Potential has fundamentally changed the way we analyze real-time capacity and athletic recovery. While Potential represents your total “fuel tank” for the entire ride, Actual Stamina reflects what you […]
Billat 30-30 Physiology: Using SmO2 and ThB to Identify True VO2max Stimulus
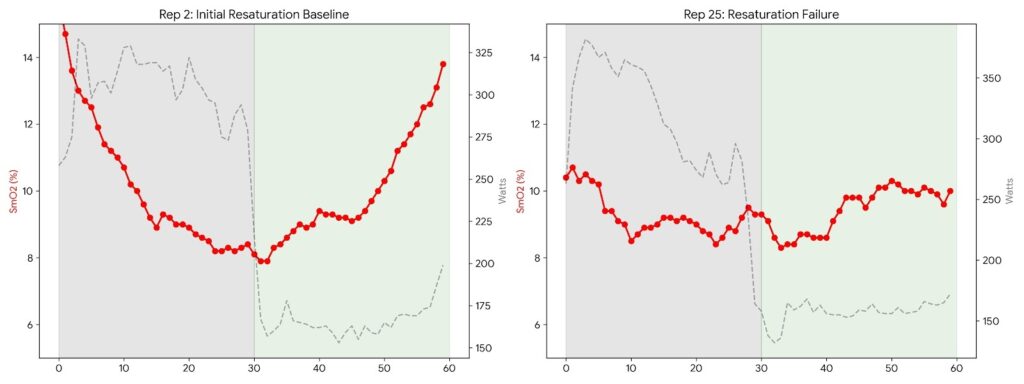
Billat 30-30 Physiology: Why Garmin Stamina Contradicts the SmO2 Test By Coach Wharton April 29, 2026 Billat 30-30 Physiology is a foundational concept in high-intensity training, typically involving 30 seconds of maximal aerobic power followed by 30 seconds of active recovery. The goal is simple on paper—spend as much time as possible at VO2max intensity. […]
Threshold or VO2 Max? Decoding My Highest 30-Minute Power with AlphaHRV and SmO2
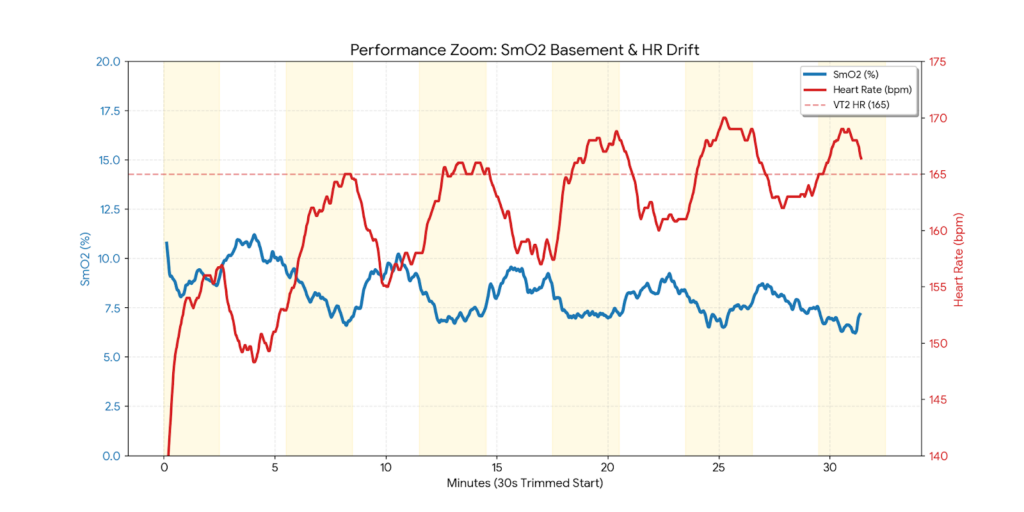
Training is rarely perfect, especially when I am wearing two hats at once. Today’s session was a 30-minute block of 3/3 Over-Unders—three minutes just above threshold wattage, followed by three minutes at 95% of FTP. I designed this session to challenge the metabolic limits of my oxidative system through focused SmO2 threshold training while staying […]
Physiology First: Navigating a “Red Light” Morning with AlphaHRV
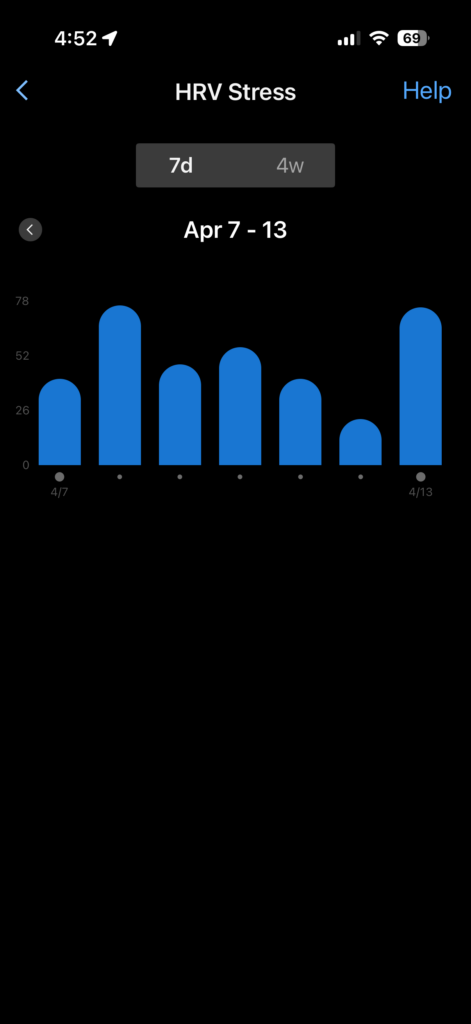
Physiology First: My Red Light Recovery Ride This morning was a masterclass in why I apply a Physiology First framework to every session, looking at the internal engine before I look at the wattage. Between a late meal and the devastating news about my friend Murray being struck by a motorist—suffering a serious […]
Decoding the Hard-Start: How Ronnestad Intervals Impact Garmin Stamina & Training Effect
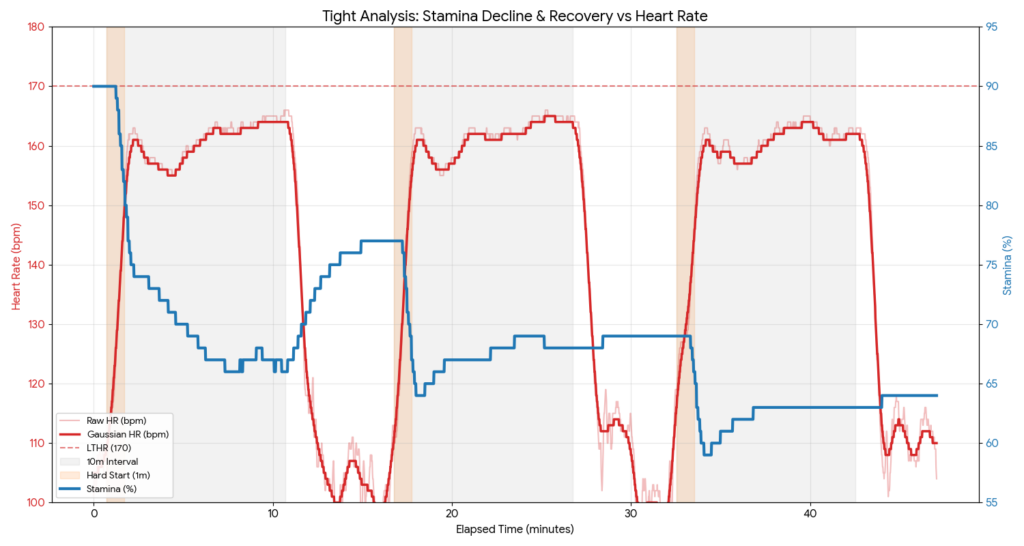
The “Hard-Start” Evolution: Pushing the Limits of the Rønnestad Protocol Testing the Ronnestad Hard-Start Intervals protocol this week provided a fascinating look at oxygen kinetics and internal load. Before this session, I attempted to link my VO2 Master to the phone for a full metabolic calibration. Despite several attempts, the mask simply wouldn’t handshake. Rather […]
Living in the Parabolas: My Deep Dive into the “VO2 State”
Living in the Parabolas: Decoding Metabolic Inertia and the Billat 90/90 In our last deep dive, we dissected the steady-state grind of 5×3 and 4×8 intervals. Those workouts are the bread and butter of threshold development. However, today we are stepping into the “red zone” to explore Veronique Billat’s 90/90 Metabolic Inertia. Using the combined […]