
Mastering Garmin Performance Condition: Decoding Autonomic Stability and Aerobic Coherence Through Strategic Hydration
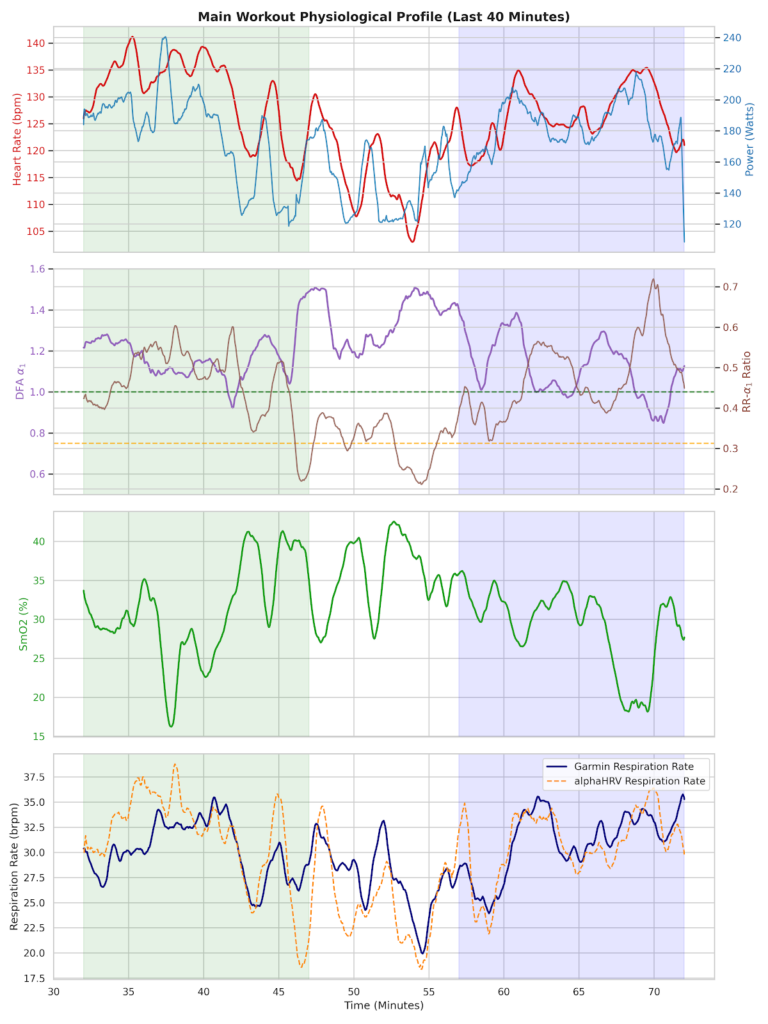
Mastering Garmin Performance Condition: Decoding Autonomic Stability and Aerobic Coherence Through Strategic Hydration For any cyclist serious about internal metabolic load, optimizing your training relies heavily on advanced metrics like Garmin Performance Condition tracking. Far more than a transient number that pops up ten minutes into your ride, it serves as a real-time metabolic voltmeter. […]
Real-Time Decompensation: Decoupling and the Anatomy of My Failed Workout
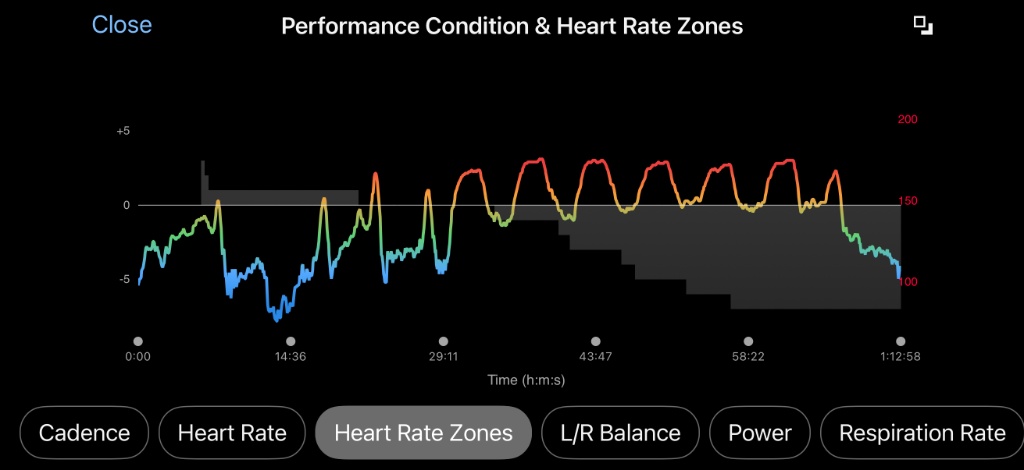
Every endurance athlete knows the feeling of hitting a wall, but few can see it coming down the track with mathematical precision, which is why monitoring your Garmin Performance Condition is so vital during hard blocks. Yesterday, I set out to complete a critical high-intensity maintenance block: 7×3-minute VO2max intervals targeting north of 270 watts. […]
The Power Illusion: Why Your Suspension Setup and HRV Dictate Real Speed
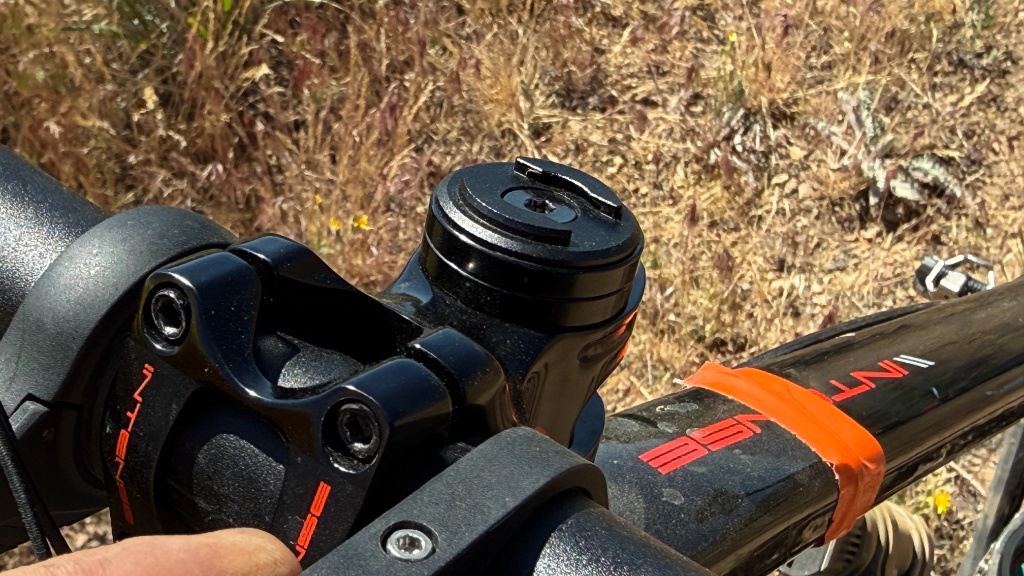
Chasing Ghosts on Peavine: The Ecology of Speed By Coach Richard Wharton • May 27, 2026 Heading out from the Peavine Mountain Hoge Road Trailhead to collect raw biometric and suspension telemetry across the Halo Loop. Part 1: Physiology-First Cycling Training, the Weight, and the Climb Metrics It has been months since I last pointed […]
The Autonomic Pivot: When Less Training Volume Equals Deeper Recovery
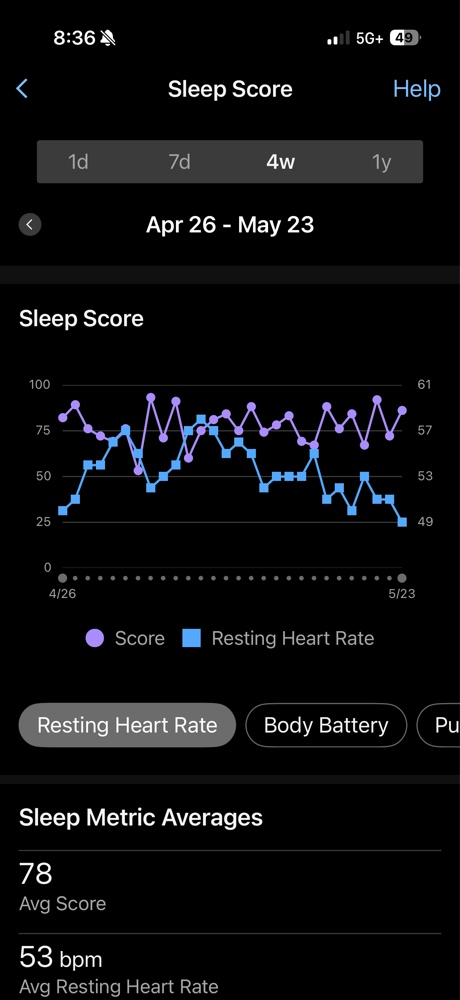
The Autonomic Pivot: When Less Training Volume Equals Deeper Recovery By Coach Richard Wharton, OBC | Published: May 25, 2026 Tracking my **Garmin HRV Stress** over the last few months has revealed a fascinating tug-of-war within my autonomic nervous system. Specifically, it shows exactly how shifting training workloads register on the body. Looking back at […]
Life Stress is Training Stress: Navigating the 52-Hour Recovery Debt
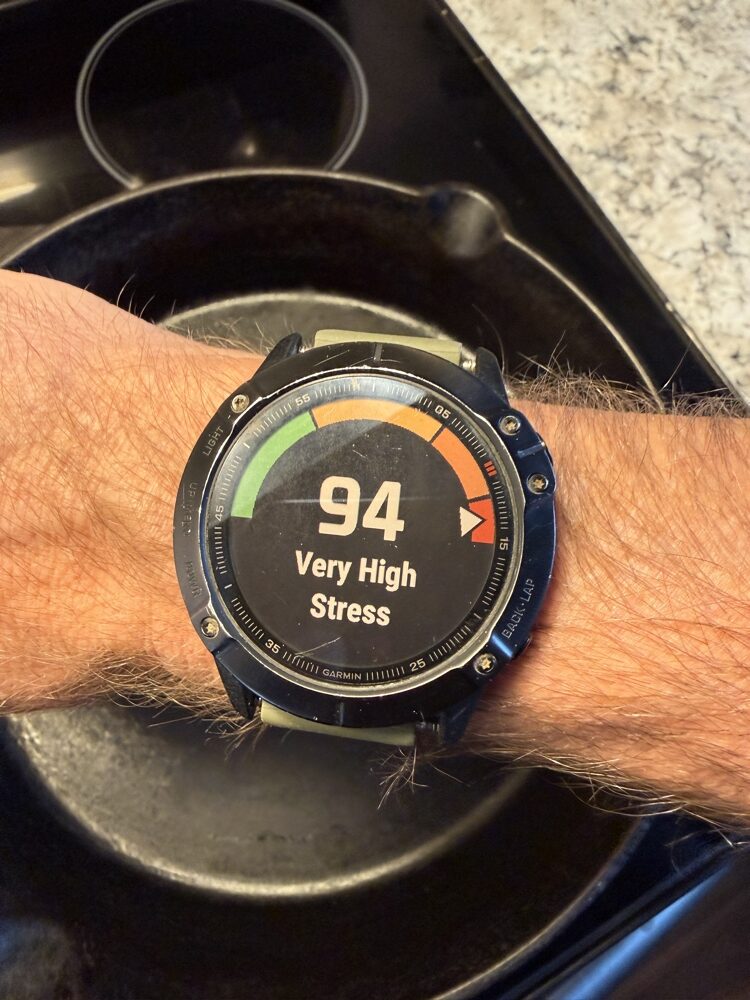
Garmin Recovery Metrics: When “Life Stress” Becomes a Physiological Debt Coach Richard Wharton Published: May 11, 2026 Understanding your Garmin recovery metrics is the only way to stay objective when non-training stress starts to bleed into your performance. Following our May 5th deep-dive into what those orange bars actually mean during sleep, today I’m showing […]
The Half-Glass Difference: How Alcohol Sabotages Your Garmin Recovery

When analyzing Garmin sleep recovery, alcohol is often the “X-factor” that derails even the most disciplined athlete. We’ve all heard it before: “It was just a couple of glasses of wine.” But as a coach who lives by the mantra Physiology is King, I’m less interested in what the menu says and more interested in […]
98% Charged: The +61 Garmin Body Battery Bounce Back
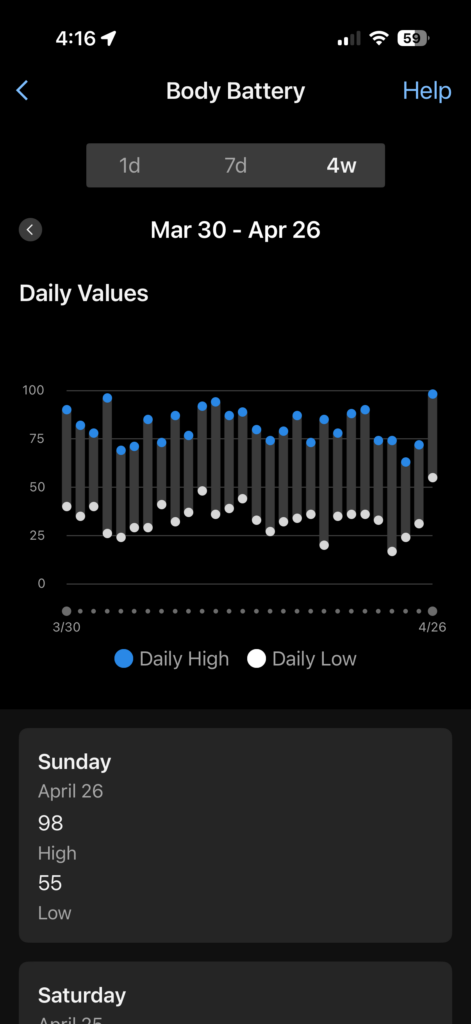
The Great Recharge: How I Pushed My Garmin Body Battery Back to 98 By Richard Wharton Achieving a massive Garmin Body Battery recharge is the ultimate goal after the physical toll of outdoor labor drains you to zero. Following up on my last post, I wanted to share the physiological “bounce back” results that took […]
Garmin Guru Deep Dive: Decoding the Internal Response to 4-Minute VO2max Intervals
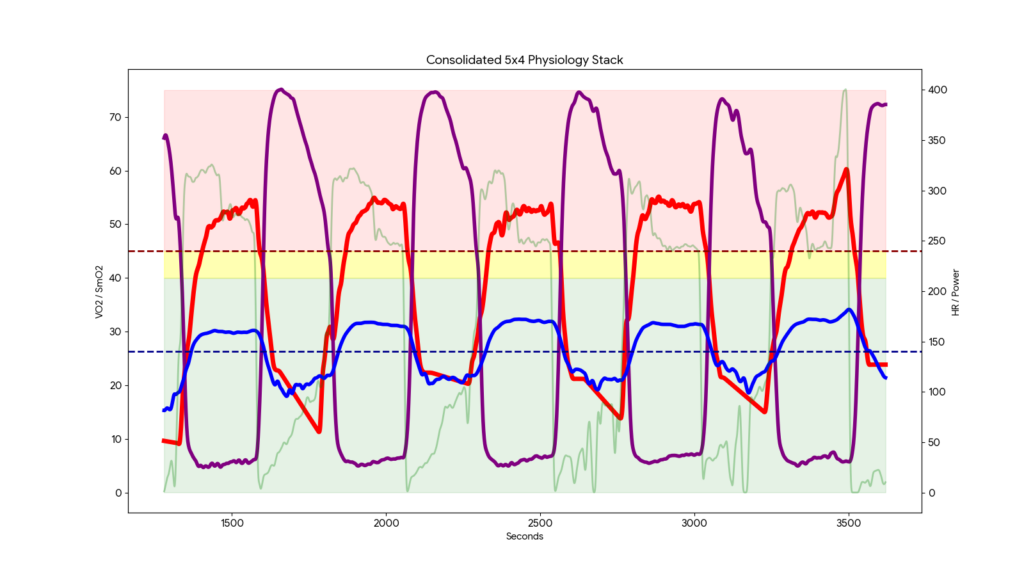
Garmin Guru Deep Dive: Decoding the Internal Response to 4-Minute VO2max Intervals Today’s session of 4-minute VO2max intervals was a masterclass in why I lead with physiology, not physics. As the Garmin Guru at Online Bike Coach, I’m constantly looking for the “truth” behind the numbers. Today, that truth was found in gas exchange and […]
The Happy Heart: Decoding My Garmin Sleep-Time Stress
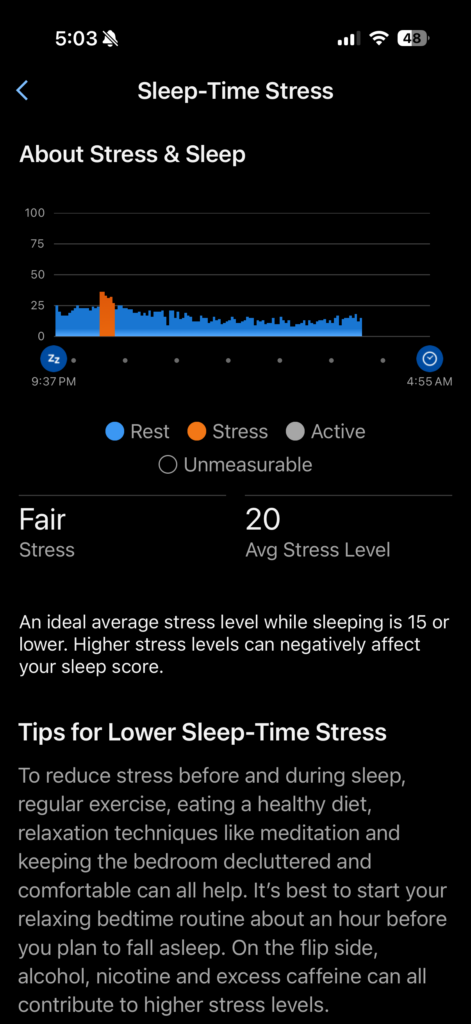
Tracking my sleep isn’t just about how long I was “out”; it’s about what my Autonomic Nervous System (ANS) was doing while the lights were off. As a coach who preaches Physiology First, the Garmin Sleep-Time Stress metric is one of the most honest looks into my recovery. Let’s break down the data from my […]
Sleep Score HRV Stress: The Yin and Yang of Recovery
The Yin and Yang of Recovery Physiology First Training | By Coach Richard Wharton Managing your Sleep Score HRV Stress data is the ultimate balancing act for any serious athlete. I’ve spent the last 48 hours in the “pain cave” building a trailer, manhandling heavy steel. When I pulled my metrics this morning, I saw […]