
Cracking the Code: My Physiology First Tabata VO2 Max Deep Dive
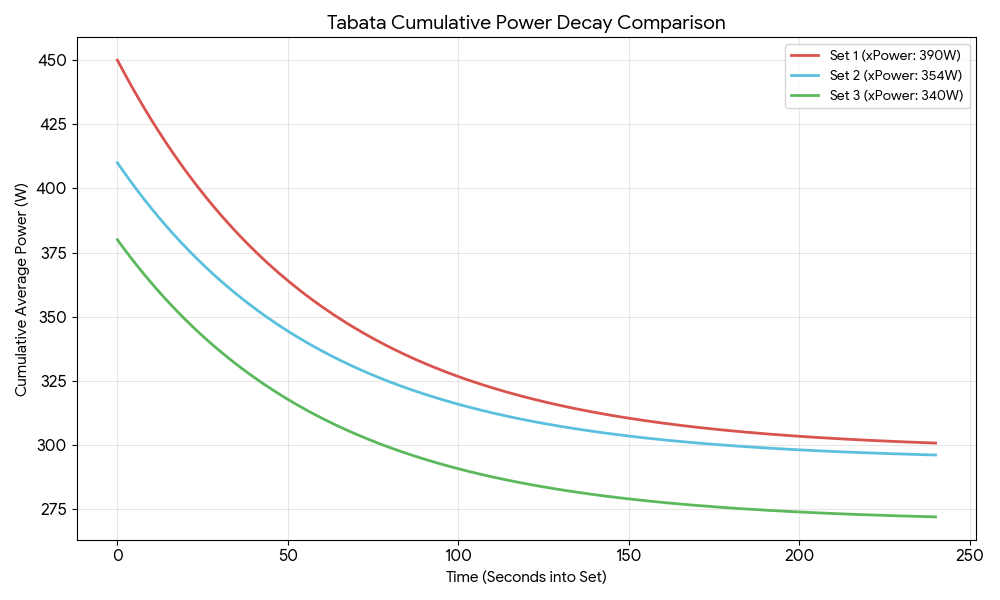
Cracking the Code: My Physiology and the Tabata Triple Threat Preface: The Metabolic Green Light vs. The CNS Red Light Before I even turned a pedal, the data was already telling a nuanced story. I woke up with a solid 83 sleep score and a body battery that recharged to 85—clear signals that my recovery […]
The Anatomy of a Good Ride; Physiology, Recovery, and the Portola Block
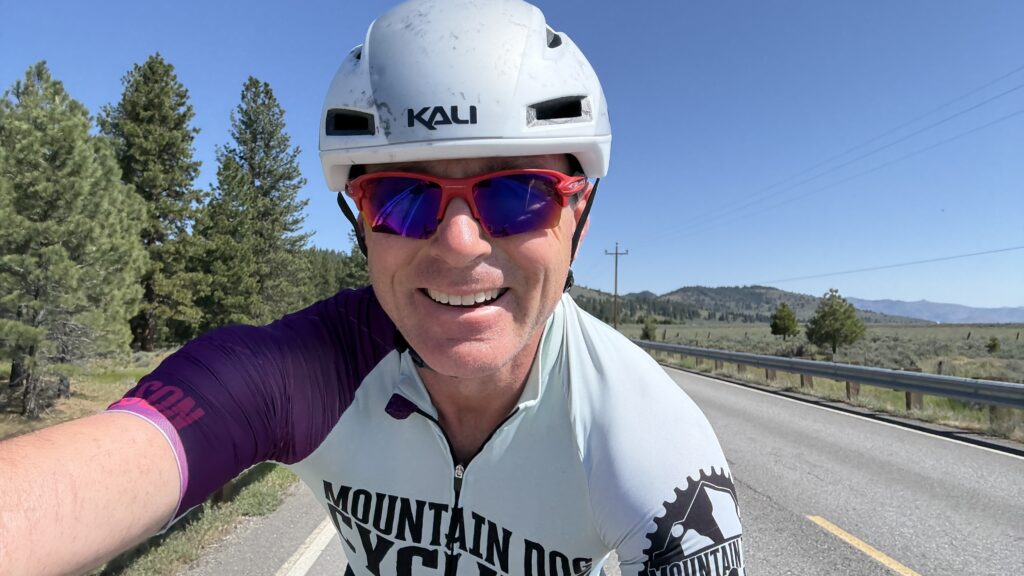
The Anatomy of a Good Ride: Physiology, Recovery, and the Portola Block I’ve always said that success on the bike isn’t a roll of the dice; it’s a deliberate convergence of external work and internal readiness. This week, I conducted a deep cycling physiology analysis of the Portola block to prove how disciplined recovery yields […]
Stamina, Speed, Strength, and Skill – 4 Spokes With a Hub called “Consistency”.
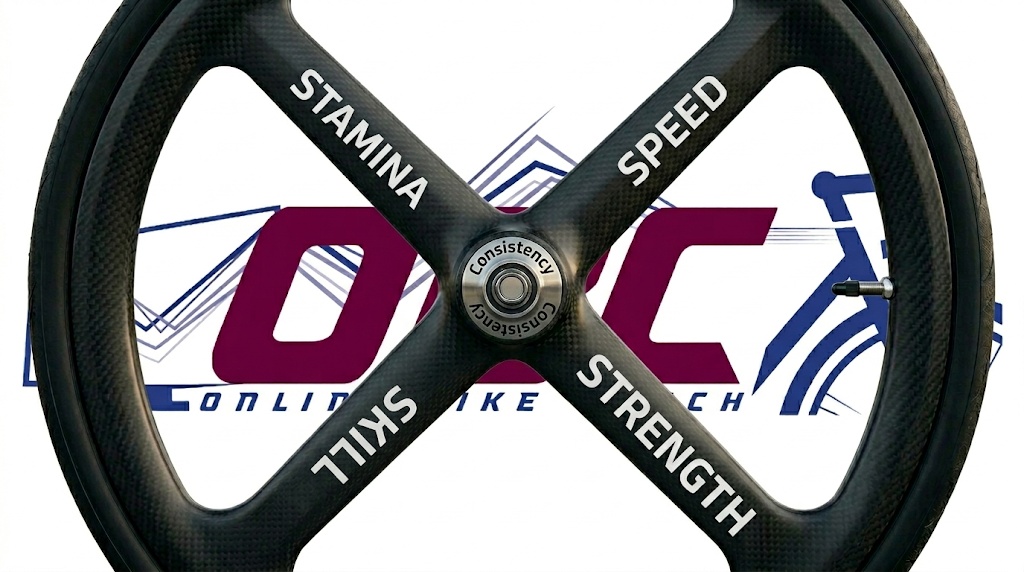
Cycling Stamina and Strength: The S4 Framework Building elite cycling stamina and strength is the foundation of the S4 performance framework used by high-performance athletes.In the world of professional cycling, we often get distracted by the latest gear or chasing the highest wattage. But at its core, your performance is a wheel supported by four […]
The Half-Glass Difference: How Alcohol Sabotages Your Garmin Recovery
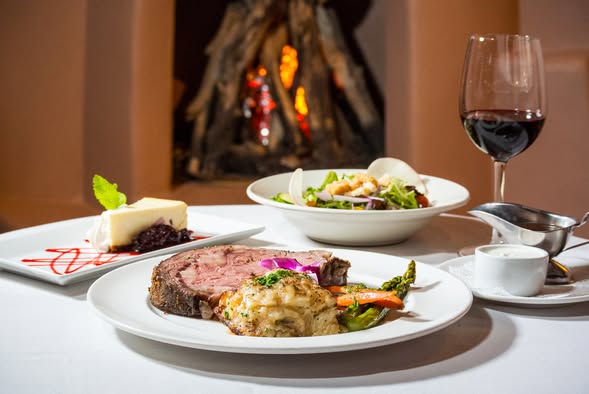
When analyzing Garmin sleep recovery, alcohol is often the “X-factor” that derails even the most disciplined athlete. We’ve all heard it before: “It was just a couple of glasses of wine.” But as a coach who lives by the mantra Physiology is King, I’m less interested in what the menu says and more interested in […]
Understanding Garmin Sleep Stress: What Those Orange Bars Actually Mean
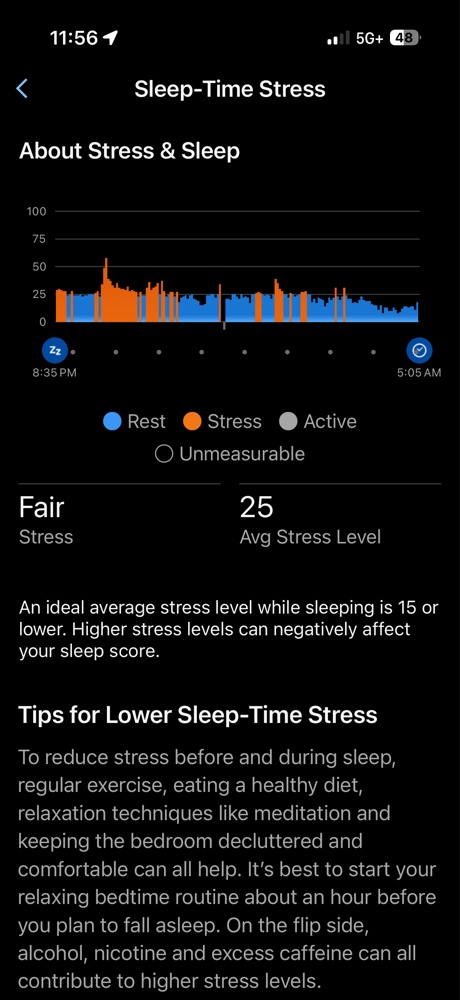
Garmin Sleep Stress: What Those Orange Bars Actually Mean As a cycling coach, I’m constantly preaching the “Physiology First” gospel: listen to the engine, not just the dashboard. But lately, I’ve been my own most difficult athlete. I’ve been analyzing my Garmin Sleep Stress while deep in the trenches of “outdoor mania” labor. While the […]
Garmin Guru Deep Dive: Decoding the Internal Response to 4-Minute VO2max Intervals
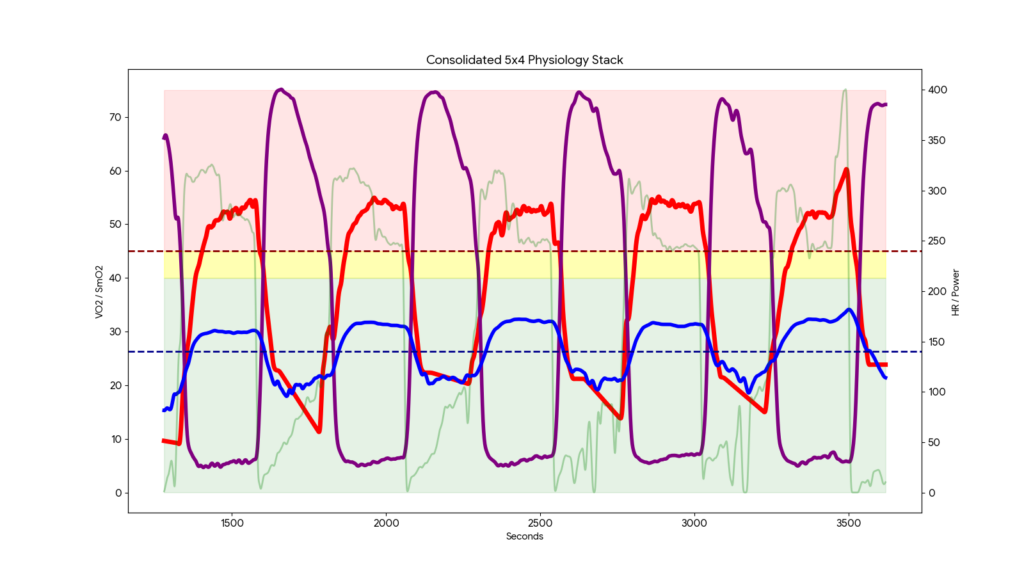
Garmin Guru Deep Dive: Decoding the Internal Response to 4-Minute VO2max Intervals Today’s session of 4-minute VO2max intervals was a masterclass in why I lead with physiology, not physics. As the Garmin Guru at Online Bike Coach, I’m constantly looking for the “truth” behind the numbers. Today, that truth was found in gas exchange and […]
Sleep Score HRV Stress: The Yin and Yang of Recovery
The Yin and Yang of Recovery Physiology First Training | By Coach Richard Wharton Managing your Sleep Score HRV Stress data is the ultimate balancing act for any serious athlete. I’ve spent the last 48 hours in the “pain cave” building a trailer, manhandling heavy steel. When I pulled my metrics this morning, I saw […]
Garmin Stamina VO2 Threshold: Mapping the Fatigue Trigger
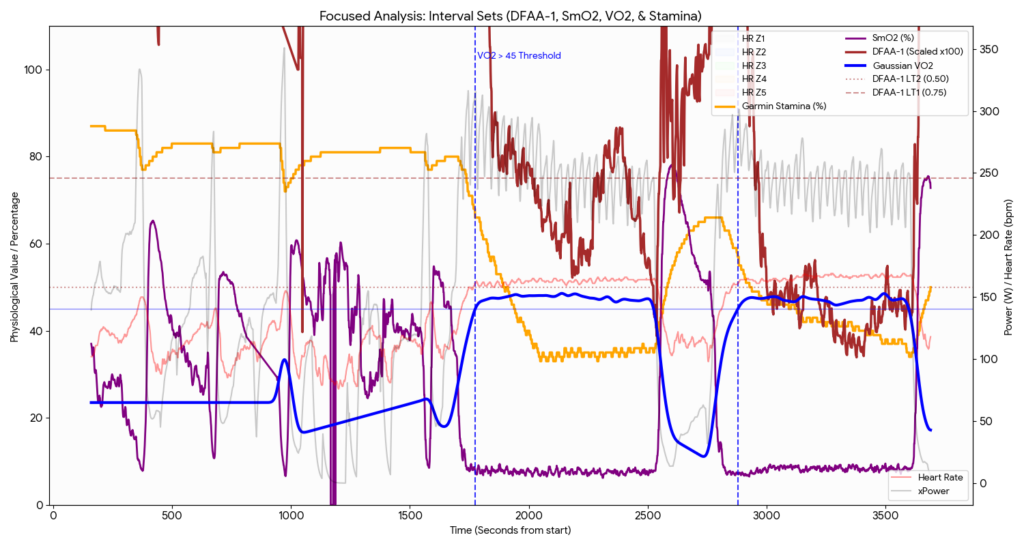
Garmin Stamina VO2 Threshold: Mapping the Fatigue Trigger In my ongoing pursuit of the “Physiology First” training approach at Onlinebikecoach.com, I have used the Garmin Stamina VO2 Threshold to map exactly where my internal stability ends and metabolic exhaustion begins. To build a more resilient aerobic engine, I need to know my limits. With my […]