
Using the Garmin Power Guide: Lake Tahoe Review
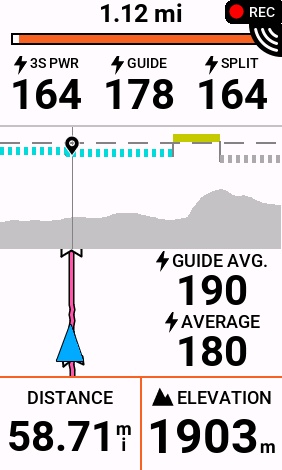
Breaking 4 Hours Around Lake Tahoe: A Deep Dive Into Garmin Connect Power Guide, Physics vs. Physiology, and the 285-Watt Threshold Mistake By Richard Wharton Using the Garmin Connect Power Guide to pace an endurance ride around Lake Tahoe offers a fascinating study in cycling analytics. Indeed, this loop is one of the premier endurance […]
Physiology First Cycling Coaching: How Masters Athletes Over 65 Master High-Intensity Training in the VQ Velocity Studio
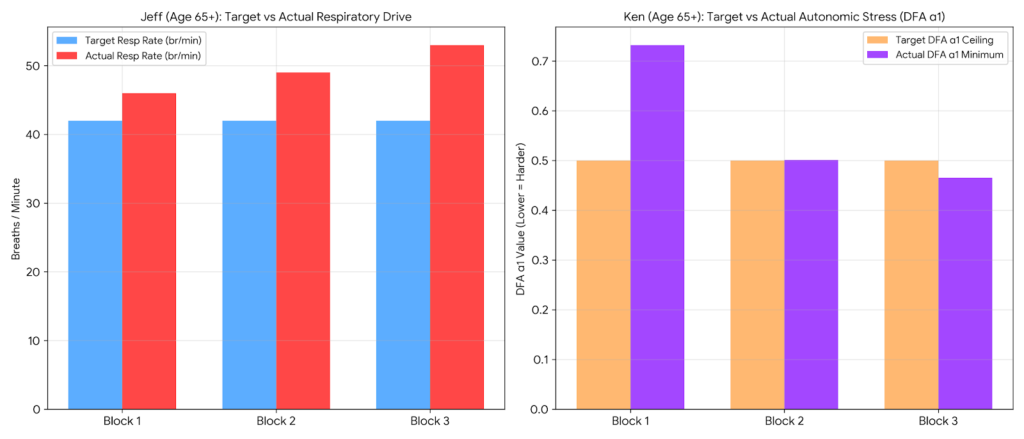
Age is Just a Number: How Two Masters Athletes Over 65 Master ‘Physiology First’ in the VQ Velocity Virtual Studio There is a pervasive myth in cycling that once an athlete crosses age 65, high-intensity training becomes too risky or unproductive. The popular narrative suggests older cyclists should stick strictly to low-intensity cruising. However, by […]
Tire Selection vs. Terrain: How Vittoria Rubber Saved 7.5% Effort on the Halo Loop
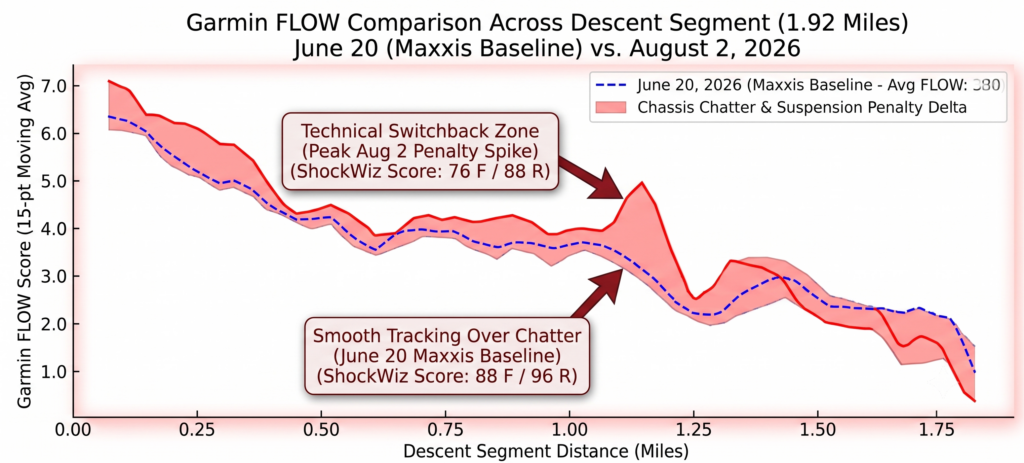
Tire Selection vs. Terrain: How Vittoria Rubber Saved 7.5% Effort on the Halo Loop By Richard Wharton | August 2, 2026 Proper tire selection on technical mountain bike trails plays a far greater role in overall efficiency than raw horsepower alone. If you ride strictly by feel, hot, dry summer dirt on Peavine Mountain’s benchmark […]
When “Easy” Power Isn’t Easy: A VO2 Master Data Deep Dive
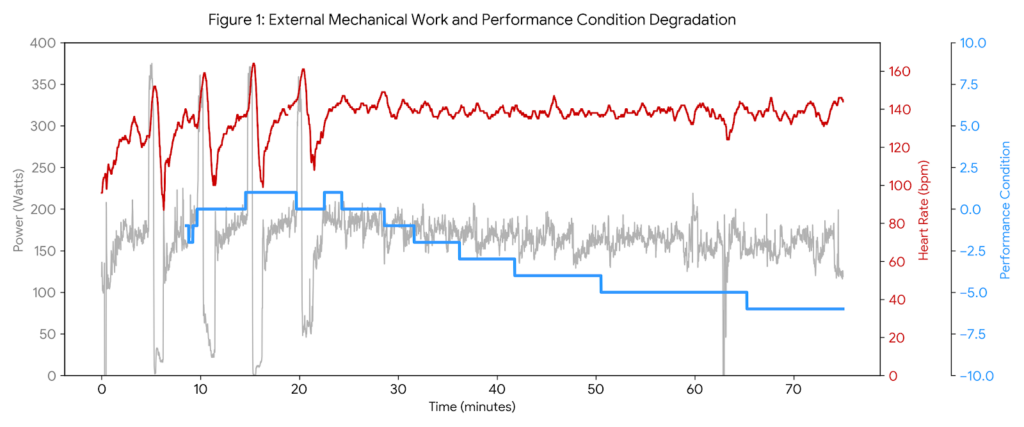
Analyzing VO2 Master data reveals a stark reality check from my ride this Friday morning. I expected a straightforward, low-intensity recovery base day. Instead, my body gave me a loud warning. Even though I intentionally kept my external intensity low, the internal cost of the ride was exceptionally high. This ride is a textbook example […]
Stop Ignoring Garmin Performance Condition: How to Use It as a Real-Time Health Governor
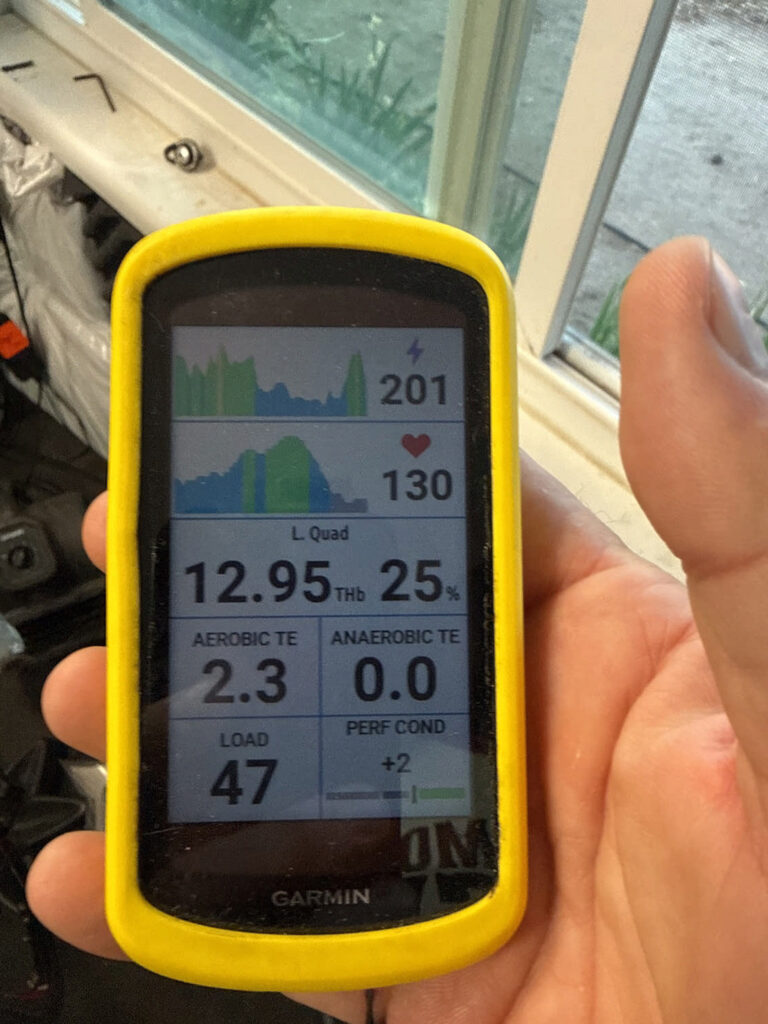
How I Used Performance Condition to Stay Healthy on Today’s Base Ride This morning’s ride wasn’t about speed or hero watts. It was about physiology, recovery, and learning how to leverage Garmin Performance Condition to protect my autonomic system. For the first time, I used this real-time metric as the primary governor for the entire […]
Real-Time Decompensation: Decoupling and the Anatomy of My Failed Workout
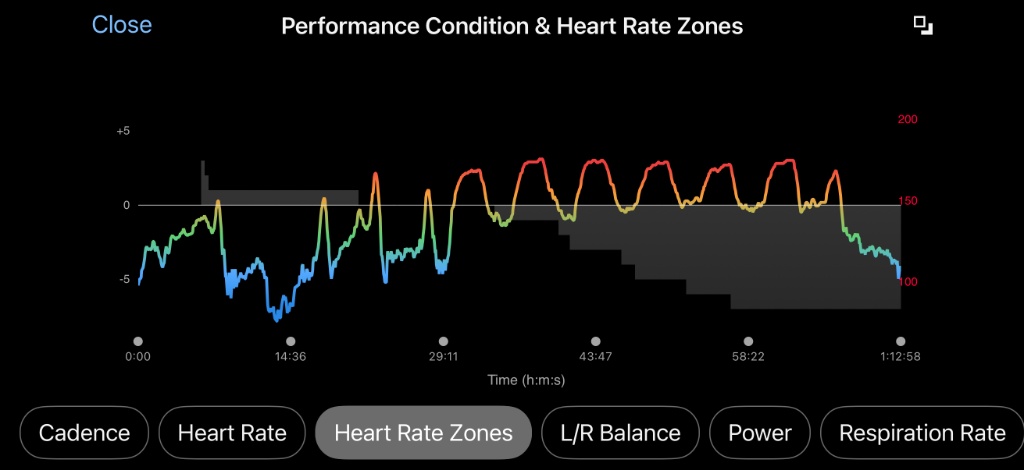
Every endurance athlete knows the feeling of hitting a wall, but few can see it coming down the track with mathematical precision, which is why monitoring your Garmin Performance Condition is so vital during hard blocks. Yesterday, I set out to complete a critical high-intensity maintenance block: 7×3-minute VO2max intervals targeting north of 270 watts. […]
Stamina, Speed, Strength, and Skill – 4 Spokes With a Hub called “Consistency”.
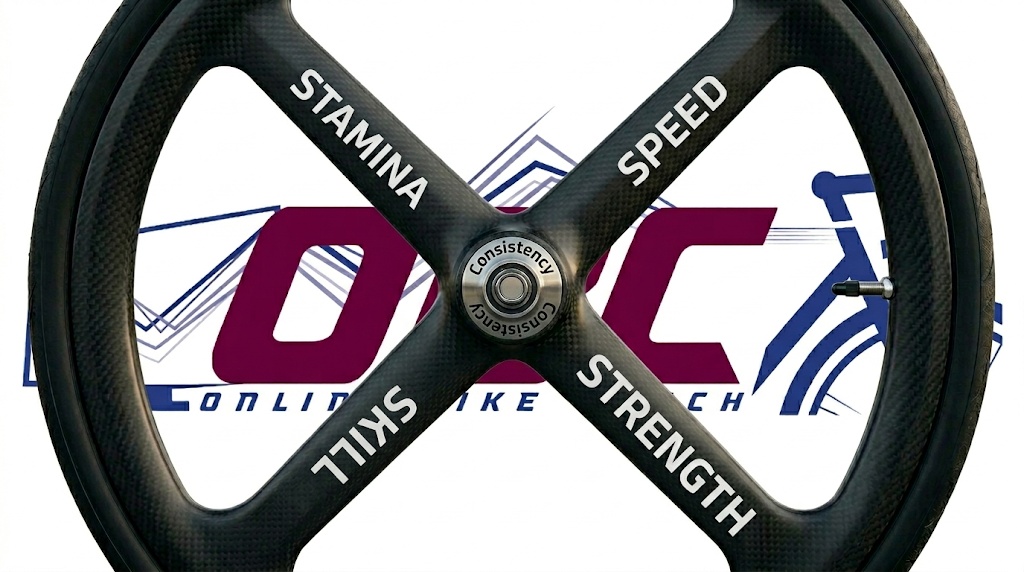
Cycling Stamina and Strength: The S4 Framework Building elite cycling stamina and strength is the foundation of the S4 performance framework used by high-performance athletes.In the world of professional cycling, we often get distracted by the latest gear or chasing the highest wattage. But at its core, your performance is a wheel supported by four […]
The Garmin Daily Double Dip: A Stamina and Potential Deep Dive
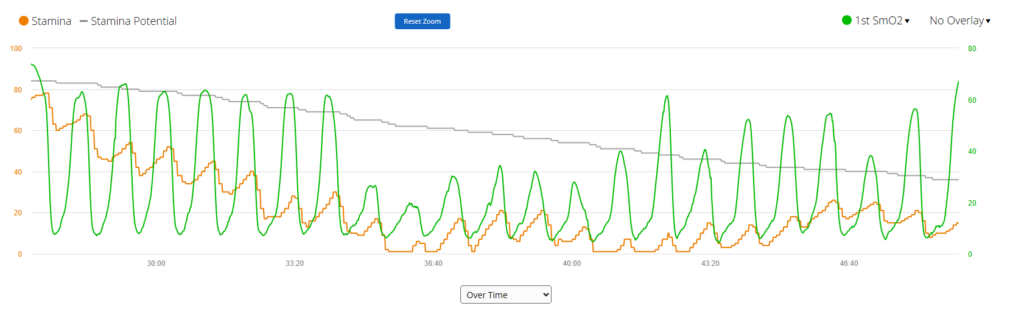
The Garmin Daily Double Dip: A Stamina and Potential Deep Dive Coach Wharton – May 7, 2026 Understanding Garmin Stamina metrics like Actual Stamina and Stamina Potential has fundamentally changed the way we analyze real-time capacity and athletic recovery. While Potential represents your total “fuel tank” for the entire ride, Actual Stamina reflects what you […]
98% Charged: The +61 Garmin Body Battery Bounce Back
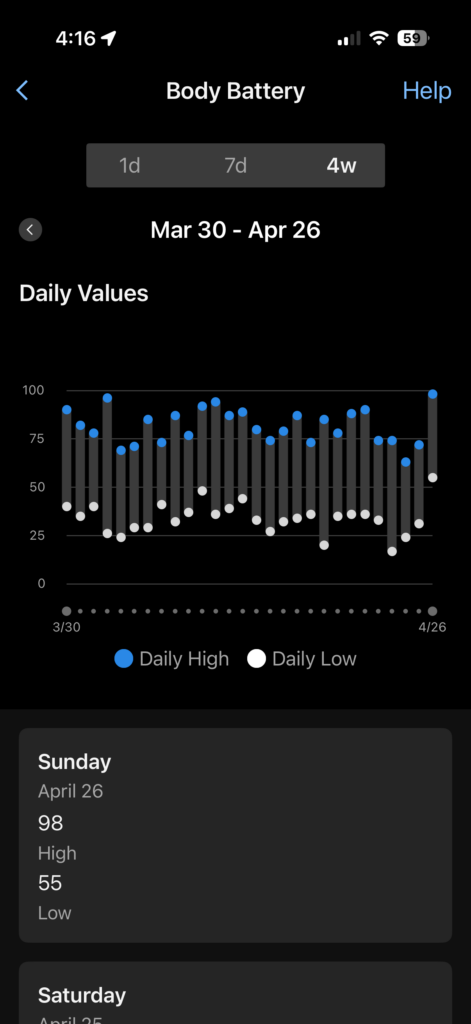
The Great Recharge: How I Pushed My Garmin Body Battery Back to 98 By Richard Wharton Achieving a massive Garmin Body Battery recharge is the ultimate goal after the physical toll of outdoor labor drains you to zero. Following up on my last post, I wanted to share the physiological “bounce back” results that took […]
Garmin HRV Stress Balance: When Life Gets in the Way
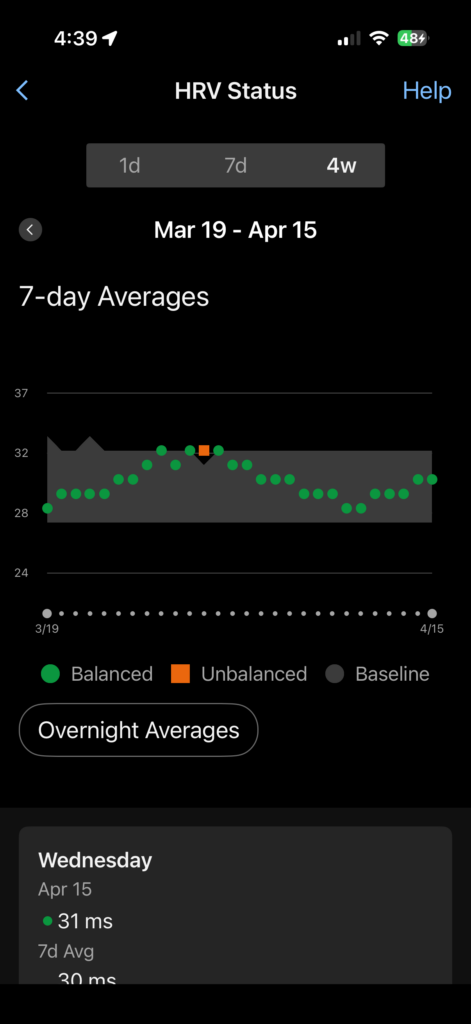
Garmin HRV Stress Balance: When Life Gets in the Way My training, recovery, and daily decisions start with Garmin HRV Stress Balance. I love the fantasy version of training: ride hard, lift heavy, eat clean, sleep eight hours, repeat. And with all the data my Garmin wearables give me — especially my older Garmin Fenix […]