
Stop Ignoring Garmin Performance Condition: How to Use It as a Real-Time Health Governor
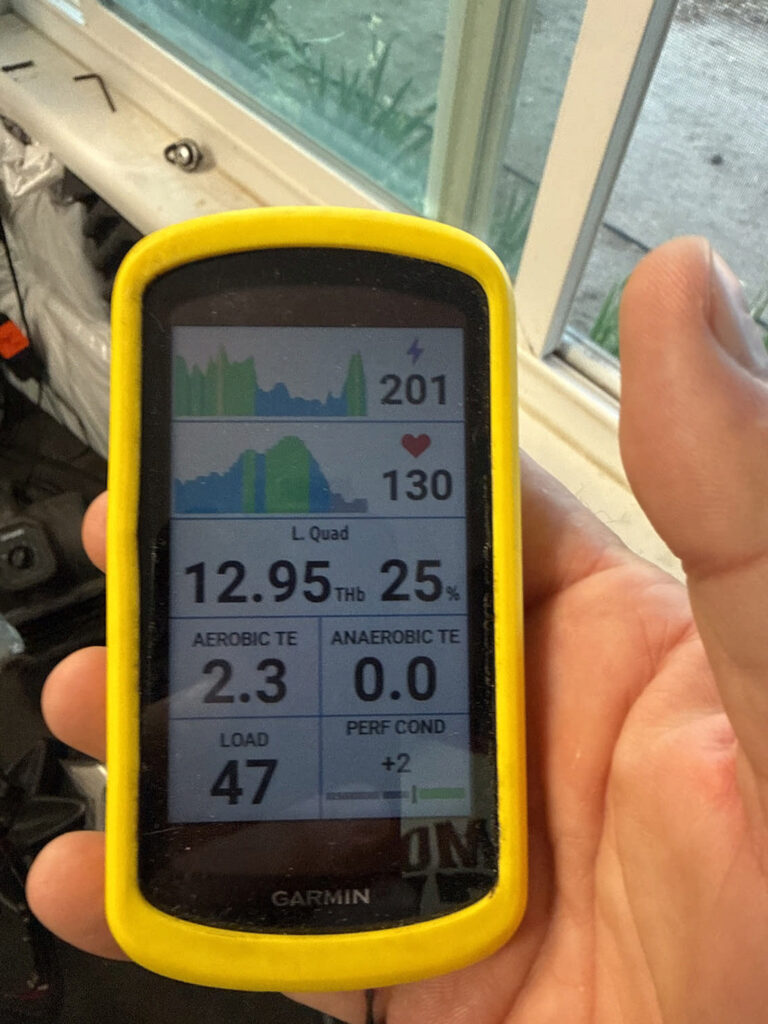
How I Used Performance Condition to Stay Healthy on Today’s Base Ride This morning’s ride wasn’t about speed or hero watts. It was about physiology, recovery, and learning how to leverage Garmin Performance Condition to protect my autonomic system. For the first time, I used this real-time metric as the primary governor for the entire […]
Real-Time Decompensation: Decoupling and the Anatomy of My Failed Workout
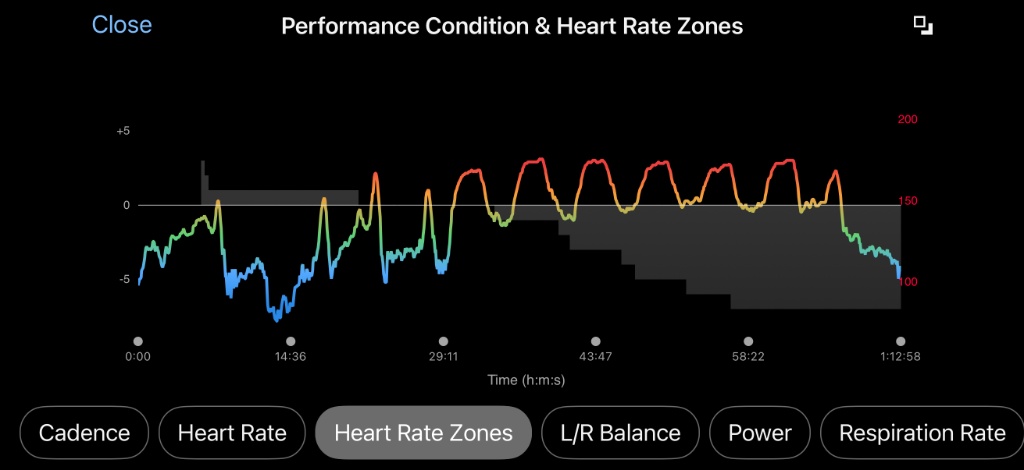
Every endurance athlete knows the feeling of hitting a wall, but few can see it coming down the track with mathematical precision, which is why monitoring your Garmin Performance Condition is so vital during hard blocks. Yesterday, I set out to complete a critical high-intensity maintenance block: 7×3-minute VO2max intervals targeting north of 270 watts. […]
Stamina, Speed, Strength, and Skill – 4 Spokes With a Hub called “Consistency”.
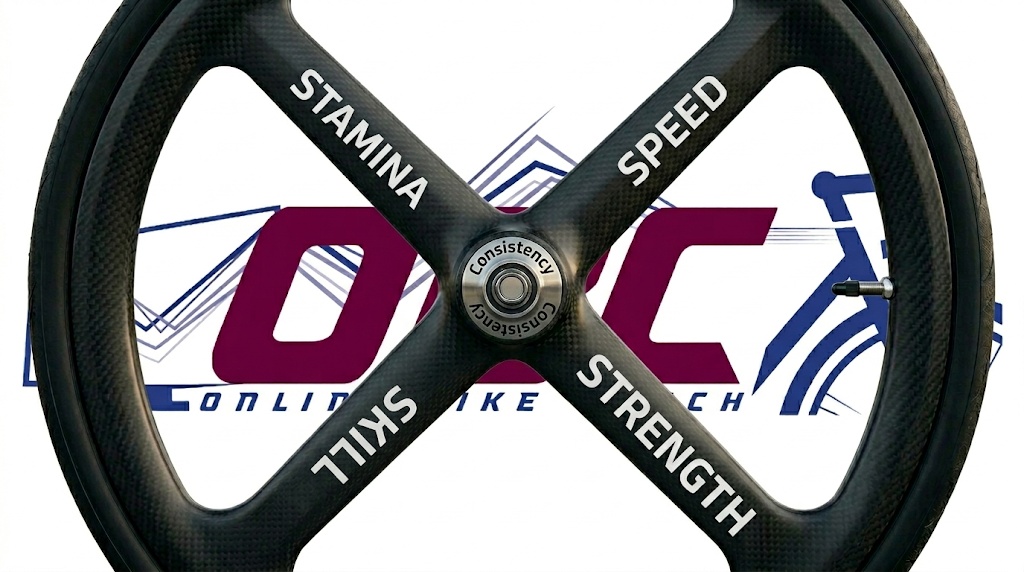
Cycling Stamina and Strength: The S4 Framework Building elite cycling stamina and strength is the foundation of the S4 performance framework used by high-performance athletes.In the world of professional cycling, we often get distracted by the latest gear or chasing the highest wattage. But at its core, your performance is a wheel supported by four […]
The Garmin Daily Double Dip: A Stamina and Potential Deep Dive
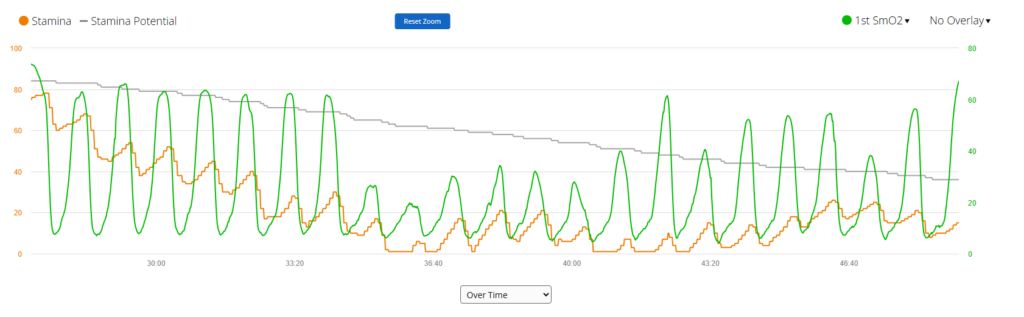
The Garmin Daily Double Dip: A Stamina and Potential Deep Dive Coach Wharton – May 7, 2026 Understanding Garmin Stamina metrics like Actual Stamina and Stamina Potential has fundamentally changed the way we analyze real-time capacity and athletic recovery. While Potential represents your total “fuel tank” for the entire ride, Actual Stamina reflects what you […]
Using Garmin Sleep and HRV Stress to Plan My Workouts: Today’s Real Example
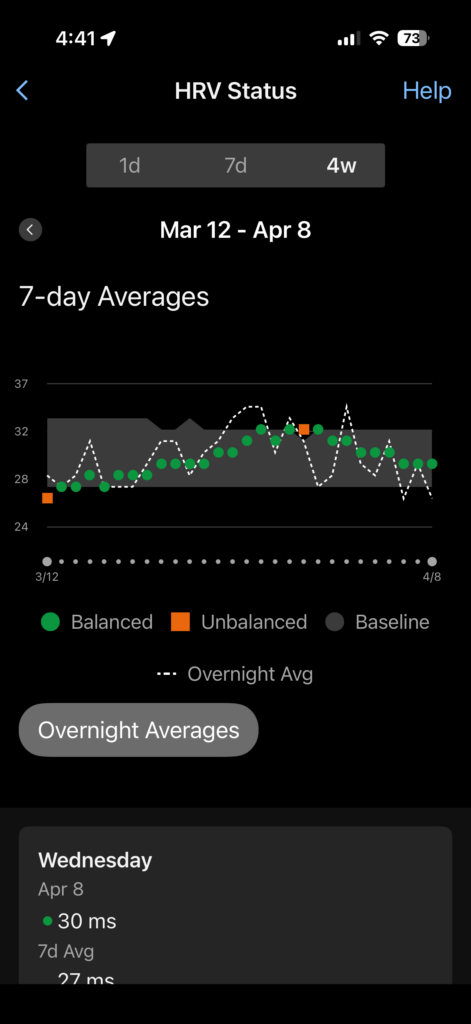
When Garmin HRV Stress Hits 72: A Practical Morning Read on Sleep, Load, and What to Do Next Published: April 8, 2026 · Quick, physiology‑driven guidance for the morning after a high HRV Stress reading. I woke to an HRV Stress of 72 on my Garmin and a Garmin Sleep Score in the […]
Physiology First: Navigating a “Red Light” Morning with AlphaHRV
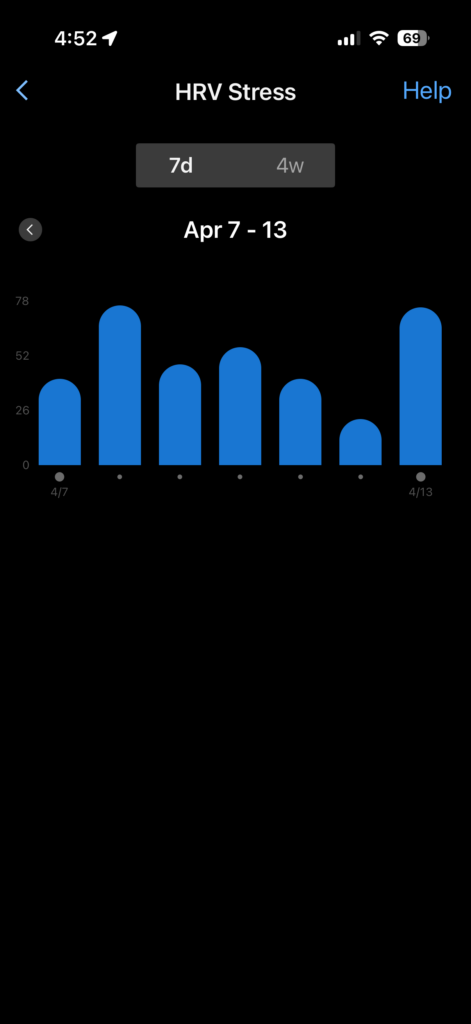
Physiology First: My Red Light Recovery Ride This morning was a masterclass in why I apply a Physiology First framework to every session, looking at the internal engine before I look at the wattage. Between a late meal and the devastating news about my friend Murray being struck by a motorist—suffering a serious […]
Decoding the Hard-Start: How Ronnestad Intervals Impact Garmin Stamina & Training Effect
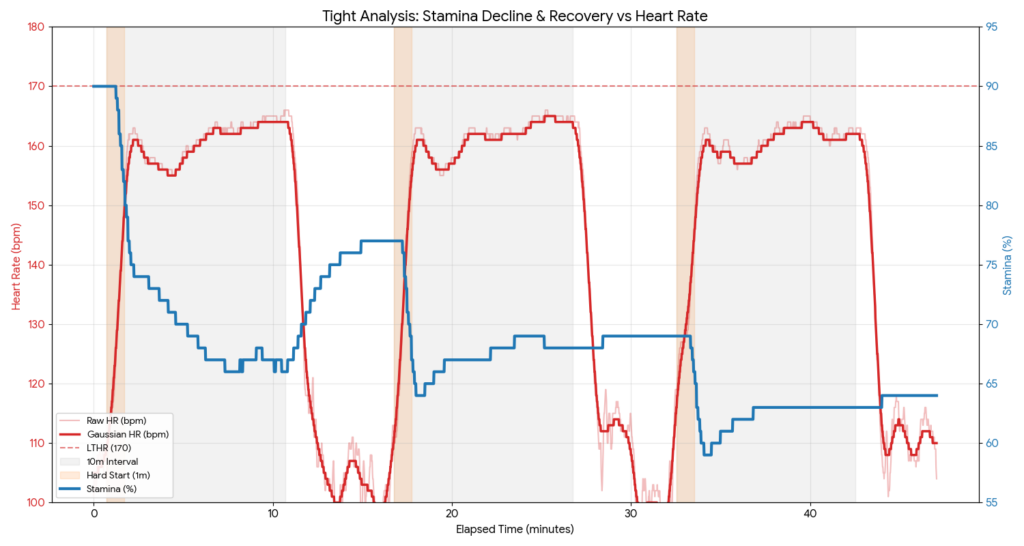
The “Hard-Start” Evolution: Pushing the Limits of the Rønnestad Protocol Testing the Ronnestad Hard-Start Intervals protocol this week provided a fascinating look at oxygen kinetics and internal load. Before this session, I attempted to link my VO2 Master to the phone for a full metabolic calibration. Despite several attempts, the mask simply wouldn’t handshake. Rather […]
Physiological Threshold Vs. FTP: The Power Illusion
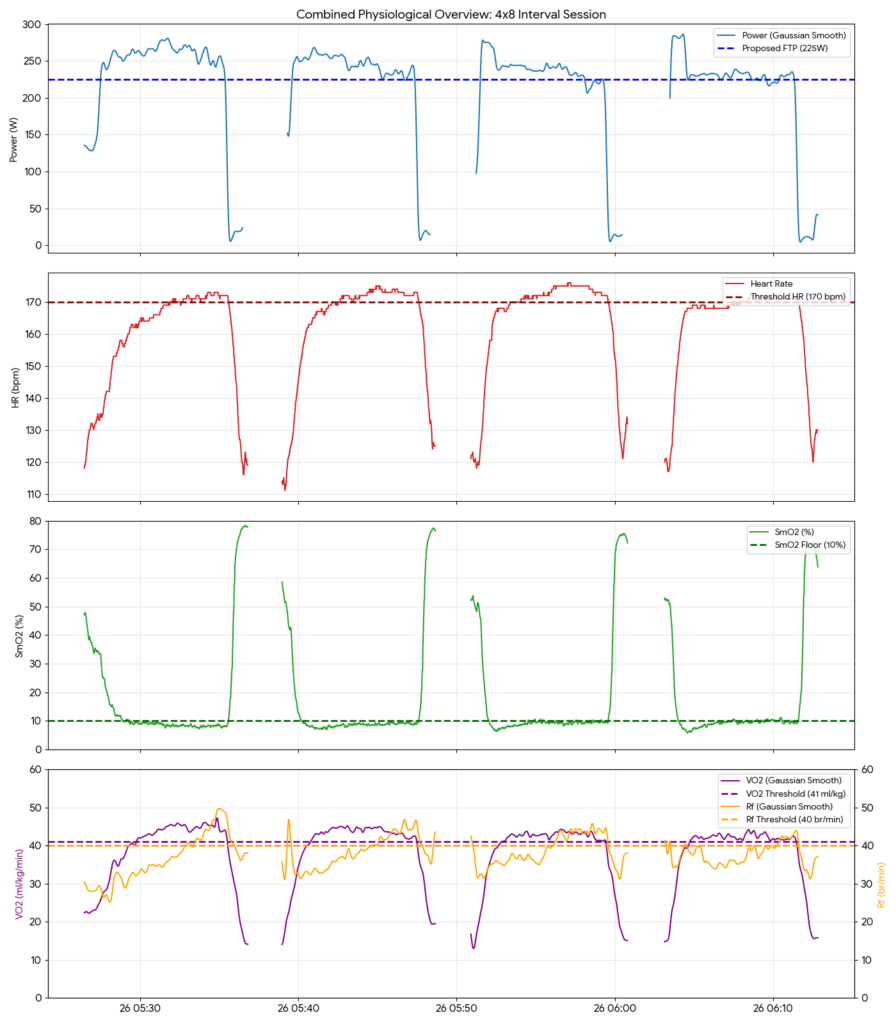
The Power Illusion: Resetting 20 Years of Training with Physiological Data After 20 years of cycling, I realized my FTP wasn’t telling the whole story of my actual physiological threshold. My identity as a cyclist was defined by a single, flickering number on a head unit: Watts. If you’ve spent any significant time in the […]
The OBC Dicta
The OBC Dicta (or, The Nine Commandments for Peak Performance In Cycling). *** I wrote the first version of this over twenty years ago, hoping that it would become the foundation for another book, but life and acceleration got in the way, and I just found it again in my Google Drive. A ‘Dicta‘ is […]
Using Ergometer LOAD vs. % SLOPE for DFAA-1 Base Training
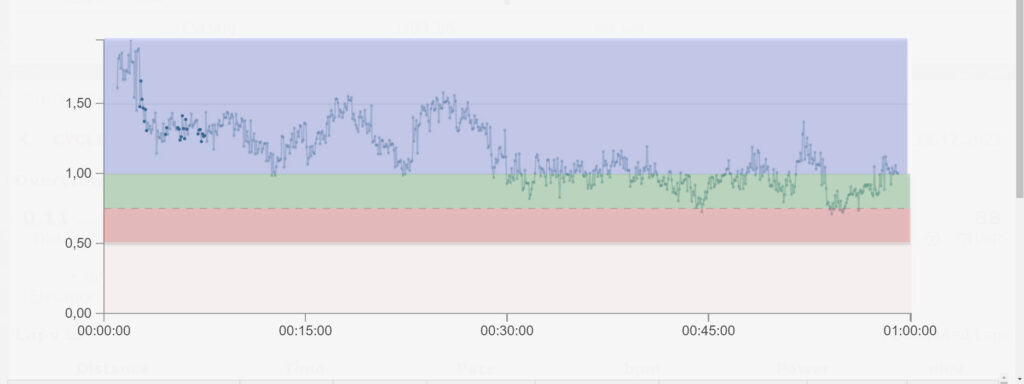
“PerfPro Studio is such a fantastic product for training and analysis. It allows a cyclist to ride at a load based on an ergometer, or a load based on % slope. Yesterday, after assessing my DFAA-1 heart rate, SmO2 and wattage values, I decided to ‘test’ the values….”