
Physiology First Cycling Coaching: How Masters Athletes Over 65 Master High-Intensity Training in the VQ Velocity Studio
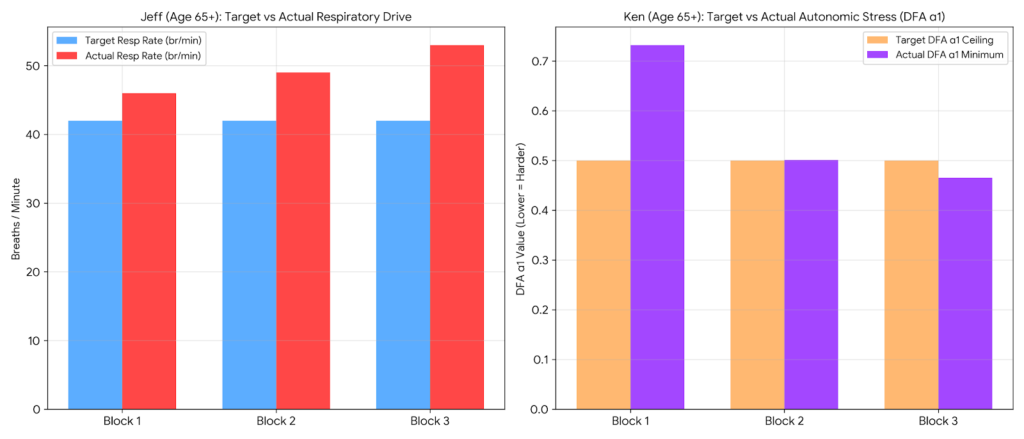
Age is Just a Number: How Two Masters Athletes Over 65 Master ‘Physiology First’ in the VQ Velocity Virtual Studio There is a pervasive myth in cycling that once an athlete crosses age 65, high-intensity training becomes too risky or unproductive. The popular narrative suggests older cyclists should stick strictly to low-intensity cruising. However, by […]
Breaking the Plateau: How Step-Up Intervals Unlock Deep Vo2 Kinetics
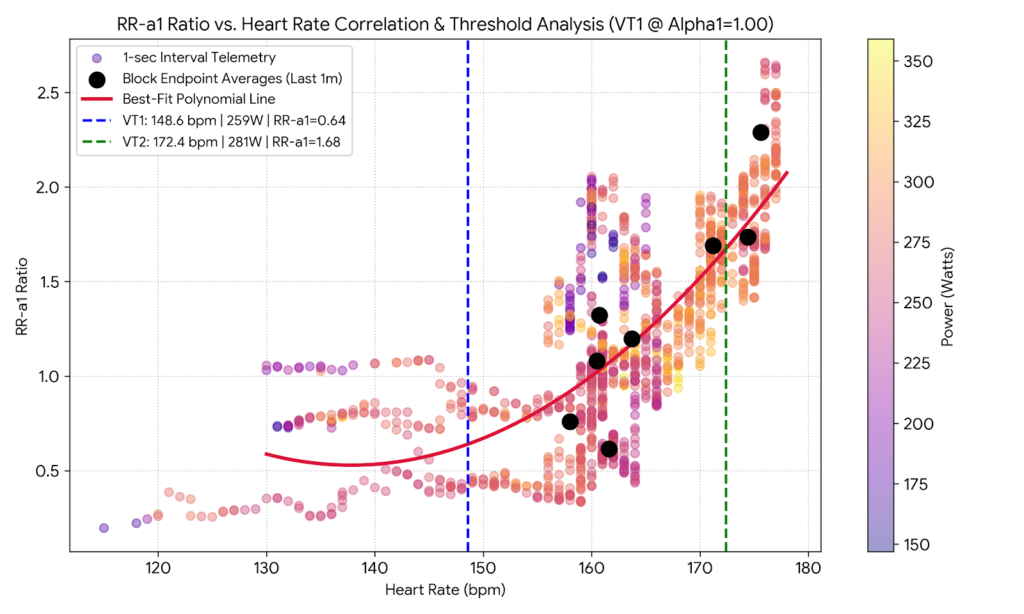
Breaking the Plateau: How Step-Up VO2 Max Intervals Unlock Deep Oxygen Kinetics By Richard Wharton | OnlineBikeCoach.com Executing step-up VO2 max intervals is one of the most effective strategies I use to drive time near maximal oxygen uptake without causing premature neuromuscular exhaustion. Standard flat-power VO2 max sets often result in either a slow […]
When “Easy” Power Isn’t Easy: A VO2 Master Data Deep Dive
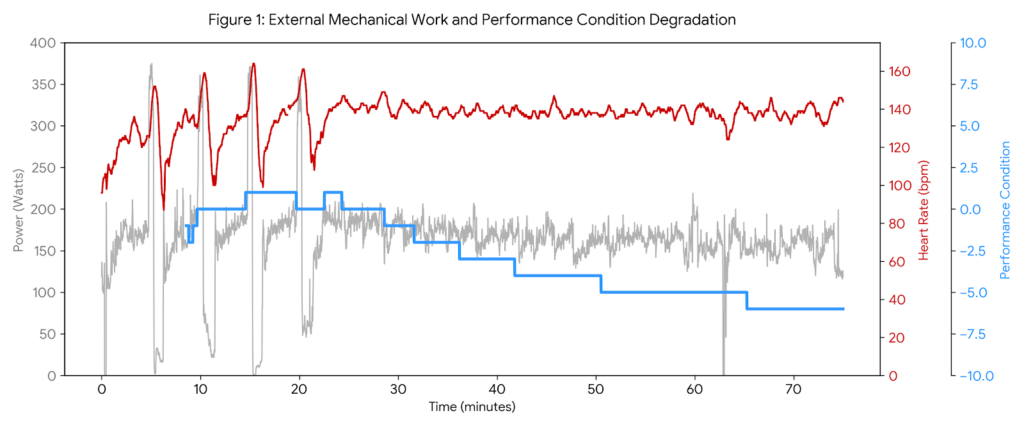
Analyzing VO2 Master data reveals a stark reality check from my ride this Friday morning. I expected a straightforward, low-intensity recovery base day. Instead, my body gave me a loud warning. Even though I intentionally kept my external intensity low, the internal cost of the ride was exceptionally high. This ride is a textbook example […]
Real-Time Decompensation: Decoupling and the Anatomy of My Failed Workout
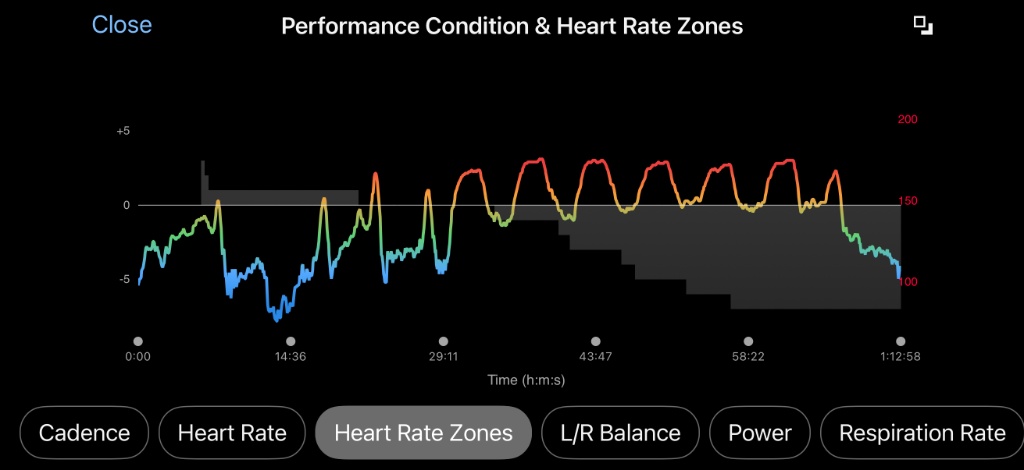
Every endurance athlete knows the feeling of hitting a wall, but few can see it coming down the track with mathematical precision, which is why monitoring your Garmin Performance Condition is so vital during hard blocks. Yesterday, I set out to complete a critical high-intensity maintenance block: 7×3-minute VO2max intervals targeting north of 270 watts. […]
The Autonomic Pivot: When Less Training Volume Equals Deeper Recovery
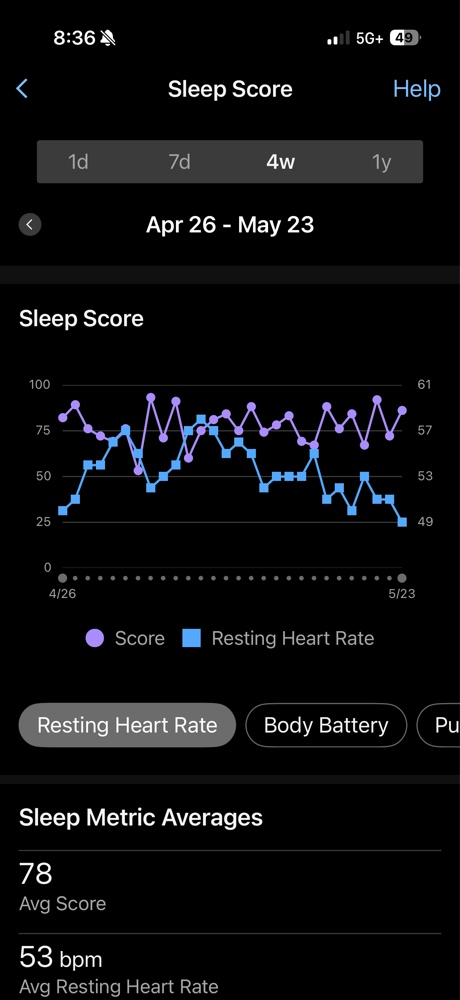
The Autonomic Pivot: When Less Training Volume Equals Deeper Recovery By Coach Richard Wharton, OBC | Published: May 25, 2026 Tracking my **Garmin HRV Stress** over the last few months has revealed a fascinating tug-of-war within my autonomic nervous system. Specifically, it shows exactly how shifting training workloads register on the body. Looking back at […]
Cracking the Code: My Physiology First Tabata VO2 Max Deep Dive
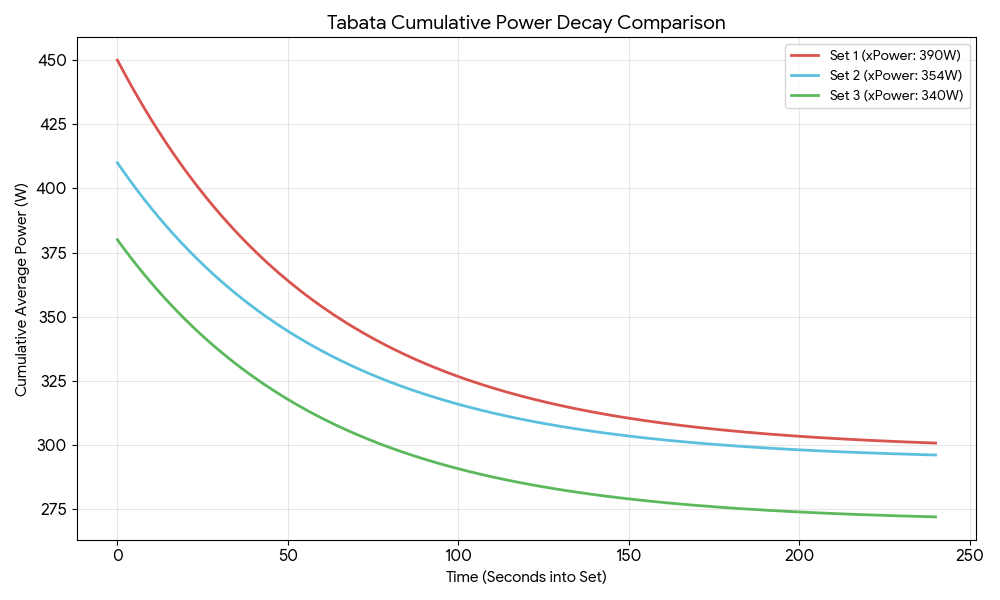
Cracking the Code: My Physiology and the Tabata Triple Threat Preface: The Metabolic Green Light vs. The CNS Red Light Before I even turned a pedal, the data was already telling a nuanced story. I woke up with a solid 83 sleep score and a body battery that recharged to 85—clear signals that my recovery […]
Stamina, Speed, Strength, and Skill – 4 Spokes With a Hub called “Consistency”.
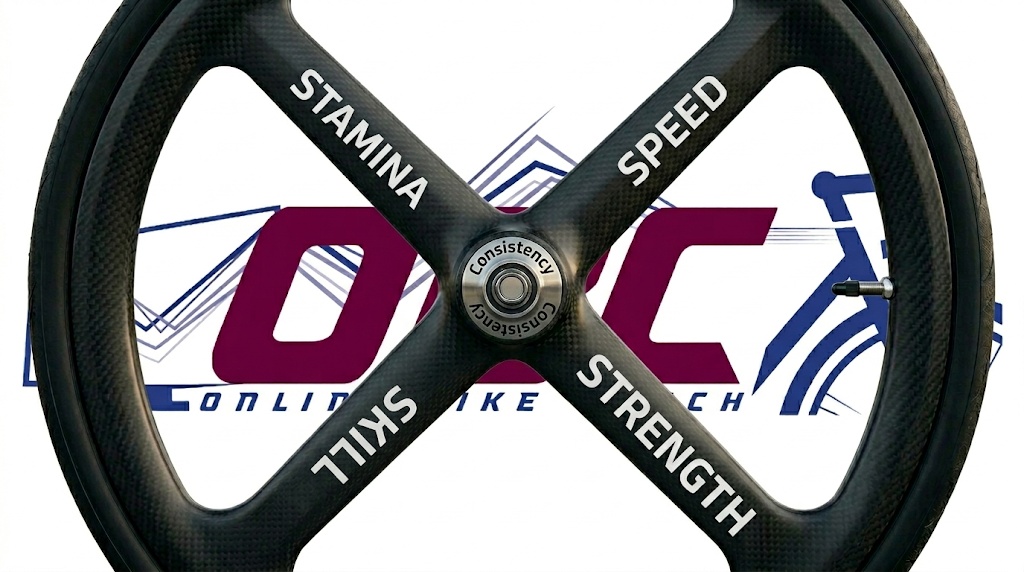
Cycling Stamina and Strength: The S4 Framework Building elite cycling stamina and strength is the foundation of the S4 performance framework used by high-performance athletes.In the world of professional cycling, we often get distracted by the latest gear or chasing the highest wattage. But at its core, your performance is a wheel supported by four […]
The Garmin Daily Double Dip: A Stamina and Potential Deep Dive
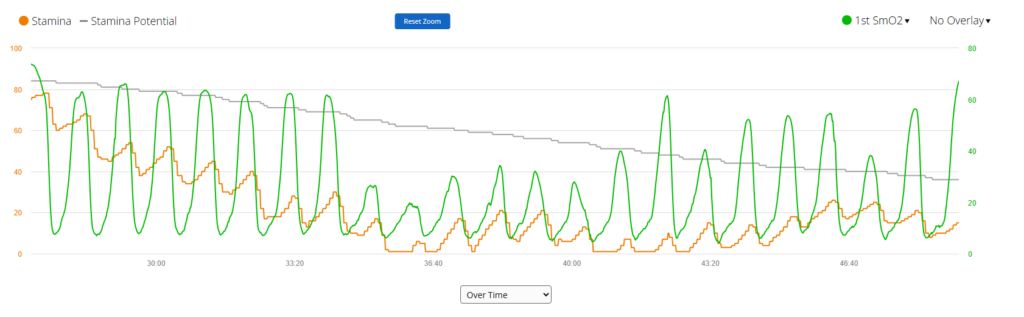
The Garmin Daily Double Dip: A Stamina and Potential Deep Dive Coach Wharton – May 7, 2026 Understanding Garmin Stamina metrics like Actual Stamina and Stamina Potential has fundamentally changed the way we analyze real-time capacity and athletic recovery. While Potential represents your total “fuel tank” for the entire ride, Actual Stamina reflects what you […]
Why Your “Free” Garmin Metrics are More Accurate Than You Realize
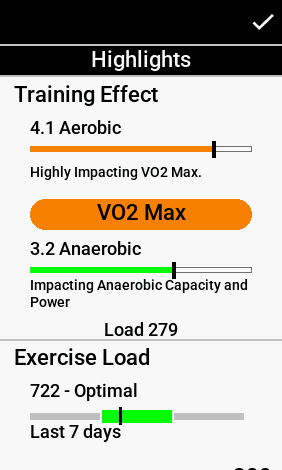
Why Your “Free” Garmin Metrics are More Accurate Than You Realize When athletes ask about Garmin VO2 Max accuracy, they are usually skeptical about whether a consumer wearable can truly measure the high-octane reality of a 15-15 interval set. On paper, today’s session was a classic builder—two sets of 15-minute micro-intervals—but as a physiology-first coach, […]
98% Charged: The +61 Garmin Body Battery Bounce Back
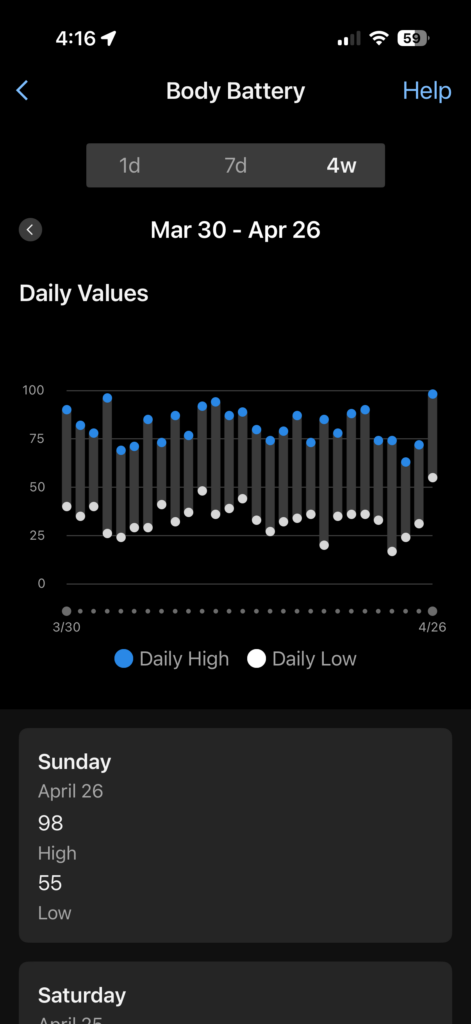
The Great Recharge: How I Pushed My Garmin Body Battery Back to 98 By Richard Wharton Achieving a massive Garmin Body Battery recharge is the ultimate goal after the physical toll of outdoor labor drains you to zero. Following up on my last post, I wanted to share the physiological “bounce back” results that took […]