Chasing Ghosts on Peavine: The Ecology of Speed
By Coach Richard Wharton • May 27, 2026
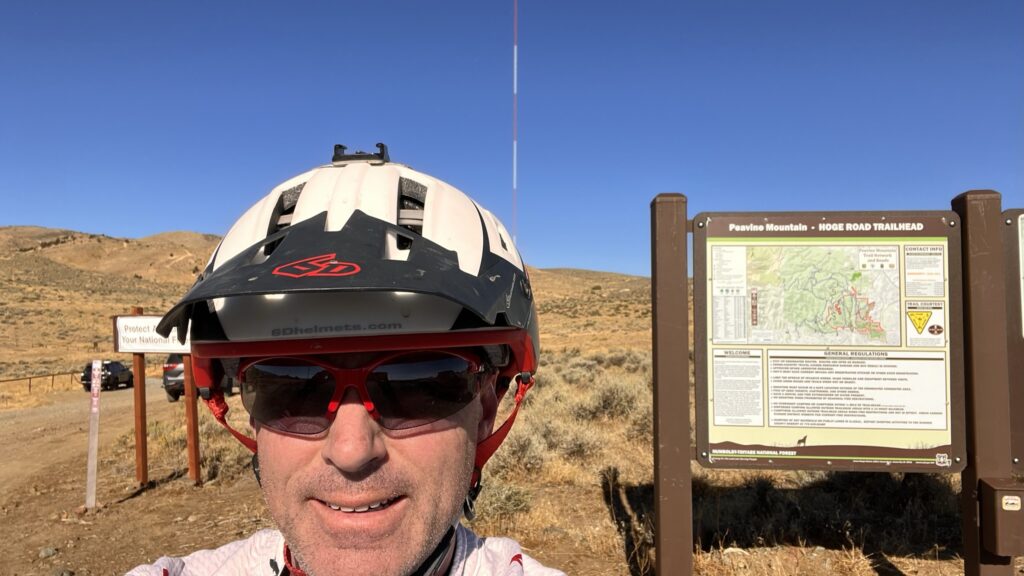 Heading out from the Peavine Mountain Hoge Road Trailhead to collect raw biometric and suspension telemetry across the Halo Loop.
Part 1: Physiology-First Cycling Training, the Weight, and the Climb Metrics
It has been months since I last pointed my tires toward the iconic Halo Trail segment on Peavine Mountain. Mentally, I felt locked in, strong, and completely ready to attack the mountain. However, as a coach dedicated to a Physiology-First Cycling Training approach, I know that subjective feelings are just noise. Therefore, the data always tells the real story.
When you look at the historical clock spanning back to the 2019–2022 block—when this loop served as the spine for the legendary Reno Wheelmen Peavine Challenge XC Course—the numbers show a clear regression. Consequently, I am slower on these timed segments. To understand exactly why, we have to look past the surface and systematically evaluate the entire physiological and environmental ecosystem across a rapid-fire testing block in mid-May.
The Autonomic Blueprint & The Chassis Mass
Before turning a single pedal stroke, my training readiness was already written by my central nervous system and body composition metrics:
- Overnight Sleep Score: 69/100 (Poor / Strained)
- Overnight HRV Average: 31 ms
- The Weight Variable: 74.5 kg (vs. a lean 70.7 kg last November)
A sleep score of 69 paired with an overnight HRV of 31 ms indicates clear sympathetic nervous system dominance. Meanwhile, my body was carrying a heavy reservoir of baseline fatigue from coaching, driving blocks, and throwing around heavy timber doing manual labor for neighbors.
Furthermore, pure physics dictates that hauling an extra 3.8 kg (8.4 lbs) of dense skeletal muscle up a steep grade requires massive extra kinetic energy. Ultimately, gravity treats muscle from manual labor exactly the same as body fat on a steep climb.
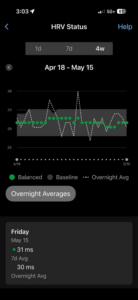
Figure 1a: Overnight HRV trends displaying a down-trending autonomic recovery indicating clear sympathetic dominance.
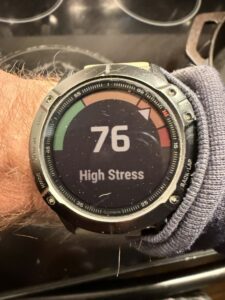
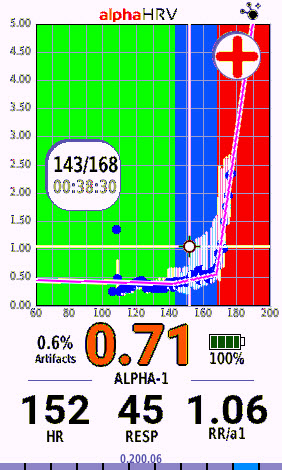
Figure 1b: On-bike Garmin HRV stress test flashing a high stress score right before rolling out.

Figure 1c: Garmin Connect sleep report displaying a Sleep Score of 75, matching systemic exhaustion.
Head-to-Head Climb Metrics for Physiology-First Cycling Training
To find out exactly where the performance went, we aligned the elevation profiles from my recent May rides with my two-lap session from November 2025. By evaluating the exact same altitude window—starting at 1602 m and finishing at the peak of 1759 m—we look at pure mechanical and metabolic work.
This data highlights why implementing a rigid methodology fails, and why an adaptive, data-driven framework built on true internal load metrics forms the foundation of sustainable, long-term athletic development. As a matter of fact, this data utilizes actual VO2 Master mask data for respiration rather than derived smart-device guestimates:
| Metric | Nov 2025 (Lap 1 – Open) | Nov 2025 (Lap 2 – Locked) | May 15, 2026 (Open) | May 19, 2026 (Validation) |
|---|---|---|---|---|
| Rider Weight | 70.7 kg | 70.7 kg | 74.5 kg | 74.5 kg |
| Climb Duration | 22 min 22 sec | 22 min 44 sec | 22 min 39 sec | 22 min 41 sec |
| Average xPower | 227.2 W | 227.4 W | 205.4 W | 207.1 W |
| Power-to-Weight | 3.21 W/kg | 3.21 W/kg | 2.76 W/kg | 2.78 W/kg |
| Garmin Grit Score | 18.4 (Hero Dirt) | 18.6 (Hero Dirt) | 24.1 (Parched/Loose) | 23.9 (Parched/Loose) |
| VAM (Ascent Rate) | 421.2 m/h | 416.0 m/h | 418.0 m/h | 417.4 m/h |
| Average Heart Rate | 161.5 bpm | 168.2 bpm | 166.9 bpm | 165.8 bpm |
| Average VO2 (Mask) | 32.4 ml/kg/min | 32.1 ml/kg/min | 44.3 ml/kg/min | 43.8 ml/kg/min |
| Avg Respiratory Freq | 42.0 br/min | 44.7 br/min | 43.0 br/min | 42.6 br/min |
| Average SmO2 (Quad) | 8.9% | 9.4% | 13.3% | 12.9% |
| Average DFA a1 | 0.87 | 0.73 | 0.88 | 0.86 |
The Grit and Lockout Illusion
In general, the data across both May rides proved that the engine still churned out a massive physiological effort, dragging a heavier chassis up the mountain at a consistent ~418 m/h VAM on a low battery. Correspondingly, Garmin’s proprietary MTB Dynamics Grit metric confirmed the trail texture was significantly more resistant, jumping from late-autumn hero dirt baselines up to an aggressive 24.1.
Historically, I found that hitting the remote lockout on my Fox Float DPS Factory rear shock was the only way to get a ShockWiz climbing score above 90. However, looking closer at the true mask data from November, the lockout is a false efficiency.
“When switching from Open to Locked, my respiratory frequency jumped from 42.0 to 44.7 br/min. Because the lockout turned the bike into a rigid hardtail, my body had to become the shock absorber against the baked, cracked clay blocks of Peavine, driving up my metabolic cost.”
Furthermore, a locked rear tire skips over loose gravel, creating micro-slippage that routinely steals forward momentum.
Related Telemetry and Testing Deep Dives
If you are tracking my testing loops across Reno, check out my previous technical diagnostics over on the Online Bike Coach Blog Archive, where I map metabolic thresholds, metabolic analyzer metrics, and suspension tunes on these exact segments.
Part 2: The Hardware Deficit & Physiology-First Cycling Training Solutions
If the engine is still intact, what gives on the descents? The clock shows I am consistently 30 to 60 seconds slower descending the Halo Loop and surviving the tight hairpins of Snow Terrace than in previous years. Therefore, to find those missing seconds, we have to transition from physiological metrics to chassis telemetry, tire pressure physics, and the rapid evolution of bike geometry.
The Kinematic Reality Check
In simpler terms, our historical baseline must be contrasted against modern frame parameters to reveal mechanical blind spots. The bike I used to set my historical benchmarks was a 2012 Trek Superfly 100 Pro. It was a pure cross-country race rocket of its era: ultra-lightweight, steep 71-degree head angle, short wheelbase, and a rigid suspension platform. It felt fast because its steep geometry automatically placed my center of mass right over the front tire contact patch.
Today, I am aboard a 2022 Intense Sniper T Expert (Size Large). It is a modern downcountry machine with a slack 66.5-degree head angle and a long wheelbase. It is light-years safer on technical descents, but a slack bike requires an entirely different piloting style. For instance, if you ride it with defensive, old-school body positioning, the front wheel gets incredibly light. Consequently, it pushes, squiggles, and washes out in loose transitions.
Historical Baseline
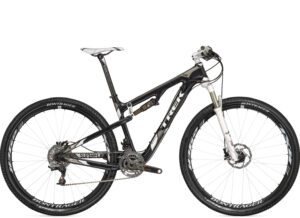
2012 Trek Superfly 100 Pro
The 2012 Trek Superfly 100 Pro — featuring the steep, aggressive geometry that defined an era of cross-country racing and serves as our historical performance baseline.
Review the classic, aggressive steep-geometry cross-country parameters and component layouts over on VitalMTB.
View Specs on VitalMTB →
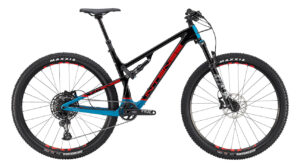
2022 Intense Sniper T Pro
The 2022 Intense Sniper T Expert — my modern, long-and-slack testing platform, currently undergoing precision cockpit and damping adjustments to match my physiological engine.
Examine the long, slack downcountry kinematics and factory configuration metrics archived on VitalMTB.
View Specs on VitalMTB →
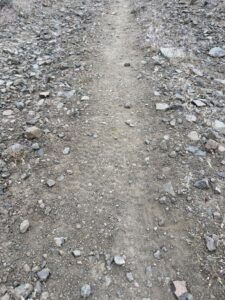
Figure 2: Trail Surface Textures — Hardpack Clay Coated with Loose Marbles. The environment — classic Peavine ‘moon dust’ coating a hardpack clay base, creating an extremely low-traction surface that demands precision handling and high tire casing stability.
Unmasking the Descending Bottleneck
To properly diagnose the handling bottleneck, I pulled the telemetry logs from my ShockWiz sensors across the May 15th and May 19th sessions. As a result of this testing, the data revealed a massive component imbalance. The front fork scored a near-flawless 96, tracking beautifully. However, the modified Fox Float DPS rear shock consistently sputtered at an 84.
When entering chattery turns, an underperforming rear shock causes the bike to pitch or “buck.” Consequently, the rear wheel deflects off embedded rock edges, unweighting the front tire right when you need traction. This forces you to unconsciously grab the brakes and scrub critical exit speed.
Front Suspension
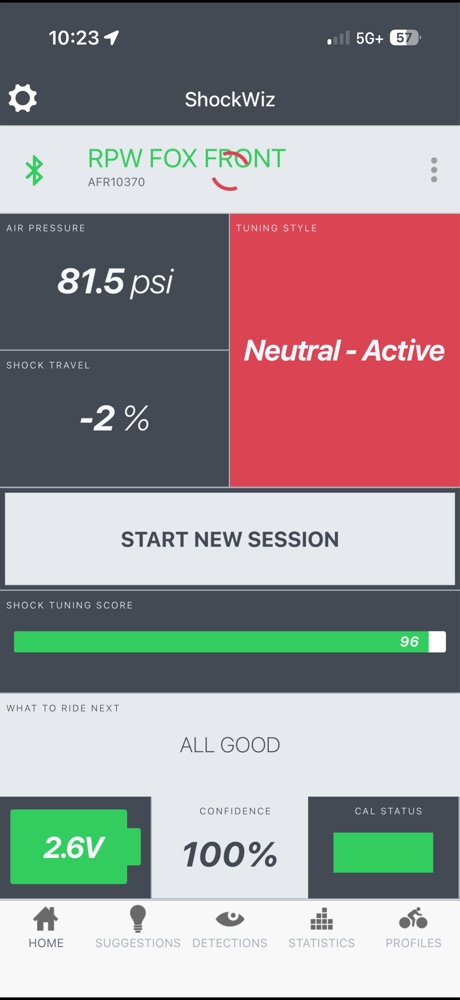
Figure 4a: Front fork tracking flawlessly over high-desert chatter blocks.
Rear Dashboard
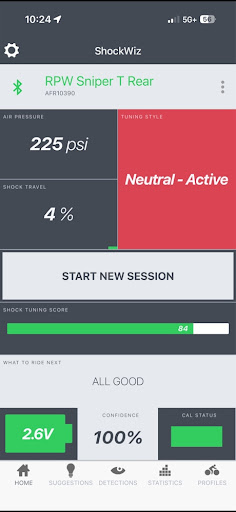
Figure 4b: Rear shock sputtering at 84, pitching over rock edges.
Rear Telemetry Stats
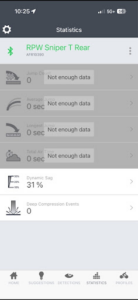
The 30-40% Sag Trap
When ShockWiz logs a harsh rear end, the immediate temptation is to let out 5 to 8 psi to soften the feel. But on a short-travel, 120mm dual-link VPP chassis like the Sniper T, dropping air pressure into a 35–40% sag window is a mechanical trap:
- Usable Stroke Deprivation: At 40% sag, you surrender 48mm of travel just sitting on the saddle, leaving you with a measly 72mm of remaining stroke to survive high-speed rock gardens. Therefore, you will blow right through the mid-stroke and experience harsh bottom-outs.
- Anti-Squat Destruction: The Sniper’s JS Tuned platform relies on a tight, engineered anti-squat pocket (25–30% sag) to resist pedal bob. Past 30%, anti-squat drops off a cliff. Consequently, the bike wallows and bobs every time you put power down.
- The Pedal Strike Zone: Lowering air pressure drops your dynamic bottom bracket height. Furthermore, this error causes you to constantly clip your pedals on embedded high-desert granite.
The Tire Rim Bottleneck
The trail surface on Peavine is baked clay hardpack covered in a loose veneer of decomposed granite marbles and silty moon dust. To track across this, tire profile is everything.
My current Maxxis Forekaster 2.40″ tires are mounted to the stock 27mm internal width rims. Because 2.40″ tires are engineered around a wider 30mm baseline, the narrower 27mm rim forces the tire casing into a rounded “lightbulb” profile. This pulls the aggressive cornering knobs up and away from the dirt. At 17 psi, the tire casing physically squirms and rolls under my 74.5 kg mass. Therefore, my nervous system interprets this as an impending crash, forcing me heavily onto the brakes.
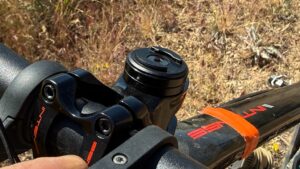
Figure 3: Short MTB Stem Cockpit Upgrade. The 50mm solution — a clean, short mountain bike stem used to pull the cockpit back, lift the rider’s chest, and transfer load from the wrists to the core.
The Optimization Playbook
We aren’t trying to rebuild the rider or the bike setup from 2019; instead, we are optimizing the athlete and the machine of 2026. Transitioning to custom Physiology-First Cycling Training parameters allows us to identify and address mechanical bottlenecks systematically. The immediate playbook to regain confidence and speed consists of three distinct phases:
- The Cockpit Reset: I removed the long 100mm stem and reinstalled the original stock 50mm stem, while swapping out the real-estate-hogging bar-end grips. This pulls my hands back by 2 inches and widens my functional stance to the full 720mm width of the SQ Labs bars (16° sweep / 4° upsweep). This instantly shifts my torso into a neutral, athletic posture, unlocking my elbows to act as natural suspension and taking the structural mass off my carpal tunnel to stop my fingers from going numb.
- The Temporary Tire Fix: Until upgrading to a wider 30mm rim layout, I am bumping the front tire pressure to 18.5–19 psi. This structurally braces the casing against the 27mm rim, eliminating the lateral squirm in sandy hairpins. Furthermore, a move to a supple Schwalbe Evolution line configuration—a Nobby Nic (Addix Speedgrip) up front to slice through sand and a premium Racing Ralph (Addix Speed) in the rear—will restore that lightning-fast, high-TPI compliance my muscle memory is missing.
- The Damping Cure: I am tracking internal volume spacers to flatten the current spring curve, keeping compression wide open. But because this inline factory shock forces a compromise between climbing support and descending compliance, I am officially saving up for a Cane Creek Air IL. Its Twin-Tube architecture will allow me to run a crisp, high-riding 25% climbing sag pocket, while independently dialing down High-Speed Compression to completely iron out the Snow Terrace chatter.
Ultimately, the clock doesn’t lie, but neither does the telemetry. The engine is there. Now, the machine matches the athlete.
I’ve been a cycling coach since 1993, when I realized that there was no one available or willing to teach ME how to be a better bicyclist. My calling literally came from an Epiphany on a mountain top in Scotland in May of 1992. For better or for worse, it’s been my complete and sole passion to help people learn how to bicycle, and fall in love with it as much as I have. If you want a LIVE, REAL, PERSONAL coach who will help YOU, intrinsically, then click either button and let’s get started. Thank you.
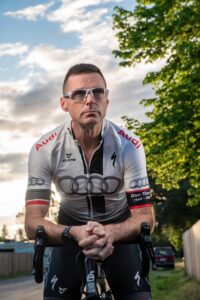
Coach Richard Wharton, leading the “Physiology First” charge since 1993.