Garmin Stamina VO2 Threshold: Mapping the Fatigue Trigger
In my ongoing pursuit of the “Physiology First” training approach at Onlinebikecoach.com, I have used the Garmin Stamina VO2 Threshold to map exactly where my internal stability ends and metabolic exhaustion begins. To build a more resilient aerobic engine, I need to know my limits. With my VO2max sitting at 58 ml/kg/min, I’ve identified a critical threshold at 45 ml/kg/min—a point that represents the gateway to metabolic instability for me.
To train this effectively, I recently performed a high-density 2×14-minute 22/8 micro-interval session. This protocol (22 seconds “on” / 8 seconds “off”) is designed to “park” the aerobic system at threshold by preventing any meaningful recovery during the rest periods. While many athletes are familiar with the 15-15 or the Ronnestad 30/15, I built this workout as a more potent alternative to the traditional 15-15.
The Philosophy of 22/8: Why it Beats the 15-15
I didn’t choose 22/8 at random. This workout is built upon the concept of the “metabolic penalty”—a physiological delay in oxygen kinetics. My mentor, Philip Skiba, has extensively researched these dynamics in peer-reviewed literature, specifically how the VO2 time constant (τ) determines exercise tolerance. In his seminal work, “Modeling the expenditure and reconstitution of work capacity above critical power,” Skiba explores how work capacity is depleted and replenished.
By capping the “on” portion at 22 seconds, I saturate the aerobic system right at the peak of the primary VO2 phase without allowing the “slow component” to cause premature failure. Most individuals have a VO2 time constant of approximately 20-30 seconds; 22 seconds is the “sweet spot” where we maximize the metabolic stimulus before efficiency begins to degrade.
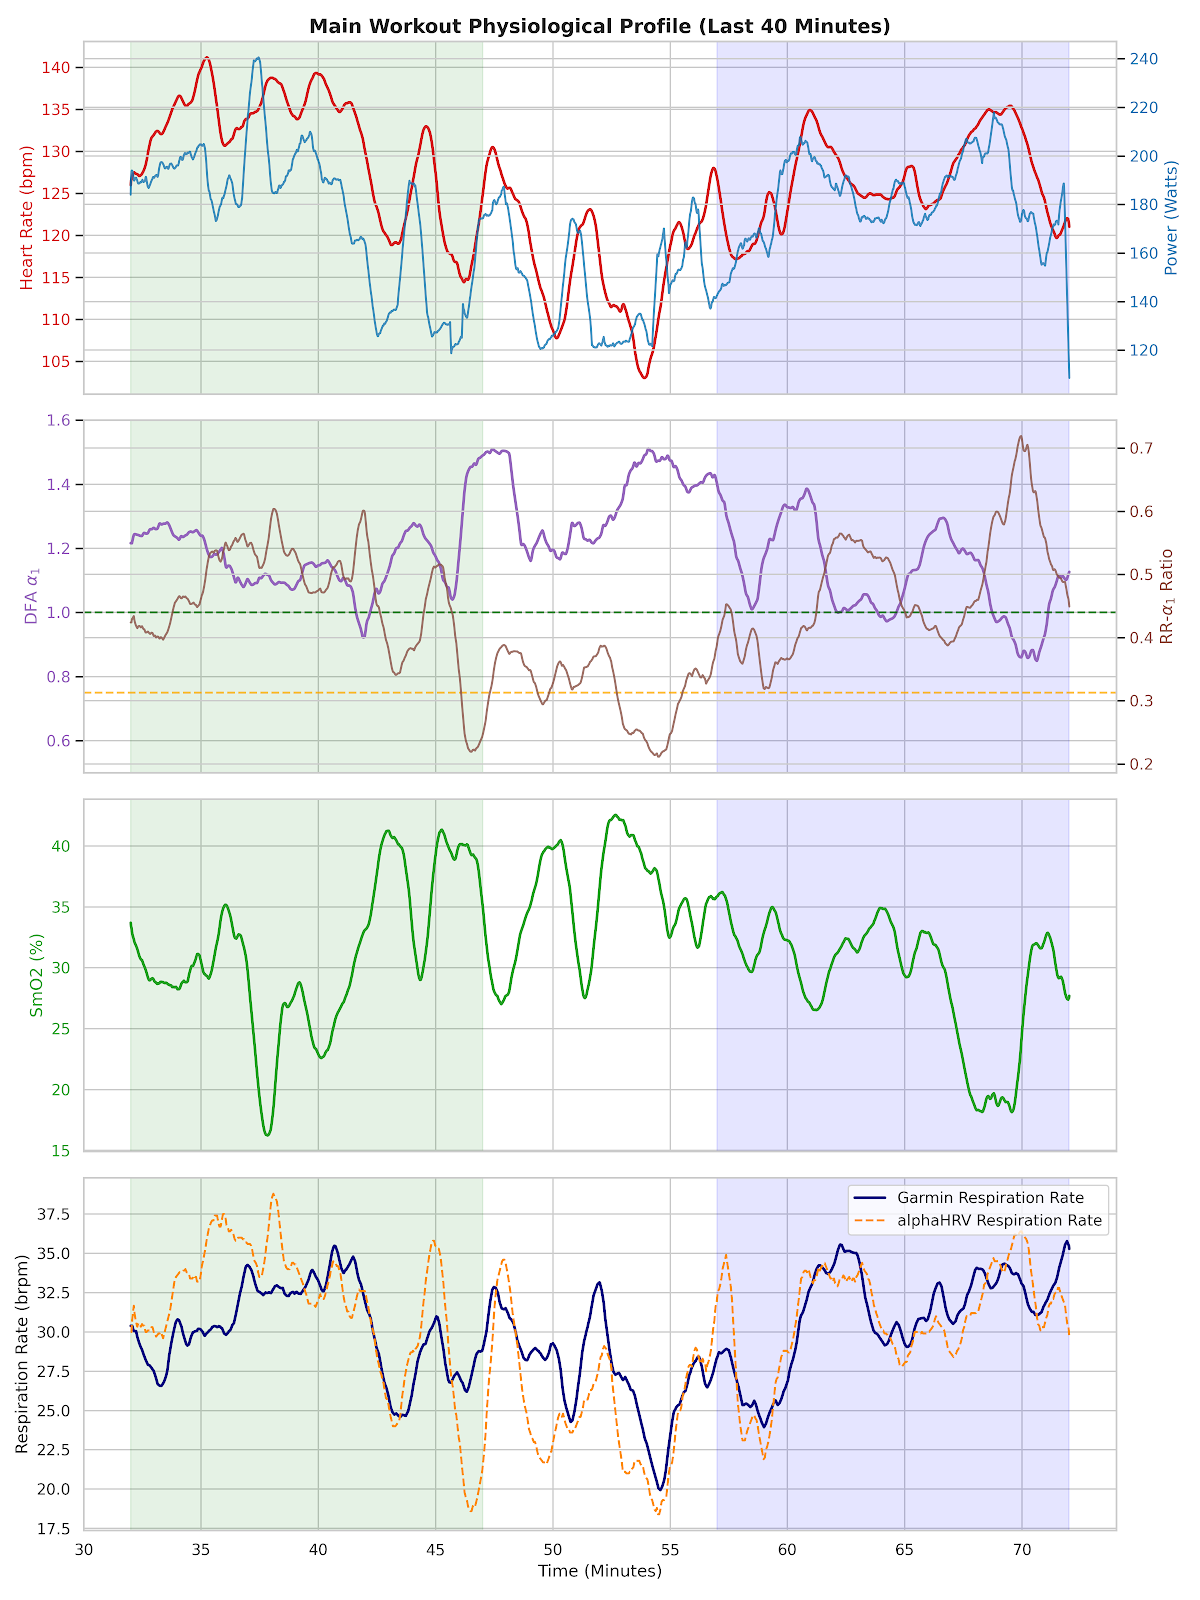
The “Metabolic Breath”: SmO2 and Moxy Sensor Precision
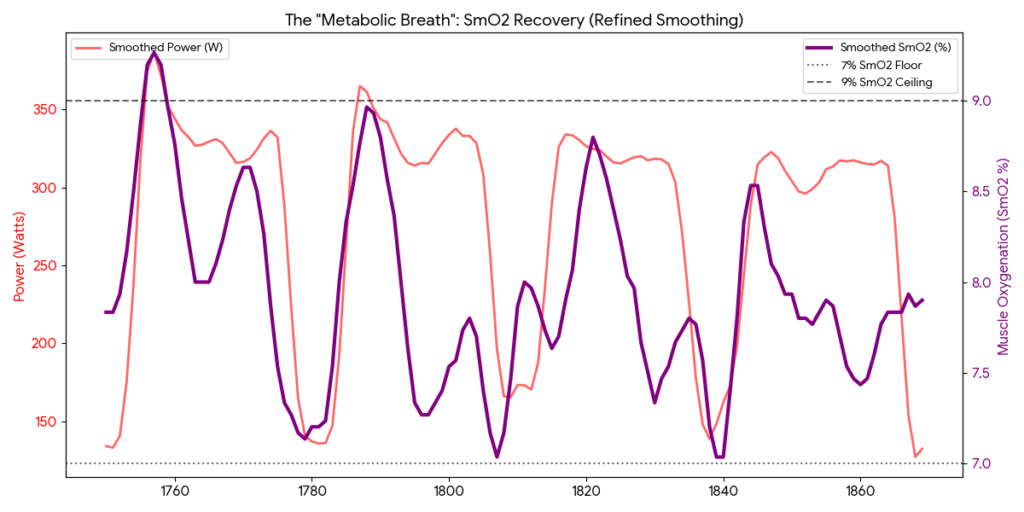
One phenomenon I’ve long suspected—and can finally confirm through my data—is the acute re-oxygenation that occurs during the 8-second recovery. We simply cannot see this level of detail without the Moxy sensor. Moxy has been a stalwart supporter of data-driven coaching for over 10 years, and it is the only tool capable of catching these high-frequency muscle oxygenation shifts.
While 8 seconds isn’t enough to drop my heart rate or VO2, it is exactly what ATP/CP (Phosphagen) replenishment needs. My analysis shows a consistent 1-2 point rise in SmO2 during every 8-second recovery. This “SmO2 Hump” represents a metabolic deep breath, allowing for a brief reset of the intramuscular environment that enables me to sustain a 14-minute threshold block at a power output that would otherwise be unsustainable.
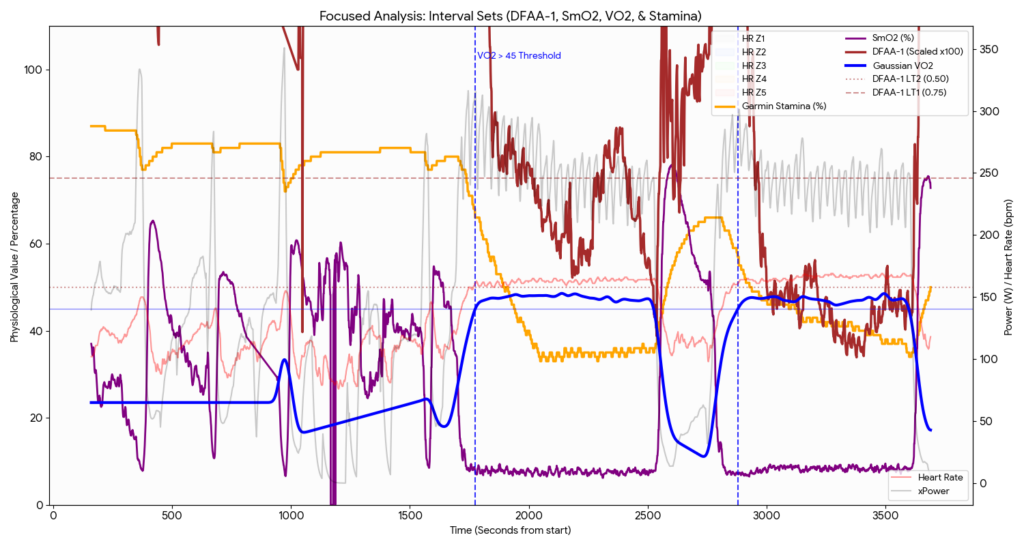
The Dr. Bruce Rogers Framework: DFAA-1 and Fractal Stability
I rely heavily on the research of Dr. Bruce Rogers from Muscle Oxygen Training to interpret my internal load. Dr. Rogers’ work on DFA a1 (DFAA-1) provides a non-invasive window into the autonomic nervous system. Per his research, I use 0.75 as my Aerobic Threshold (LT1) and 0.50 as my Anaerobic/Respiratory Compensation Threshold (LT2).
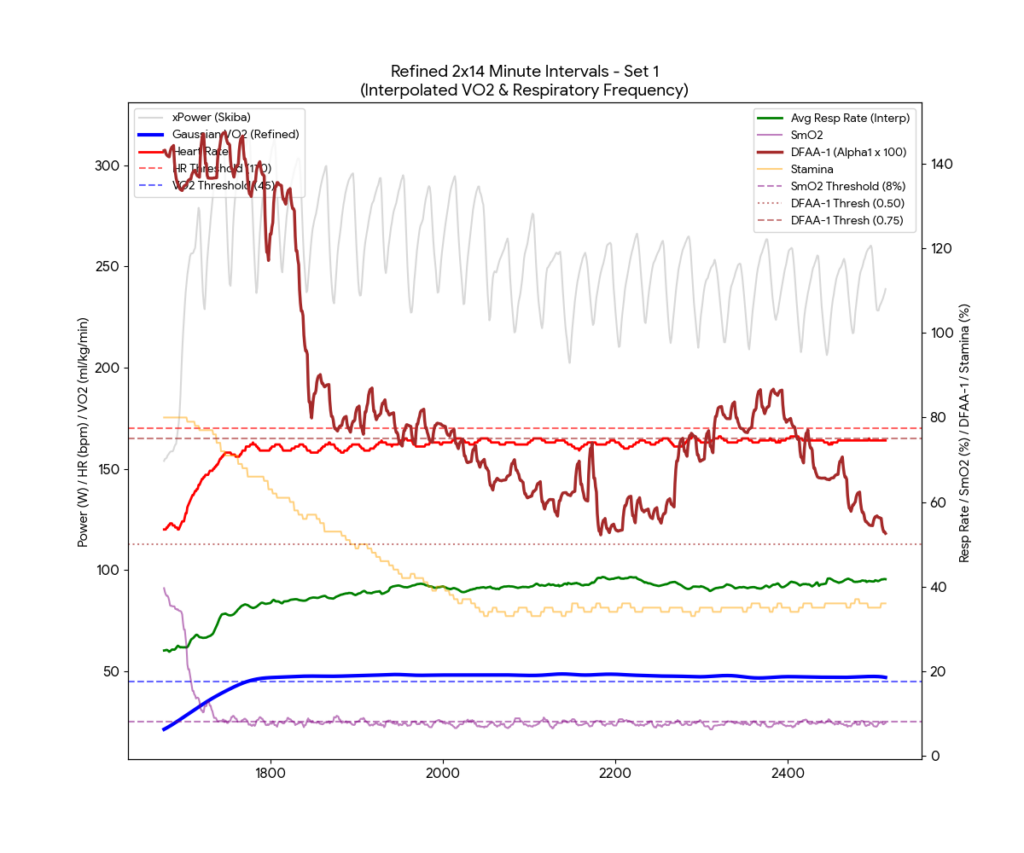
Workout Data: The Threshold Averages (Last 10m)
| Metric | Set 1 Average | Set 2 Average | Target / Threshold |
|---|---|---|---|
| Avg Power | 247.1 W | 240.0 W | 225-240w |
| Avg Heart Rate | 163 bpm | 166 bpm | 170 bpm (LTHR) |
| Avg VO2 (Refined) | 47.7 ml/kg/min | 47.1 ml/kg/min | 45 ml/kg/min |
| Avg DFAA-1 | 0.69 | 0.45 | 0.75 (LT1) / 0.50 (LT2) |
| Avg SmO2 | 7.5% | 8.4% | 8% |
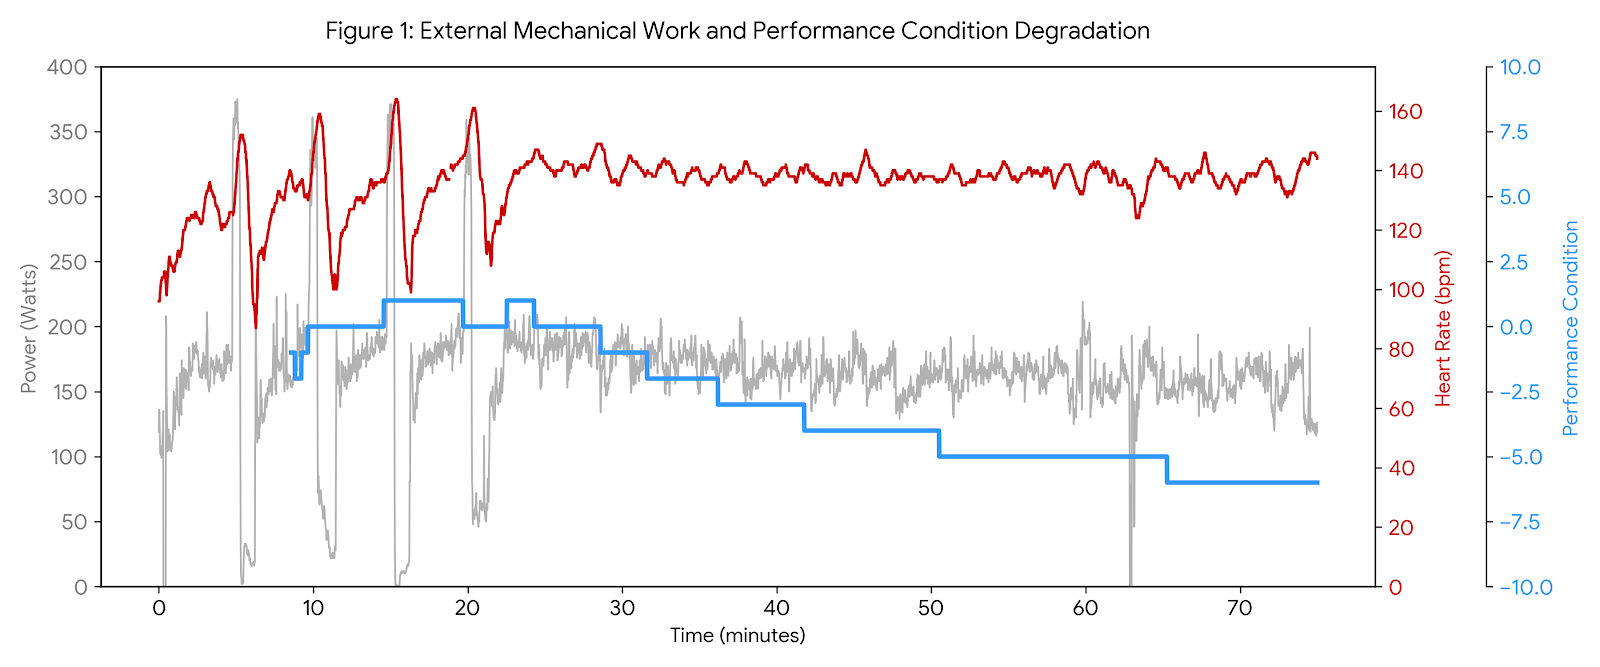
Mapping the Garmin Stamina VO2 Threshold and Decay
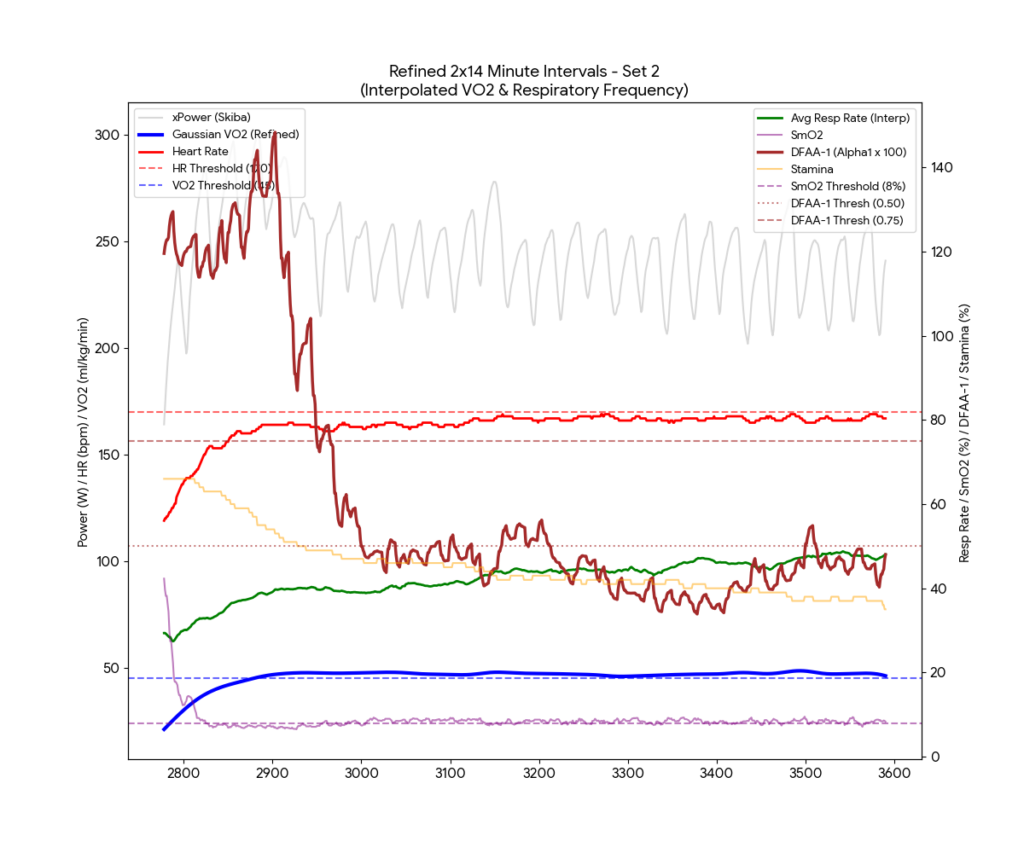
By zooming in on the interval sets, the relationship between my metabolic output and the Garmin Stamina VO2 Threshold becomes unmistakable. The moment my VO2 crosses the 45 ml/kg/min threshold, my Stamina begins a steep and linear descent. This confirms that 45 ml/kg/min is the “pivot point” where my effort becomes non-sustainable.
Conclusion
If you want to understand your limits, you must master the Garmin Stamina VO2 Threshold by looking at the intersection of power and internal state. The 22/8 protocol is one of the most efficient ways to park your VO2 in that 80-85% zone. By tracking these decays, I can ensure that every pedal stroke is moving my threshold higher.
Join the Community & Support the Content
If you’re ready to take your training to the next level and join our live coached sessions, sign up below!
Enjoying the deep dives? Support the work by buying me a coffee!

For more technical coaching insights and data deep-dives, visit me at Onlinebikecoach.com.