
Mastering Garmin Performance Condition: Decoding Autonomic Stability and Aerobic Coherence Through Strategic Hydration
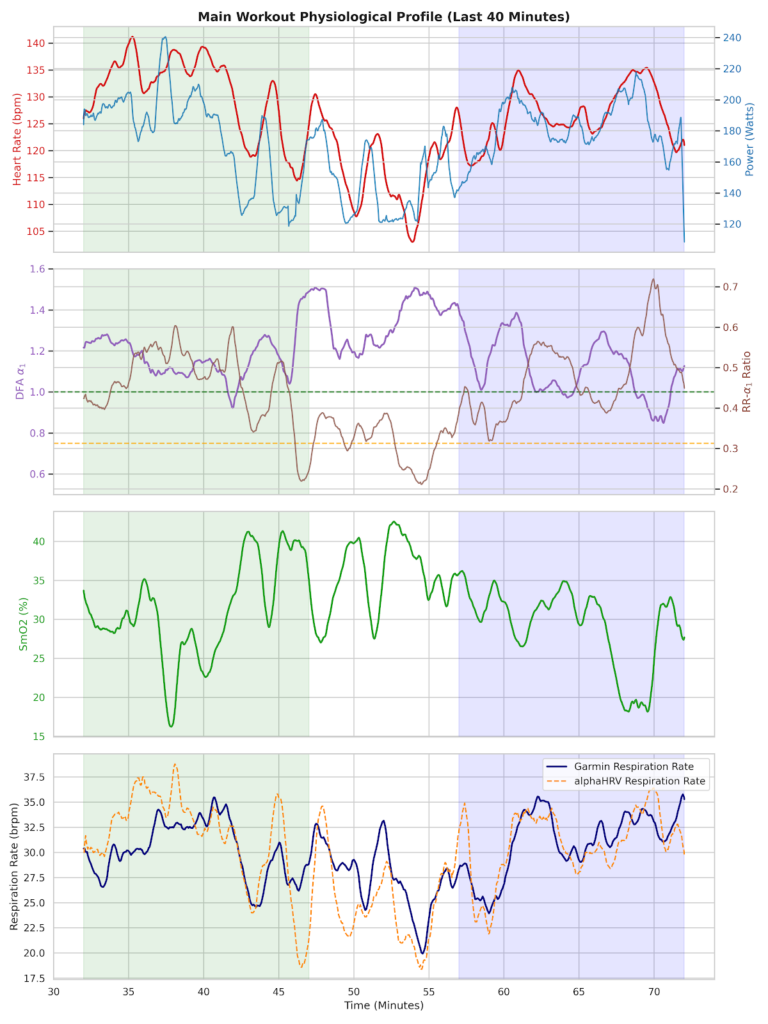
Mastering Garmin Performance Condition: Decoding Autonomic Stability and Aerobic Coherence Through Strategic Hydration For any cyclist serious about internal metabolic load, optimizing your training relies heavily on advanced metrics like Garmin Performance Condition tracking. Far more than a transient number that pops up ten minutes into your ride, it serves as a real-time metabolic voltmeter. […]
When “Easy” Power Isn’t Easy: A VO2 Master Data Deep Dive
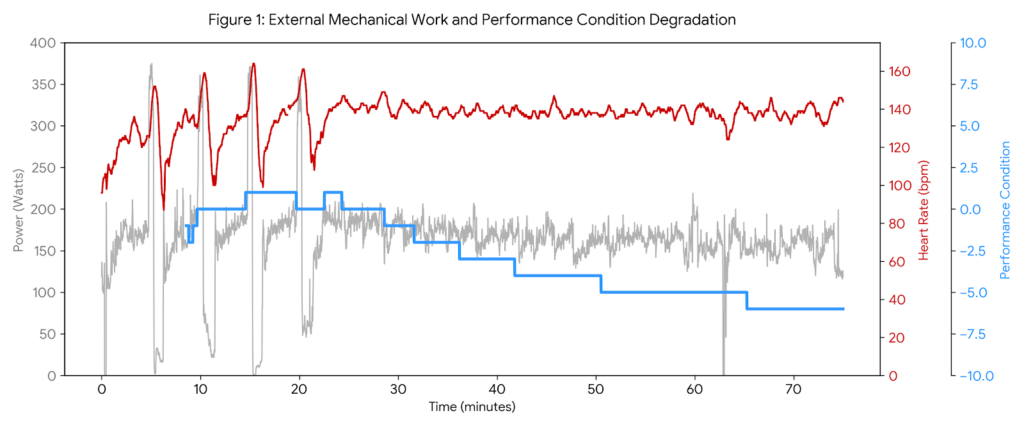
Analyzing VO2 Master data reveals a stark reality check from my ride this Friday morning. I expected a straightforward, low-intensity recovery base day. Instead, my body gave me a loud warning. Even though I intentionally kept my external intensity low, the internal cost of the ride was exceptionally high. This ride is a textbook example […]
The Dehydration Decoupling: Managing Real-Time Metabolic Cost
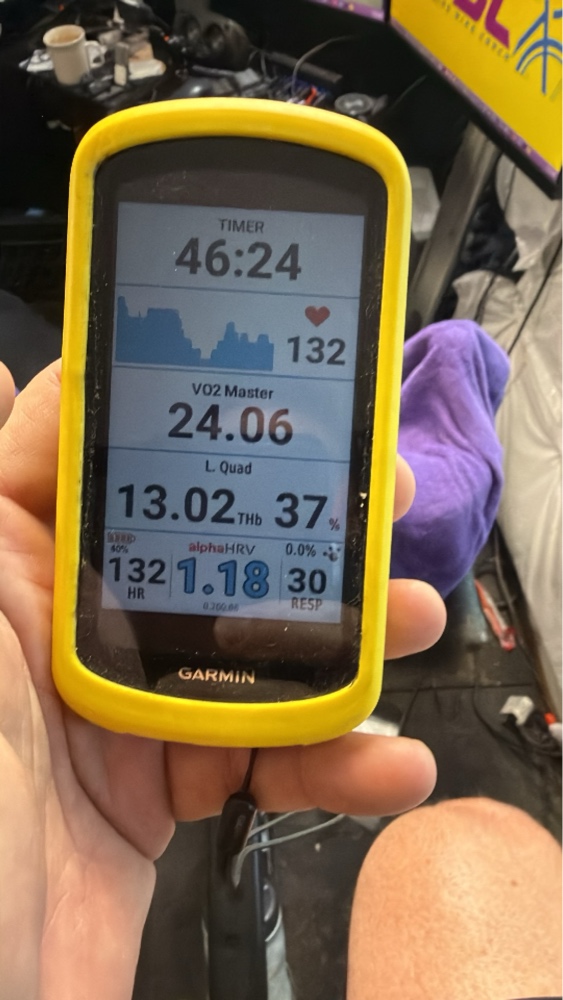
The Dehydration Decoupling: Managing Real-Time Metabolic Cost By Rich Wharton – The Garmin Guru • Physiology First / Garmin Ecosystem Analysis Managing a sudden dehydration decoupling is the absolute secret to keeping your internal engine from running scorching hot during baseline workouts. Consequently, I started my Monday morning baseline endurance ride feeling like absolute gold, […]
Stop Ignoring Garmin Performance Condition: How to Use It as a Real-Time Health Governor
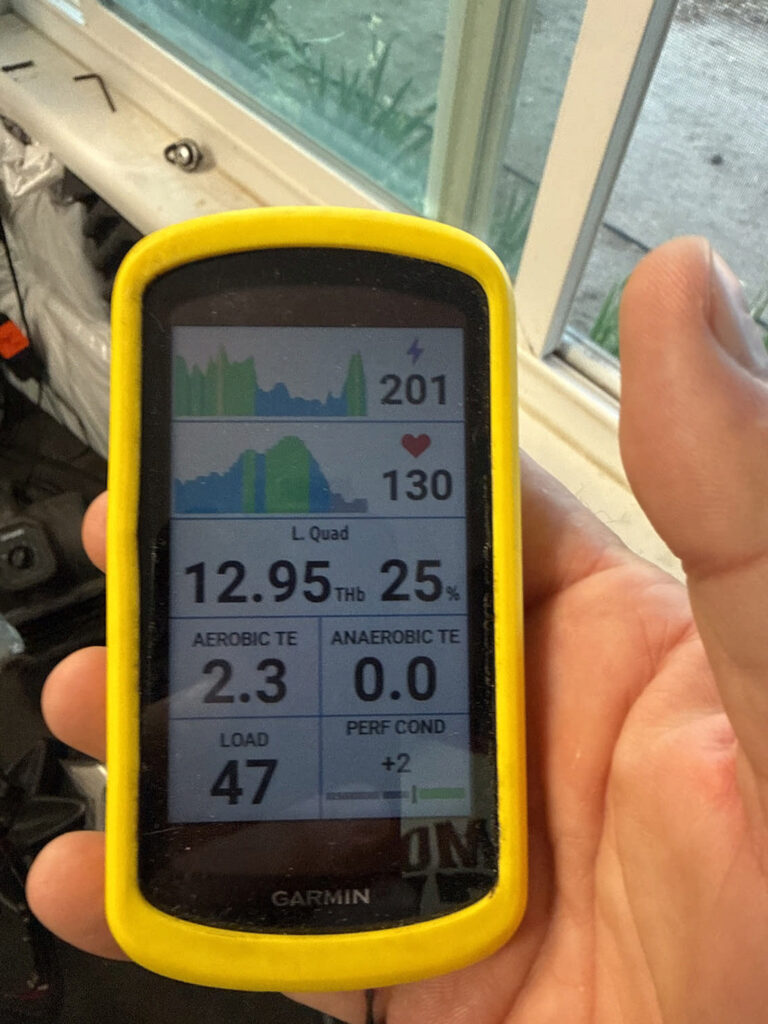
How I Used Performance Condition to Stay Healthy on Today’s Base Ride This morning’s ride wasn’t about speed or hero watts. It was about physiology, recovery, and learning how to leverage Garmin Performance Condition to protect my autonomic system. For the first time, I used this real-time metric as the primary governor for the entire […]
Real-Time Decompensation: Decoupling and the Anatomy of My Failed Workout
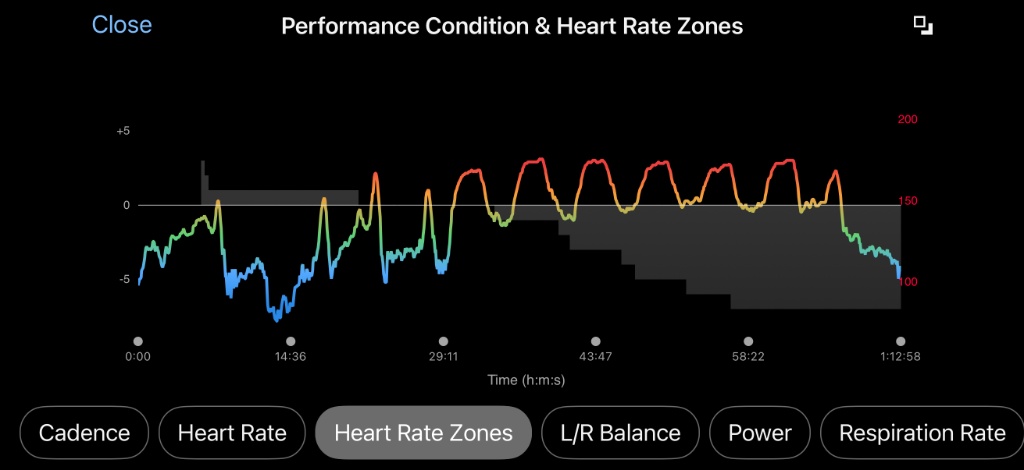
Every endurance athlete knows the feeling of hitting a wall, but few can see it coming down the track with mathematical precision, which is why monitoring your Garmin Performance Condition is so vital during hard blocks. Yesterday, I set out to complete a critical high-intensity maintenance block: 7×3-minute VO2max intervals targeting north of 270 watts. […]
The Dissociation of the Internal and External Relays: Why a ‘Physiology First’ Approach Rules Ronnestad Intervals
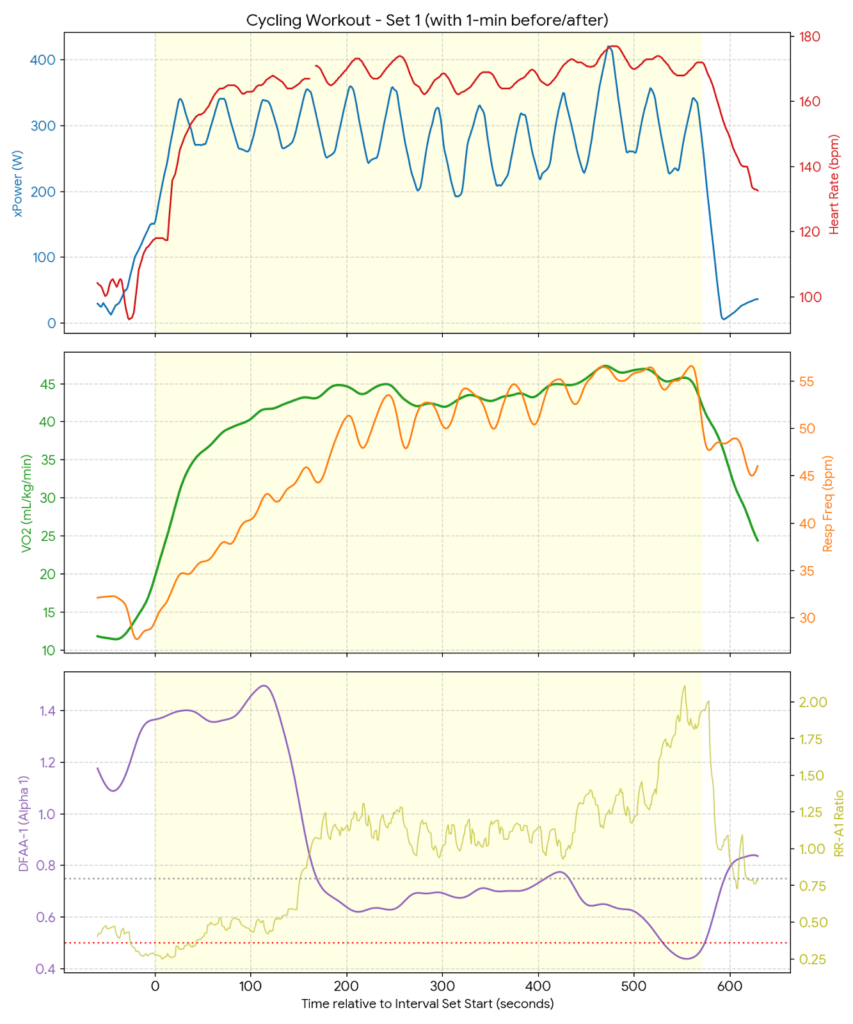
The Dissociation of the Internal and External Relays: Why a ‘Physiology First’ Approach Rules Ronnestad Intervals By Richard Wharton | Onlinebikecoach.com As coaches and hard-charging endurance athletes, we often fall into a trap. Specifically, we let external metrics dictate our training success. For example, we program an interval at a static target wattage. Next, we […]
The Power Illusion: Why Your Suspension Setup and HRV Dictate Real Speed
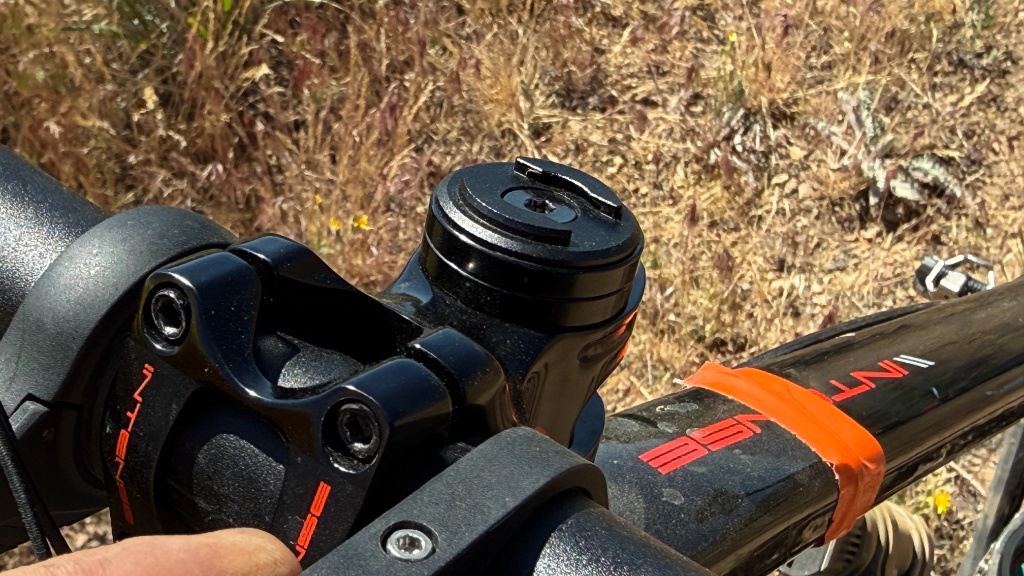
Chasing Ghosts on Peavine: The Ecology of Speed By Coach Richard Wharton • May 27, 2026 Heading out from the Peavine Mountain Hoge Road Trailhead to collect raw biometric and suspension telemetry across the Halo Loop. Part 1: Physiology-First Cycling Training, the Weight, and the Climb Metrics It has been months since I last pointed […]
The Autonomic Pivot: When Less Training Volume Equals Deeper Recovery
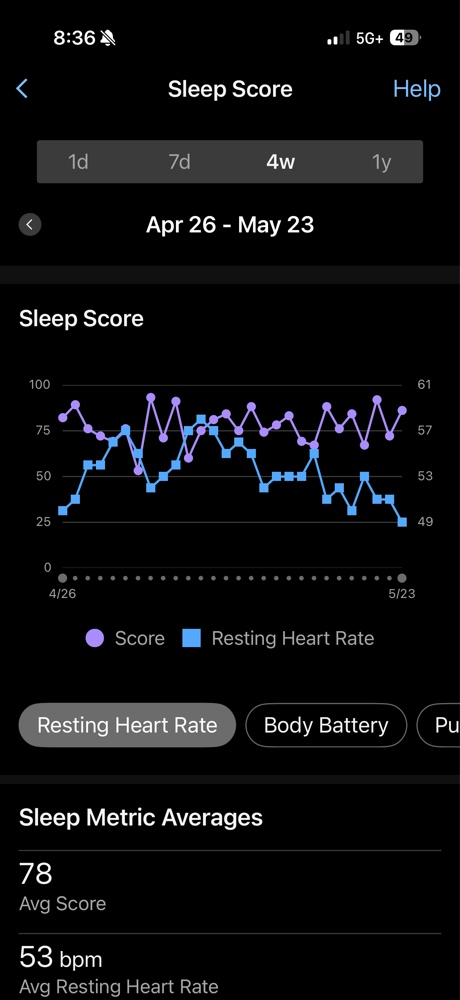
The Autonomic Pivot: When Less Training Volume Equals Deeper Recovery By Coach Richard Wharton, OBC | Published: May 25, 2026 Tracking my **Garmin HRV Stress** over the last few months has revealed a fascinating tug-of-war within my autonomic nervous system. Specifically, it shows exactly how shifting training workloads register on the body. Looking back at […]
Cracking the Code: My Physiology First Tabata VO2 Max Deep Dive
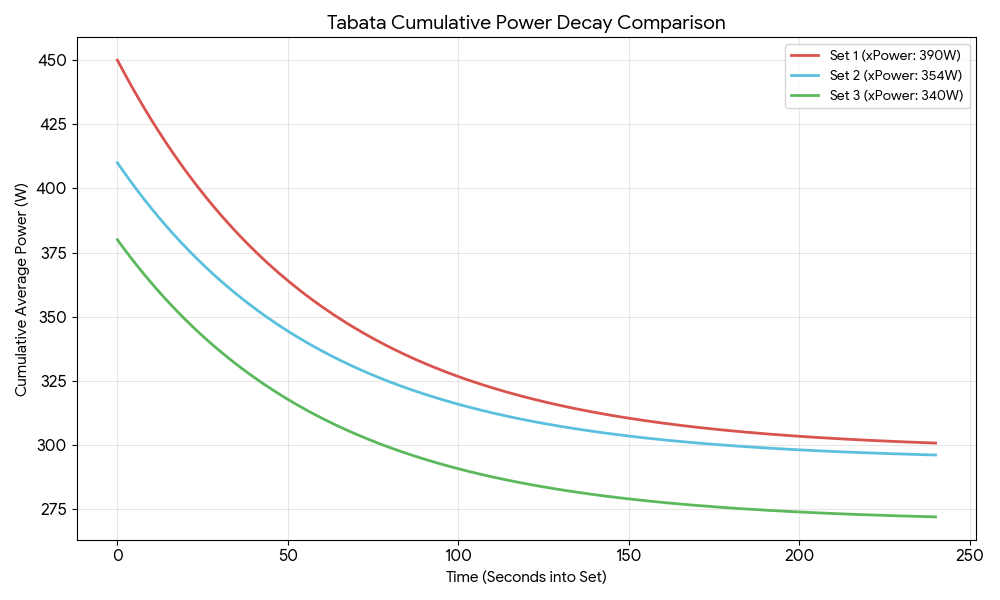
Cracking the Code: My Physiology and the Tabata Triple Threat Preface: The Metabolic Green Light vs. The CNS Red Light Before I even turned a pedal, the data was already telling a nuanced story. I woke up with a solid 83 sleep score and a body battery that recharged to 85—clear signals that my recovery […]
The Anatomy of a Good Ride; Physiology, Recovery, and the Portola Block
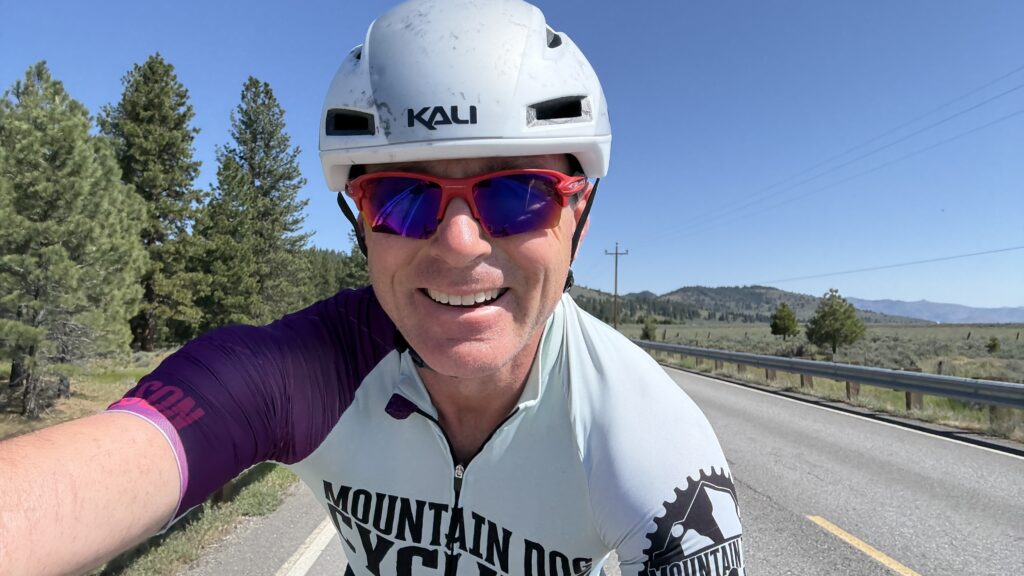
The Anatomy of a Good Ride: Physiology, Recovery, and the Portola Block I’ve always said that success on the bike isn’t a roll of the dice; it’s a deliberate convergence of external work and internal readiness. This week, I conducted a deep cycling physiology analysis of the Portola block to prove how disciplined recovery yields […]