
Threshold or VO2 Max? Decoding My Highest 30-Minute Power with AlphaHRV and SmO2
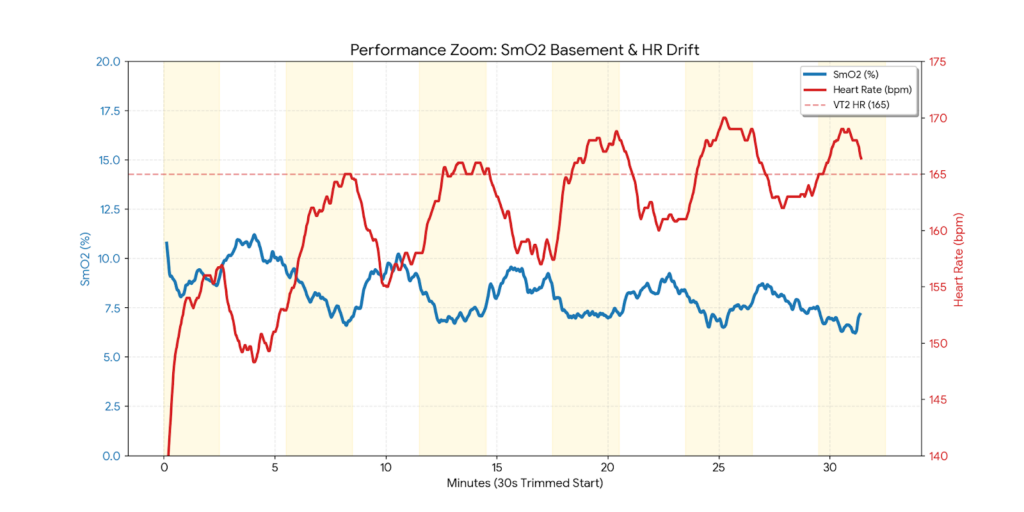
Training is rarely perfect, especially when I am wearing two hats at once. Today’s session was a 30-minute block of 3/3 Over-Unders—three minutes just above threshold wattage, followed by three minutes at 95% of FTP. I designed this session to challenge the metabolic limits of my oxidative system through focused SmO2 threshold training while staying […]
Garmin Recovery Stress: How a Late-Night Meal and Caffeine Killed My Body Battery
This is what happens when I drink caffeine late at night and eat a late, heavy meal. Hosting my first race as race director was a massive milestone, but doing it in the cold, misty trenches of a Nevada spring added a layer of “environmental tax” that a standard day just doesn’t have. When I […]
Garmin Guru Deep Dive: Decoding the Internal Response to 4-Minute VO2max Intervals
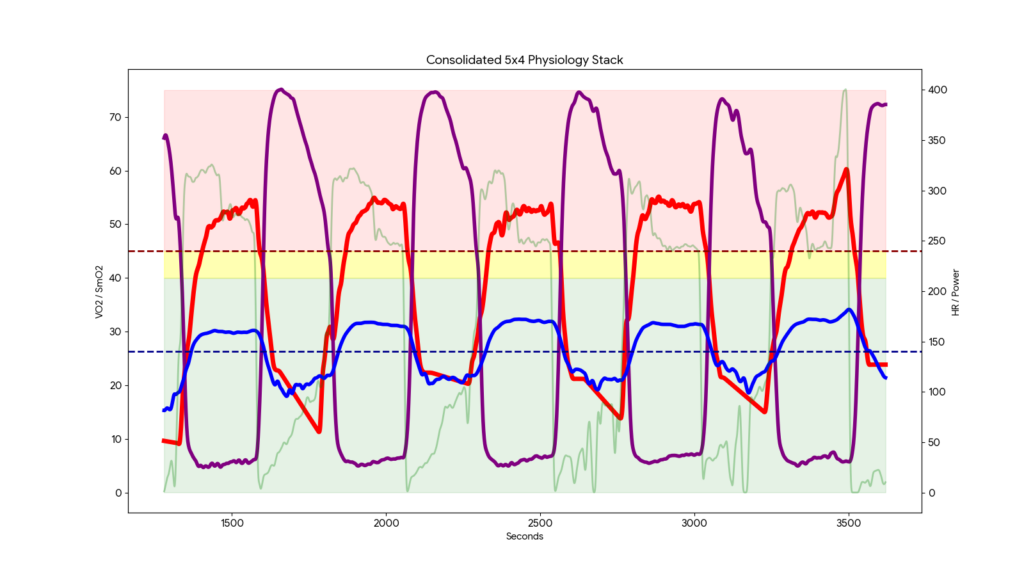
Garmin Guru Deep Dive: Decoding the Internal Response to 4-Minute VO2max Intervals Today’s session of 4-minute VO2max intervals was a masterclass in why I lead with physiology, not physics. As the Garmin Guru at Online Bike Coach, I’m constantly looking for the “truth” behind the numbers. Today, that truth was found in gas exchange and […]
The Happy Heart: Decoding My Garmin Sleep-Time Stress
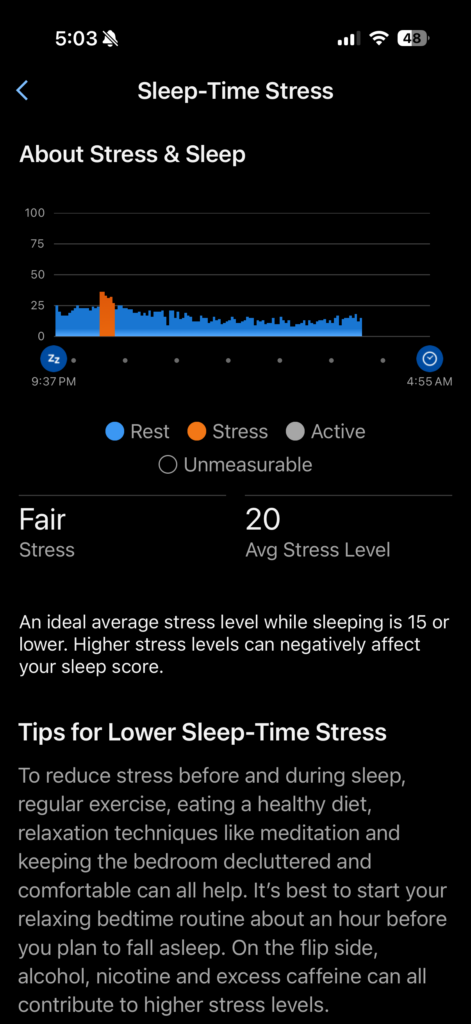
Tracking my sleep isn’t just about how long I was “out”; it’s about what my Autonomic Nervous System (ANS) was doing while the lights were off. As a coach who preaches Physiology First, the Garmin Sleep-Time Stress metric is one of the most honest looks into my recovery. Let’s break down the data from my […]
Sleep Score HRV Stress: The Yin and Yang of Recovery
The Yin and Yang of Recovery Physiology First Training | By Coach Richard Wharton Managing your Sleep Score HRV Stress data is the ultimate balancing act for any serious athlete. I’ve spent the last 48 hours in the “pain cave” building a trailer, manhandling heavy steel. When I pulled my metrics this morning, I saw […]
Garmin HRV Stress Balance: When Life Gets in the Way
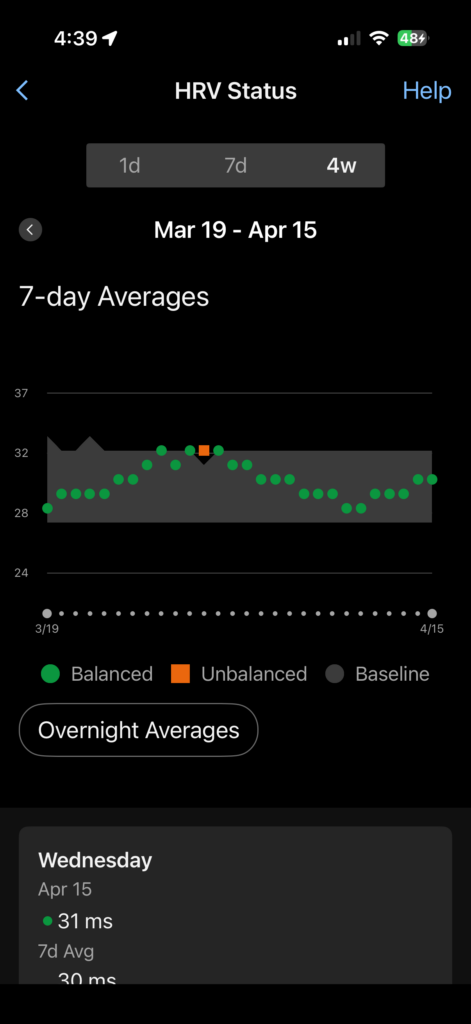
Garmin HRV Stress Balance: When Life Gets in the Way My training, recovery, and daily decisions start with Garmin HRV Stress Balance. I love the fantasy version of training: ride hard, lift heavy, eat clean, sleep eight hours, repeat. And with all the data my Garmin wearables give me — especially my older Garmin Fenix […]
The Garmin Ecosystem: Why Your Watch is More Important Than Your Power Meter
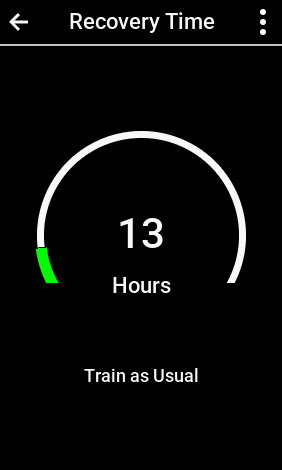
Garmin Recovery Time: Why Your Watch Beats Your Power Meter By The Garmin Guru | April 24, 2026 Understanding Garmin Recovery Time is essential for any athlete following a “Physiology First” approach. As a coach with over 20 years in the industry, I know that your bike computer is only half the story. To truly […]
Garmin Load Focus Decoded: Mastering Your 28-Day Metabolic Shadow
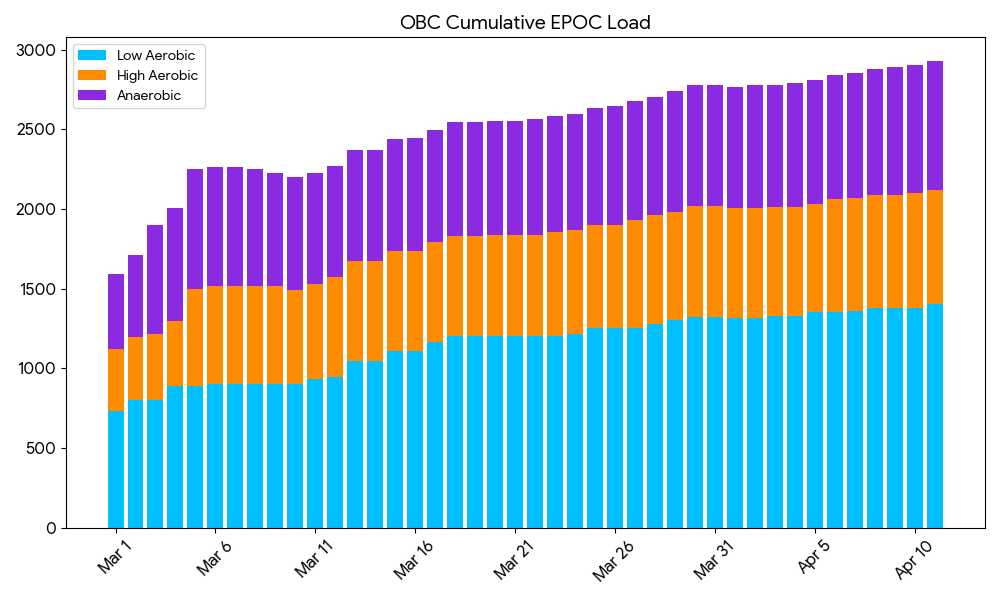
The Rolling Debt of Fitness: How I Use Garmin’s “Load Focus” to Build Better Athletes As a cycling coach with over 20 years of training history, I’ve seen every metric come and go. I used to believe “Power is King,” but my coaching philosophy has evolved into something far more precise: Physiology is King. Your […]
Decoding the Flux: How the Reverse Fibonacci Protocol Re-Maps Your Threshold
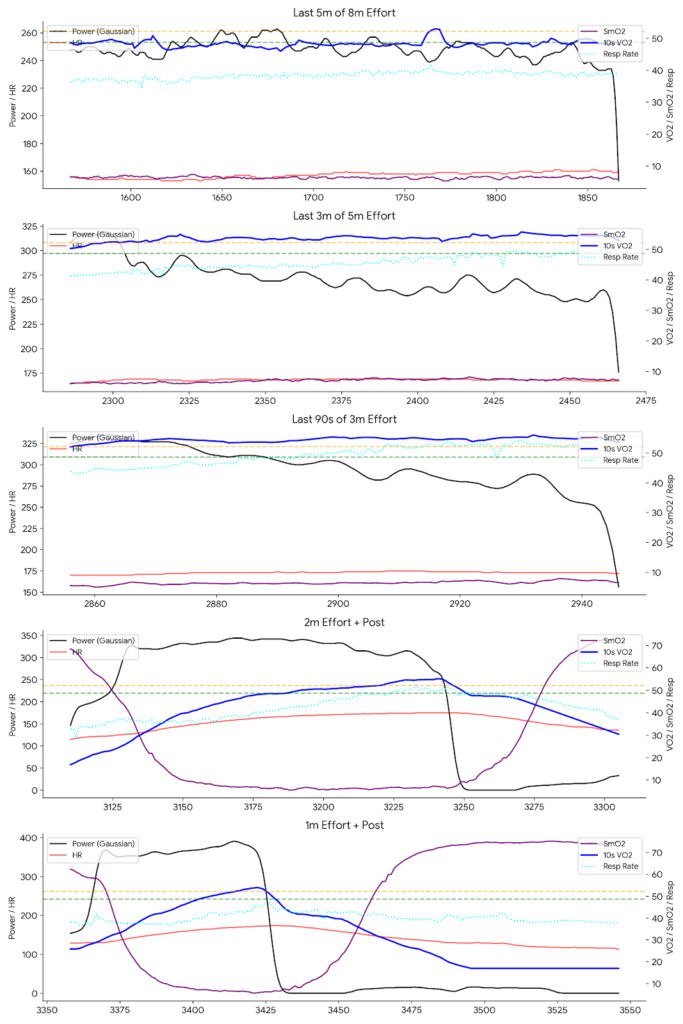
Beyond the Score The Garmin Guru Series | Decoding the Fast-Adapter | By OnlineBikeCoach.com Programming Reverse Fibonacci intervals is the ultimate way to shatter the lie of the “Static Zone” in high-performance cycling. We move past the idea that a single FTP test or a heart rate formula from a 1980s textbook is […]
The Garmin Guru’s Dilemma: When the Body Battery Says No (Even if the VO2 Says Yes)
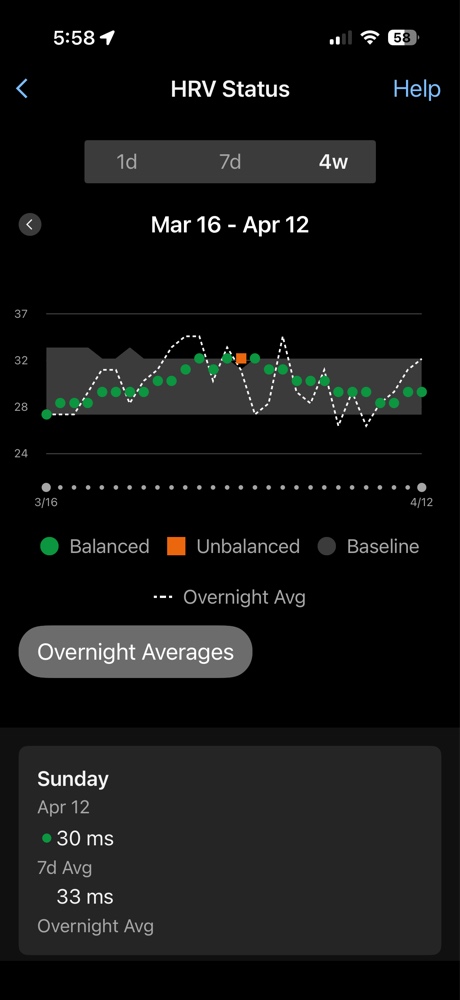
The Garmin Guru’s Dilemma: When the Body Battery Says No (Even if the VO2 Says Yes) Published on April 12, 2026 | By Online Bike Coach Garmin Body Battery recovery is the focus of today’s training update, especially as I trade my planned 90-minute indoor session for a cup of coffee and a view of […]