Breaking 4 Hours Around Lake Tahoe: A Deep Dive Into Garmin Connect Power Guide, Physics vs. Physiology, and the 285-Watt Threshold Mistake
Using the Garmin Connect Power Guide to pace an endurance ride around Lake Tahoe offers a fascinating study in cycling analytics. Indeed, this loop is one of the premier endurance efforts in the American West. It covers 71.6 miles and features over 4,400 feet of climbing. Furthermore, the operational altitude ranges between 6,220 and 7,100+ feet above sea level. My primary goal for Monday’s effort was simple: break 4 hours total elapsed time.
To pace the effort, I relied on the Garmin Connect Power Guide feature on my Edge 1040. This tool breaks a course into hundreds of micro-segments. Then, it prescribes real-time target wattages based on gradient, distance, and drag. As a result, I stopped the clock at 3:50:42 total elapsed time (3:46:59 moving time). Consequently, I comfortably achieved my sub-4 goal.
However, looking under the hood at the telemetry revealed a clear conflict between physics algorithms and real human physiology. Specifically, I compared Garmin Connect Power Guide power recommendations against internal multi-sensor data. This included DFA α1 tracked via the AlphaHRV ConnectIQ app and continuous Respiration Rate. In my OnlineBikeCoach endurance programming, I always prioritize real-time physiological response over rigid target numbers. Therefore, this ride perfectly illustrated why that principle matters.
1. Lake Tahoe Route, Weather, & Pacing Environment
- Course: Full Loop around Lake Tahoe (Clockwise)
- Distance: 71.6 miles (115.2 km)
- Total Elevation Gain: 4,454 ft (1,358 m)
- Base Elevation: 6,225 ft to 7,100+ ft (1,895 m to 2,160 m)
- Total Elapsed Time: 3:50:42 (Sub-4 Goal Accomplished!)
- Moving Time: 3:46:59
- Weather Conditions: Clear, mild, and ideal. Temperatures started at 64°F (18°C) in the morning and rose to 72°F (22°C) by the finish.
- Traffic Conditions: Urban sectors through South Lake Tahoe and Tahoe City introduced traffic lights, stop-and-go decelerations, and urban congestion.
2. Ingestion vs. Demands: Nutrition & Hydration Execution
The Garmin Edge 1040 Smart Nutrition engine prompted a target intake of roughly 1,000 calories across the 4-hour effort. Fortunately, my actual fueling execution matched this guidance almost perfectly:
- Hydration: 2 bottles of NBS Hydration (~100–160 kcal + electrolytes).
- Solid Fuel: 8 x 100-calorie Clif Bars (800 kcal).
- Total Intake: ~900–960 kcal (approx. 235–250 kcal/hr or ~60g+ carbs/hr).
- Total Expenditure: 2,398 kJ (~2,400 kcal burned).
Replenishing ~40% of total mechanical work kept glycogen stores well-protected. As we frequently test during live VQ Velocity virtual studio workouts, late-ride fatigue was not caused by a metabolic fueling breakdown or dehydration.
3. Garmin Connect Power Guide Segment Goals vs. My Reality
The Garmin Connect Power Guide slices the course into hundreds of target segments. On paper, it promised a steady “Tempo” pacing plan. In practice, however, my actual output fell roughly 11 to 15 Watts below recommended targets across the ride. Overall, I averaged 173.2 W versus a projected ~186 W average target.
Why did this gap happen?
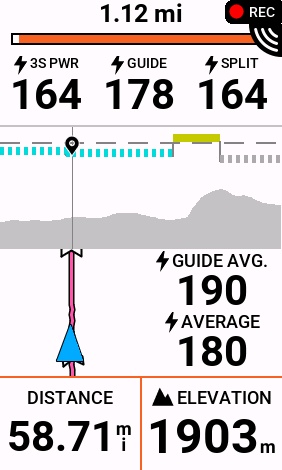
- Urban Traffic & Coasting Losses: The Garmin Connect Power Guide physics engine assumes non-stop progress. However, real-life traffic in urban sections forced 3.7 minutes of full stops. Additionally, I logged 1,078 seconds (~18 minutes) of zero-watt coasting through busy turns and lights.
- Descent Discrepancies: On steep downhill sections (< -3% grade), coasting accounted for 57.9% of descent time. In contrast, the Garmin Connect Power Guide often prescribes 140–160W on downhills where pedaling is unsafe or inefficient.
- Overestimated Climb Targets: The guide repeatedly asked for 250–270W on sustained climbs. Although I held a strong 236.2 W average on climbs (> 3% grade), matching those target numbers proved unsustainable.
4. Visualizing the Discrepancy: Garmin Connect Power Guide Target Deficit
To clearly see how the 285 W threshold setting impacted real-time execution, we can compare the Garmin Connect Power Guide target blocks against actual produced power. Smoothing the power data eliminates second-by-second stochastic noise:
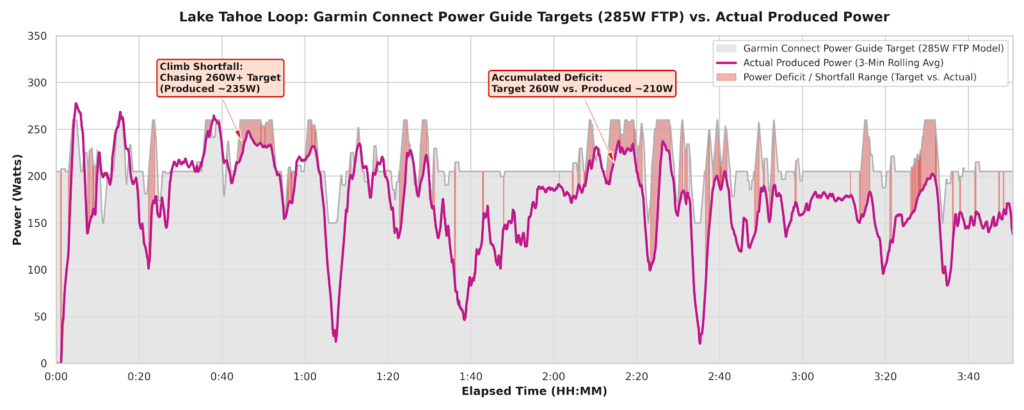
What the Garmin Connect Power Guide Chart Proves:
- The Climb Gap: On every major climb block, the Garmin Connect Power Guide prescribed targets exceeding 250 to 260 W.
- The High-Altitude Ceiling: My actual sustainable climb output capped out around 235 W early in the ride. Later, it dropped to 210 W on the final loops.
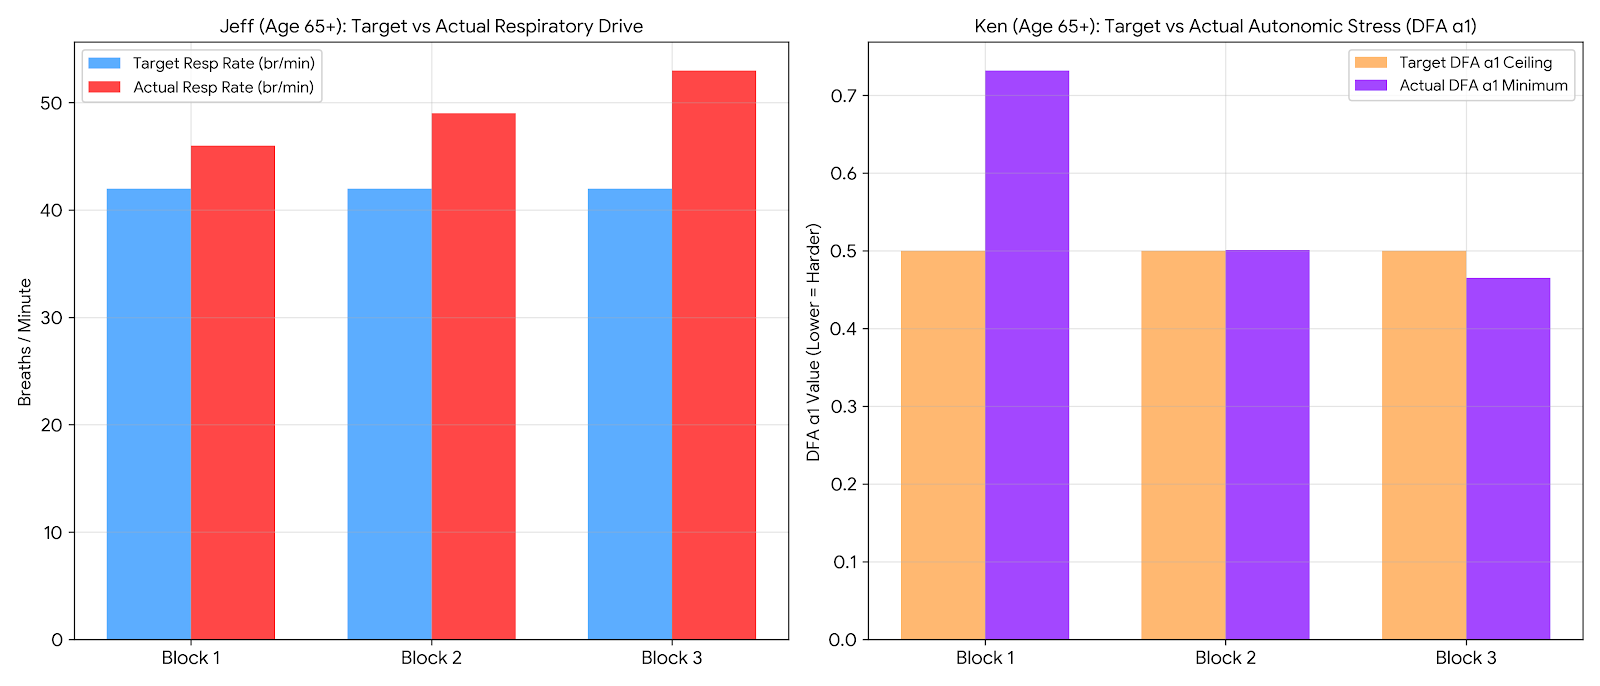
- The Cumulative Deficit: The red shaded gap represents the “unattainable wattage” created by entering a 285 W threshold baseline instead of a true 265 W altitude-adjusted baseline. Trying to chase those grey target blocks pushed my heart rate past VT2. Furthermore, it drove respiration rates above 40 br/min and caused my Garmin Performance Condition to crash from +2 down to -10.
5. Deconstructing Garmin Performance Condition: The Crash from +2 to -10
The Garmin Performance Condition metric provides a real-time assessment of operational efficiency. It analyzes heart rate, heart rate variability (HRV), and power output relative to baseline fitness.
At the start of the ride, my Edge 1040 flashed a +2 Garmin Performance Condition. This score indicated good readiness, fresh legs, and solid cardiovascular efficiency during the initial rollout.
However, over the course of the 115 km loop, my Garmin Performance Condition steadily deteriorated into a severe decline:
Minute  0 - 10:  +2.0  (Fresh start / optimal power-to-HR ratio)
Minute 30 - 40:  -4.0  (First heavy climb surges above 250W)
Minute 60:       -7.0  (Sustained effort past 7,000 ft elevation)
Minute 100:      -8.0  (Accumulated autonomic fatigue)
Minute 150:      -9.0  (Cardiac drift mounting; high RR)
Minute 220+:    -10.0  (Floor / Max algorithm penalty reached)
Key Factors Behind the Performance Condition Crash
- Severe Heart Rate Drift (Cardiac Drift): Early in the ride, producing ~210W required a manageable heart rate of ~150 bpm. As the ride progressed, however, producing that same ~200–210W pushed heart rate up into the 165–172 bpm range. Firstbeat Analytics interprets a rising heart rate at a constant power output as a collapse in mechanical efficiency. Therefore, it systematically lowers the Garmin Performance Condition score.
- The Hypoxic Altitude Penalty (> 6,200 ft): Because oxygen partial pressure (PO2) is reduced at Lake Tahoe, the heart must pump more volume per minute to deliver oxygen to working muscle tissue. Unfortunately, Garmin’s algorithm does not adjust its real-time baseline for acute altitude shifts. Consequently, it penalizes the rider for elevation-induced cardiovascular strain.
- High Autonomic & Respiratory Strain: Sustained periods above VT2 (DFA α1 < 0.50 for 35.9 minutes) suppressed parasympathetic tone. Furthermore, respiration averaged 36.2 breaths/min and exceeded 40 br/min for over 70 minutes. As a result, the systemic cost of breathing contributed to central fatigue and drove my score to the algorithm floor of -10.0.
6. Physics vs. Physiology: Ventilatory Thresholds & Garmin Connect “VO2 Max” Classification
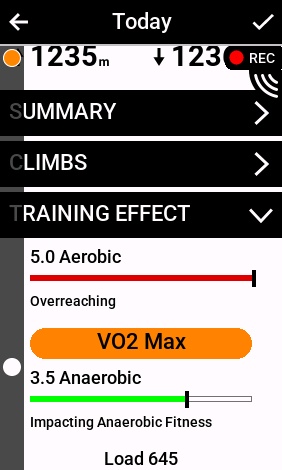
When I finished, Garmin Connect awarded the ride a “VO2 Max” Training Effect. This result completely shocked me because I intended to execute a steady “Tempo” effort.
The disconnect lies in how Garmin’s Firstbeat engine calculates Training Effect versus how the Garmin Connect Power Guide builds pacing:
Algorithm Modeling vs. Internal Human Telemetry
- The Physics View (Garmin Connect Power Guide): The algorithm models mass, gravity, slope, and rolling resistance to calculate required wattage. Thus, it assumes your cardiovascular system responds identically to 230W at sea level as it does at 7,000 feet.
- The Physiological Reality (AlphaHRV & Respiration):
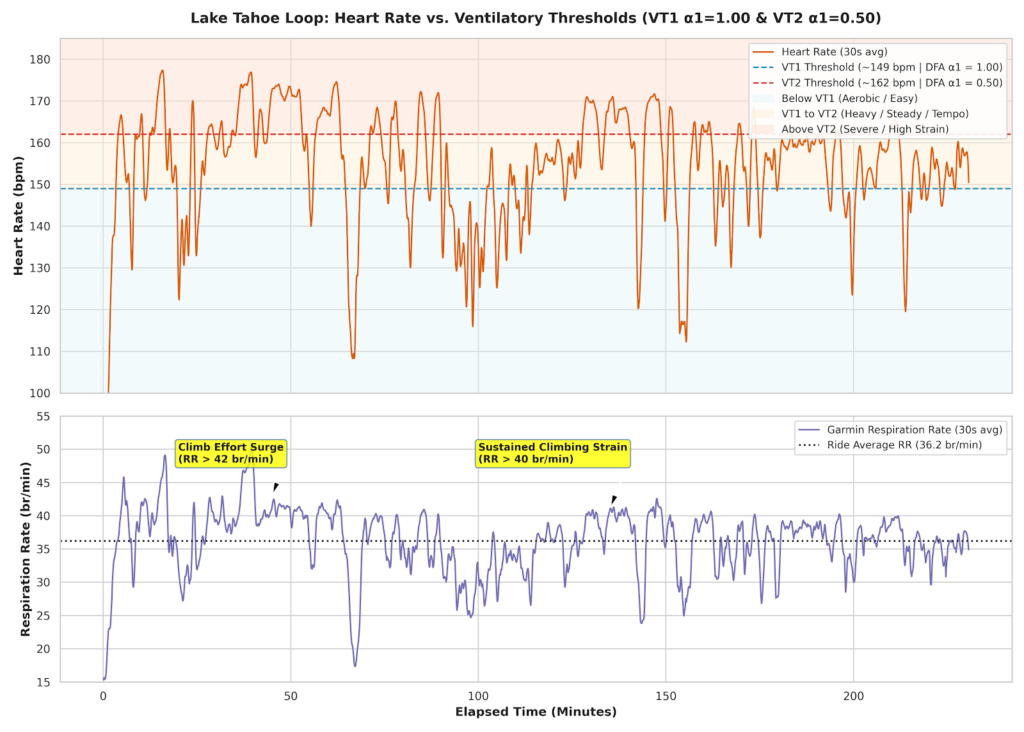
- Respiration Rate (RR): RR averaged an elevated 36.2 breaths/min across the entire ride. Specifically, I spent over 70 minutes with RR exceeding 40 br/min. High base elevation (6,200+ ft) drives hypoxic ventilatory response, elevating respiratory rate even during moderate efforts.
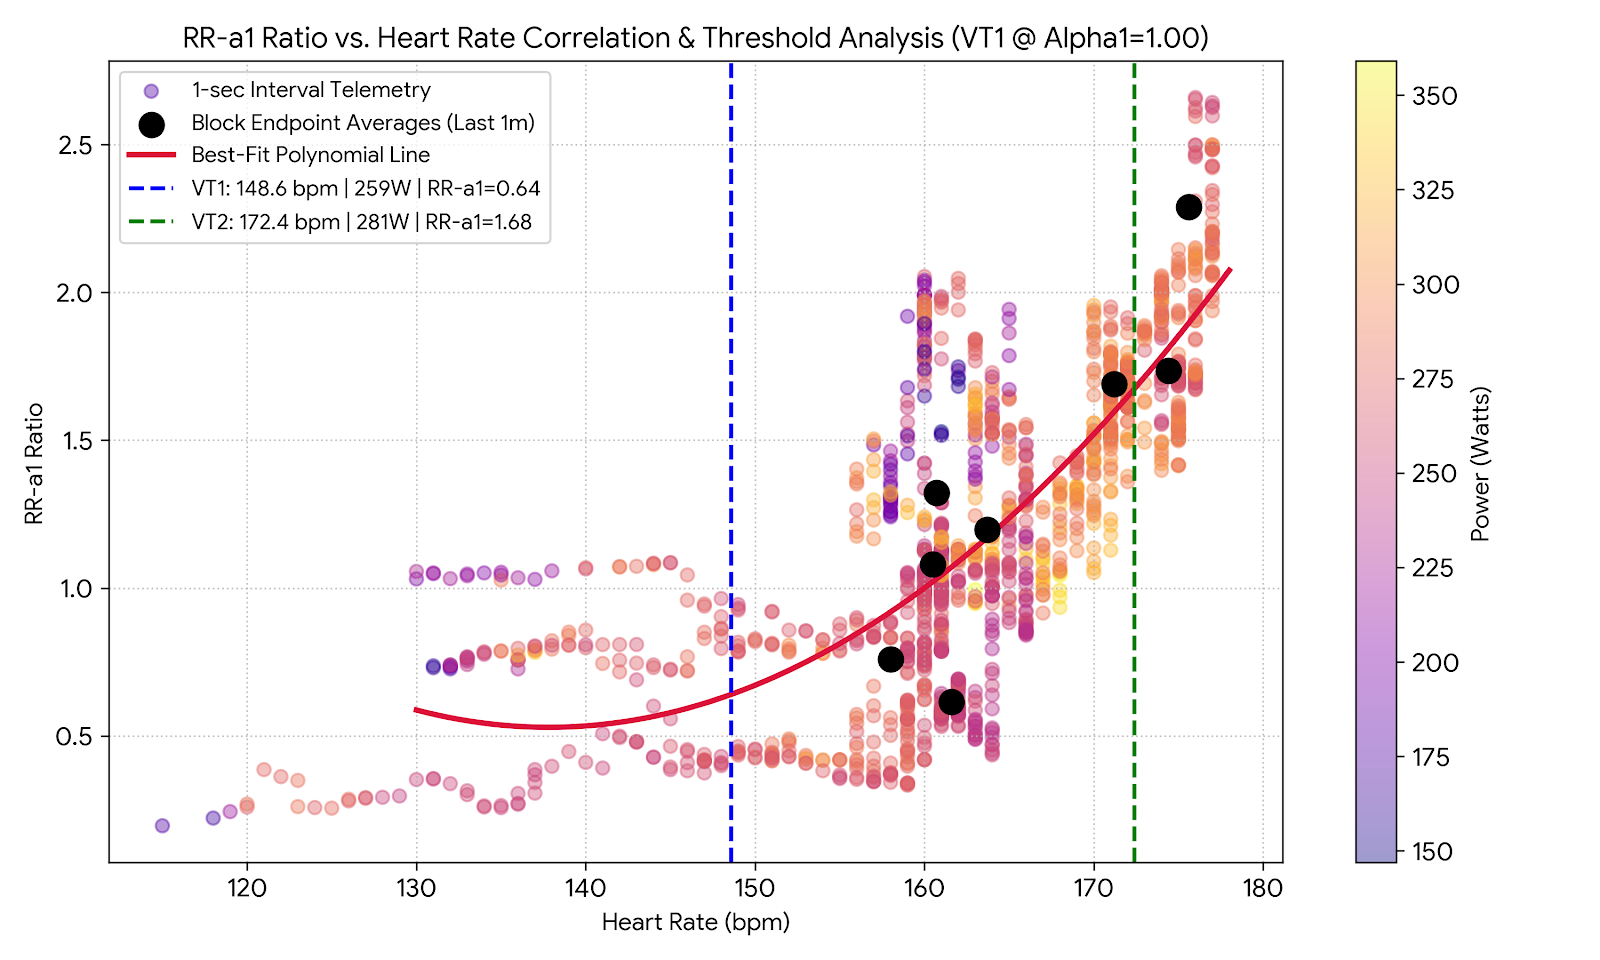
- DFA α1 Thresholds: Tracking real-time heart rate variability via the AlphaHRV ConnectIQ app and applying the threshold protocols pioneered by Dr. Bruce Rogers on Muscle Oxygen Training provided clear physiological boundaries. Setting VT1 (DFA α1 = 1.00) at 149 bpm showed that while 42.3% of the ride (1h 37m) was spent in Zone 2 Tempo (149–162 bpm), 31.4% (1h 12m) crossed above VT2 (DFA α1 < 0.50 / > 162 bpm).
- Garmin Real-Time Stamina: Stamina dropped from 100% down to 3% by the finish line, tracking alongside the Garmin Performance Condition drop.
| Zone / Threshold Range | Heart Rate Boundary | % of Ride Time | Avg Power | Avg Respiration Rate |
|---|---|---|---|---|
| Zone 1: Below VT1 (Easy / Aerobic Base) | < 149 bpm (DFA α1 > 1.00) | 26.0% (1h 00m) | 117.4 W | 30.8 br/min |
| Zone 2: VT1 to VT2 (Heavy / Steady Tempo) | 149 – 162 bpm (DFA α1: 0.50–1.00) | 42.3% (1h 37m) | 177.4 W | 36.5 br/min |
| Zone 3: Above VT2 (Severe / High Strain) | ≥ 162 bpm (DFA α1 < 0.50) | 31.4% (1h 12m) | 213.8 W | 40.2 br/min |
Garmin’s Firstbeat algorithm detected extended time spent above VT2, high heart rate drift, and high minute ventilation. Consequently, it triggered the high-intensity “VO2 Max” label in Garmin Connect.
7. The Root Cause: The 285W vs. 265W Threshold Mistake
The ultimate culprit behind the overambitious targets was user error in my profile settings. Specifically, I had left my Functional Threshold Power (FTP) set to 285 W on my Garmin device. However, my honest, realistic threshold at 5,250 ft (Reno base elevation) is 265 W.
Garmin Connect Power Guide Threshold Math:
- Garmin Connect Power Guide Assumptions at 285 W FTP:
- Prescribed Climb Targets (88–95% FTP): 251 – 271 W
- Prescribed Flat Targets (70–75% FTP): 200 – 214 W
- Target Overall Average (~0.70 IF): ~199.5 W
- The Altitude Penalty:
- Riding at Lake Tahoe (6,220–7,000+ ft) imposes an additional ~2.5% altitude penalty above Reno (5,250 ft).
- Therefore, my effective operational FTP around Lake Tahoe was actually ~258 W.
- The Resulting Strain:
- When the Garmin Connect Power Guide asked for 250–270W on climbs, it was asking for 97–105% of my actual Tahoe threshold.
- Trying to match those numbers forced me into 236.2W climb averages. This output represented 91.5% of my true altitude FTP. Pushing 91.5% of actual threshold on sustained climbs over a 4-hour ride crushed my Real-Time Stamina. As a result, it drove heart rate past VT2, crashed my Garmin Performance Condition, and penalized my estimated VO2 max (dropping it from 53 down to 49/50 in Garmin Connect).
8. Lessons for Pacing with Garmin Connect Power Guide
Stopping the clock at 3:50:42 and breaking 4 hours around Lake Tahoe was immensely satisfying. The fueling strategy was spot-on, the pacing was tough, and the execution proved that the engine is in great shape.
However, using the Garmin Connect Power Guide feature effectively in the future requires bridging the gap between algorithms and human physiology:
Key Takeaways for Enduro & Road Cyclists:
- Accurate FTP Inputs Are Mandatory: Never leave ego numbers or sea-level estimates in your Garmin profile. An error of 20W at the profile level cascades into every single segment recommendation provided by the Garmin Connect Power Guide.
- Factor in Elevation Penalties: If creating a Garmin Connect Power Guide for high-altitude courses (like Tahoe), manually lower your target FTP in the settings by 3–5% to account for lower partial oxygen pressure (PO2).
- Listen to Internal Telemetry Over Target Numbers: When your live DFA α1 drops below 0.50 or respiration spikes above 40 br/min on an endurance ride, back off—regardless of what the target wattage on the screen commands. For custom workout design and threshold analysis, explore my OnlineBikeCoach physiological consultation plans.
I’ve been a cycling coach since 1993, when I realized that there was no one available or willing to teach ME how to be a better bicyclist. My calling literally came from an Epiphany on a mountain top in Scotland in May of 1992. For better or for worse, it’s been my complete and sole passion to help people learn how to bicycle, and fall in love with it as much as I have. If you want a LIVE, REAL, PERSONAL coach who will help YOU, intrinsically, then click either button and let’s get started. Thank you.
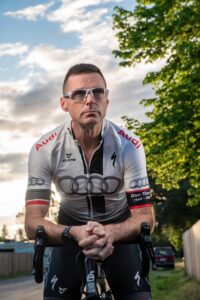
Coach Richard Wharton, leading the “Physiology First” charge since 1993.