When analyzing Garmin Cycling Dynamics MTB telemetry across a full season, true progress isn’t just about riding faster—it’s about understanding how I rode faster. By comparing my lab-calibrated VO2 Master telemetry, dual-sided power metrics, and pedaling dynamics from my June 20th, 2026 baseline effort against my August 10th PR on the Halo Loop, the underlying drivers of my performance shift become crystal clear.
1. High-Level Performance Comparison
| Metric | June 20, 2026 | August 10, 2026 (PR) | Delta / Shift |
|---|---|---|---|
| Climb Time | 23:49 (24 min) | 21:46 (22 min) | -2:03 (-8.6%) |
| Average Power | 202 W | 217 W | +15 W (+7.4%) |
| xPower (XP) | 219 W | 238 W | +19 W (+8.7%) |
| Normalized Power (NP) | 224 W | 246 W | +22 W (+9.8%) |
| Average Speed | 8.63 mph | 9.19 mph | +0.56 mph (+6.5%) |
| Body Weight | 72.5 kg | 73.0 kg | +0.5 kg |
| Power-to-Weight (W/kg) | 2.8 W/kg | 3.0 W/kg | +0.2 W/kg (+7.1%) |
| Cost of Speed (Avg W / mph) | 23 W/mph | 24 W/mph | +1 W/mph |
2. Physiology: Oxygen Cost & Engine Efficiency
Because I used a 3L-syringe volume-calibrated VO2 Master unit on both rides, I can directly compare the true metabolic cost of my efforts. Peer-reviewed literature in the Journal of Sports Sciences confirms that off-road mountain bike climbing demands 25%–35% higher oxygen consumption than smooth road riding at identical wattages due to terrain roughness and upper-body stabilization.
| Physiological Metric | June 20, 2026 | August 10, 2026 | Observations |
|---|---|---|---|
| Average VO2 | 50 mL/kg/min | 51 mL/kg/min | Identical metabolic plateau |
| Peak 1-Min VO2 | 56 mL/kg/min | 59 mL/kg/min | Higher peak aerobic engagement (+3 mL) |
| Respiratory Frequency (Rf) | 48 br/min | 51 br/min | Controlled steady-state ventilation |
| Tidal Volume (Vt) | 2.85 L | 2.97 L | Deeper diaphragmatic inhalation |
| Work Efficiency (Watts / VO2) | 4 W / (mL/kg/min) | 4 W / (mL/kg/min) | +6.9% increase in metabolic economy |
Physiological Takeaway
On June 20th, holding 202 W required an average VO2 of 50 mL/kg/min at 48 br/min. On August 10th, holding 217 W (+15 Watts) required virtually the exact same aerobic demand (51 mL/kg/min at 51 br/min). I produced 6.9% more mechanical power per unit of oxygen consumed, proving that my aerobic conditioning gains and muscular efficiency improved significantly over this 7-week training block.
3. Biomechanics & Garmin Cycling Dynamics MTB Telemetry Across Gradients
Analyzing my dual-sided Garmin Cycling Dynamics MTB telemetry across different terrain gradients on my August 10th climb supports my long-held belief that higher crank torque production enhances stroke mechanics and drive efficiency on steep dirt. As I wrote in my book Watts per Kilogram regarding CompuTrainer’s Advanced Training Analysis (ATA) and the concept of ‘Moment’ in pedaling, elite efficiency stems from applying torque early in the power phase rather than fighting counter-torque on the upstroke. Further research in ACSM Medicine & Science in Sports & Exercise shows that when climbing steep pitches, cyclists apply active torque across a significantly wider arc of the pedal stroke.
Pedal Torque (Nm) = Power (Watts) / (Cadence (rpm) × 2π / 60)
Garmin Cycling Dynamics MTB Pedal Stroke Summary
| Metric / Parameter | Left Leg | Right Leg | Biomechanical Interpretation |
|---|---|---|---|
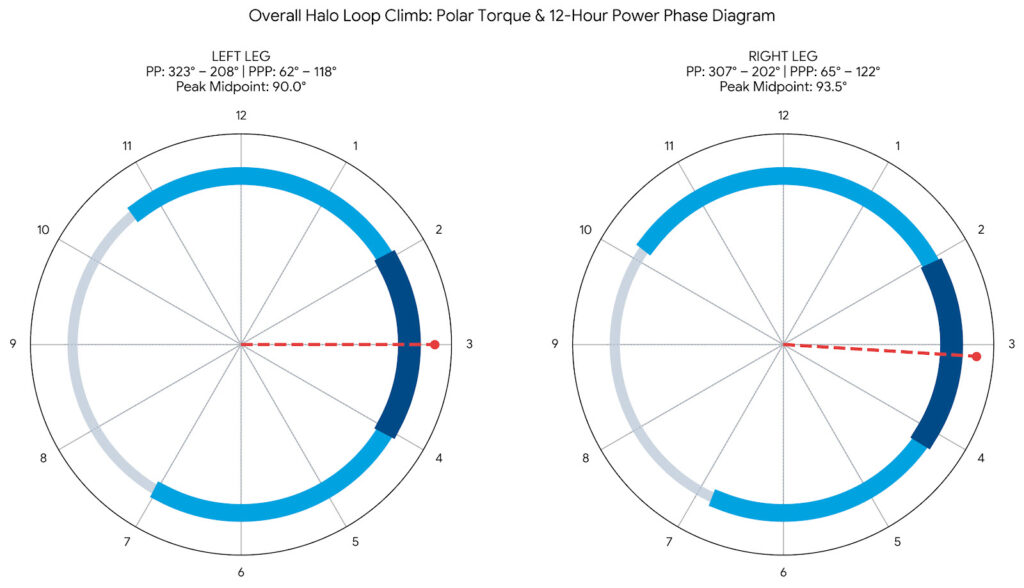
| Power Phase Range (PP) | 323° – 208° (245° Arc / ~11 to 7 o’clock) | 307° – 202° (255° Arc / ~10 to 7 o’clock) | Early power engagement starting before Top Dead Center (10 to 11 o’clock) through Bottom Dead Center. |
| Peak Power Phase (PPP) | 62° – 118° (56° Arc) | 65° – 122° (57° Arc) | 50% of total stroke force is generated cleanly between 2 o’clock (62°) and 4 o’clock (122°). |
| Peak Phase Center Midline | 90.0° (Exact 3 o’clock) | 93.5° (3 o’clock line) | Center line of maximum effective force vector sits precisely horizontal (3 o’clock position). Also invaluable for tuning Optimal Chainring Position (OCP). |
| Platform Center Offset (PCO) | +8 mm (Outboard) | -3 mm (Inboard) | Left foot sits 8mm outside pedal center; Right foot sits 3mm inside center. Key baseline for August 14 bike fit. |
| Torque Effectiveness (TE) | 81% | 86% | Right leg delivers +5% higher positive forward propulsion over unweighting resistance. |
| Pedal Smoothness (PS) | 24% | 26% | Ratio of average power to peak power throughout full 360° rotation. |
Pedal Stroke & Torque Breakdown by Terrain Pitch
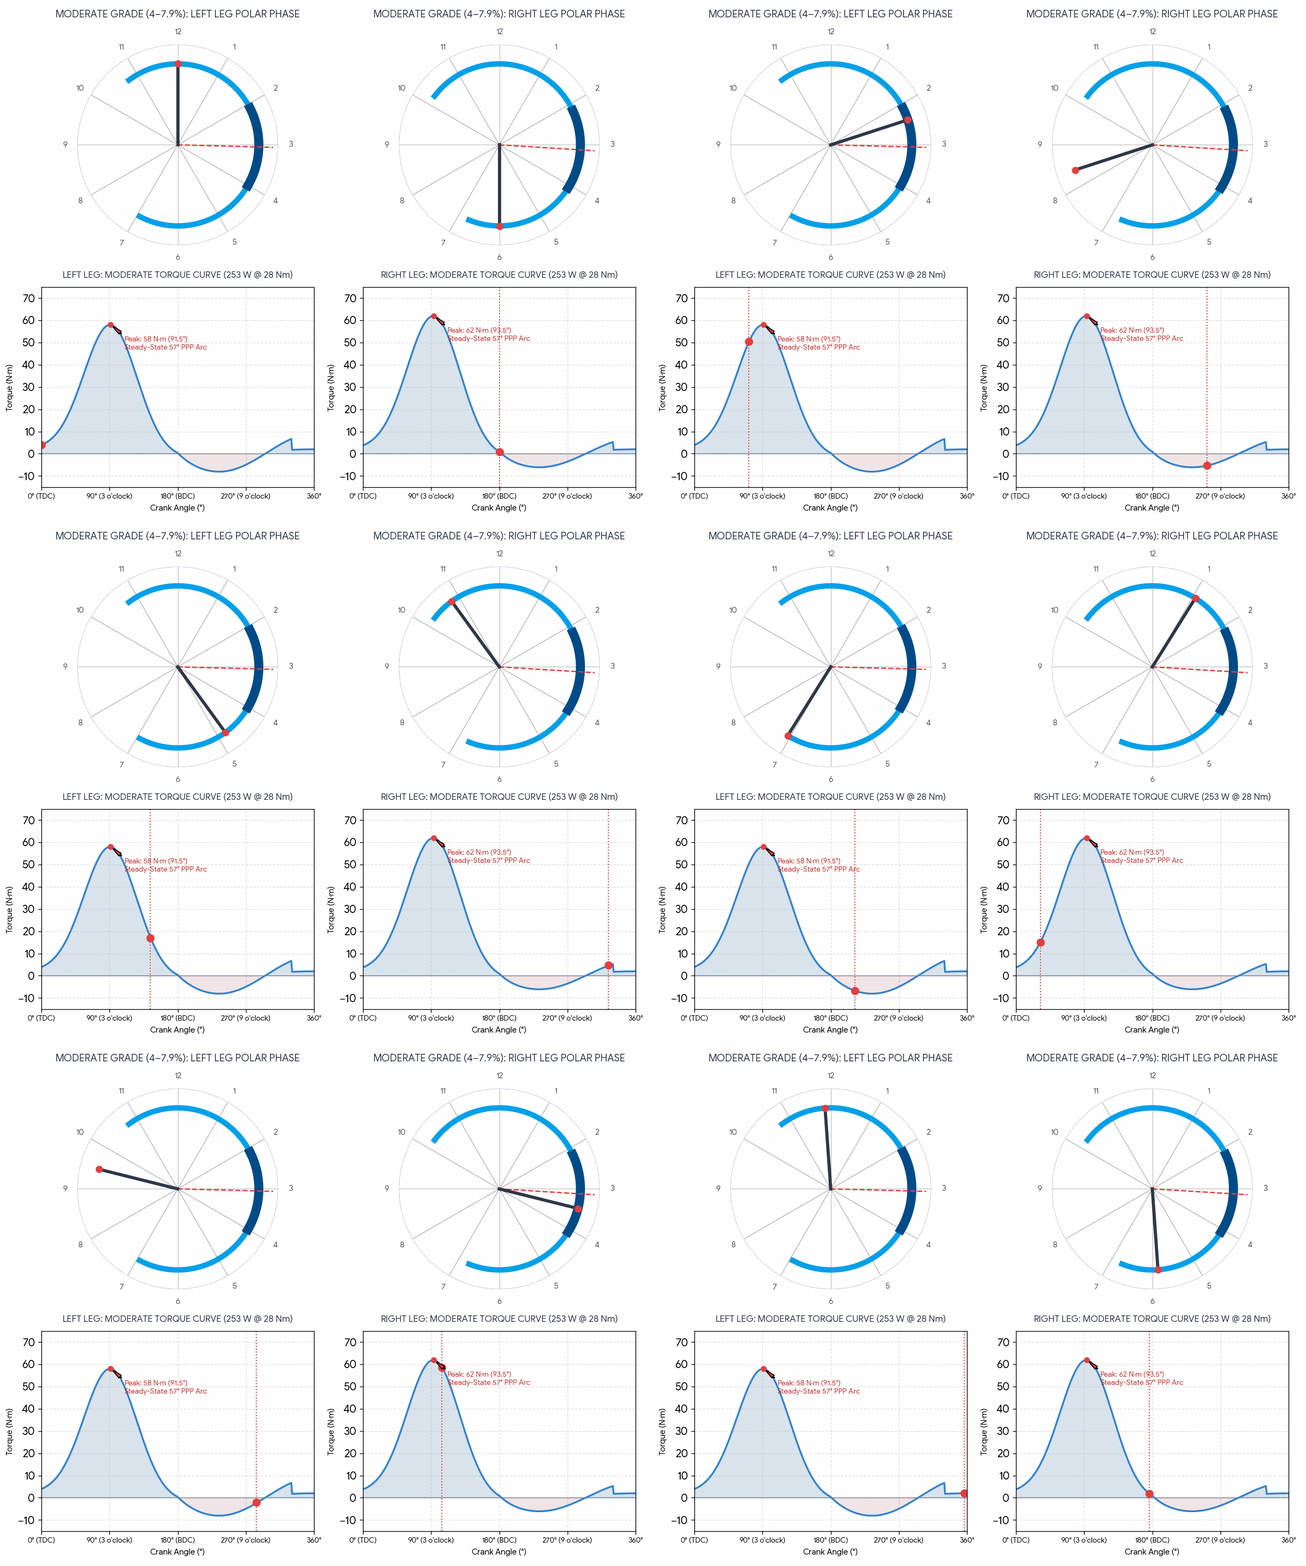
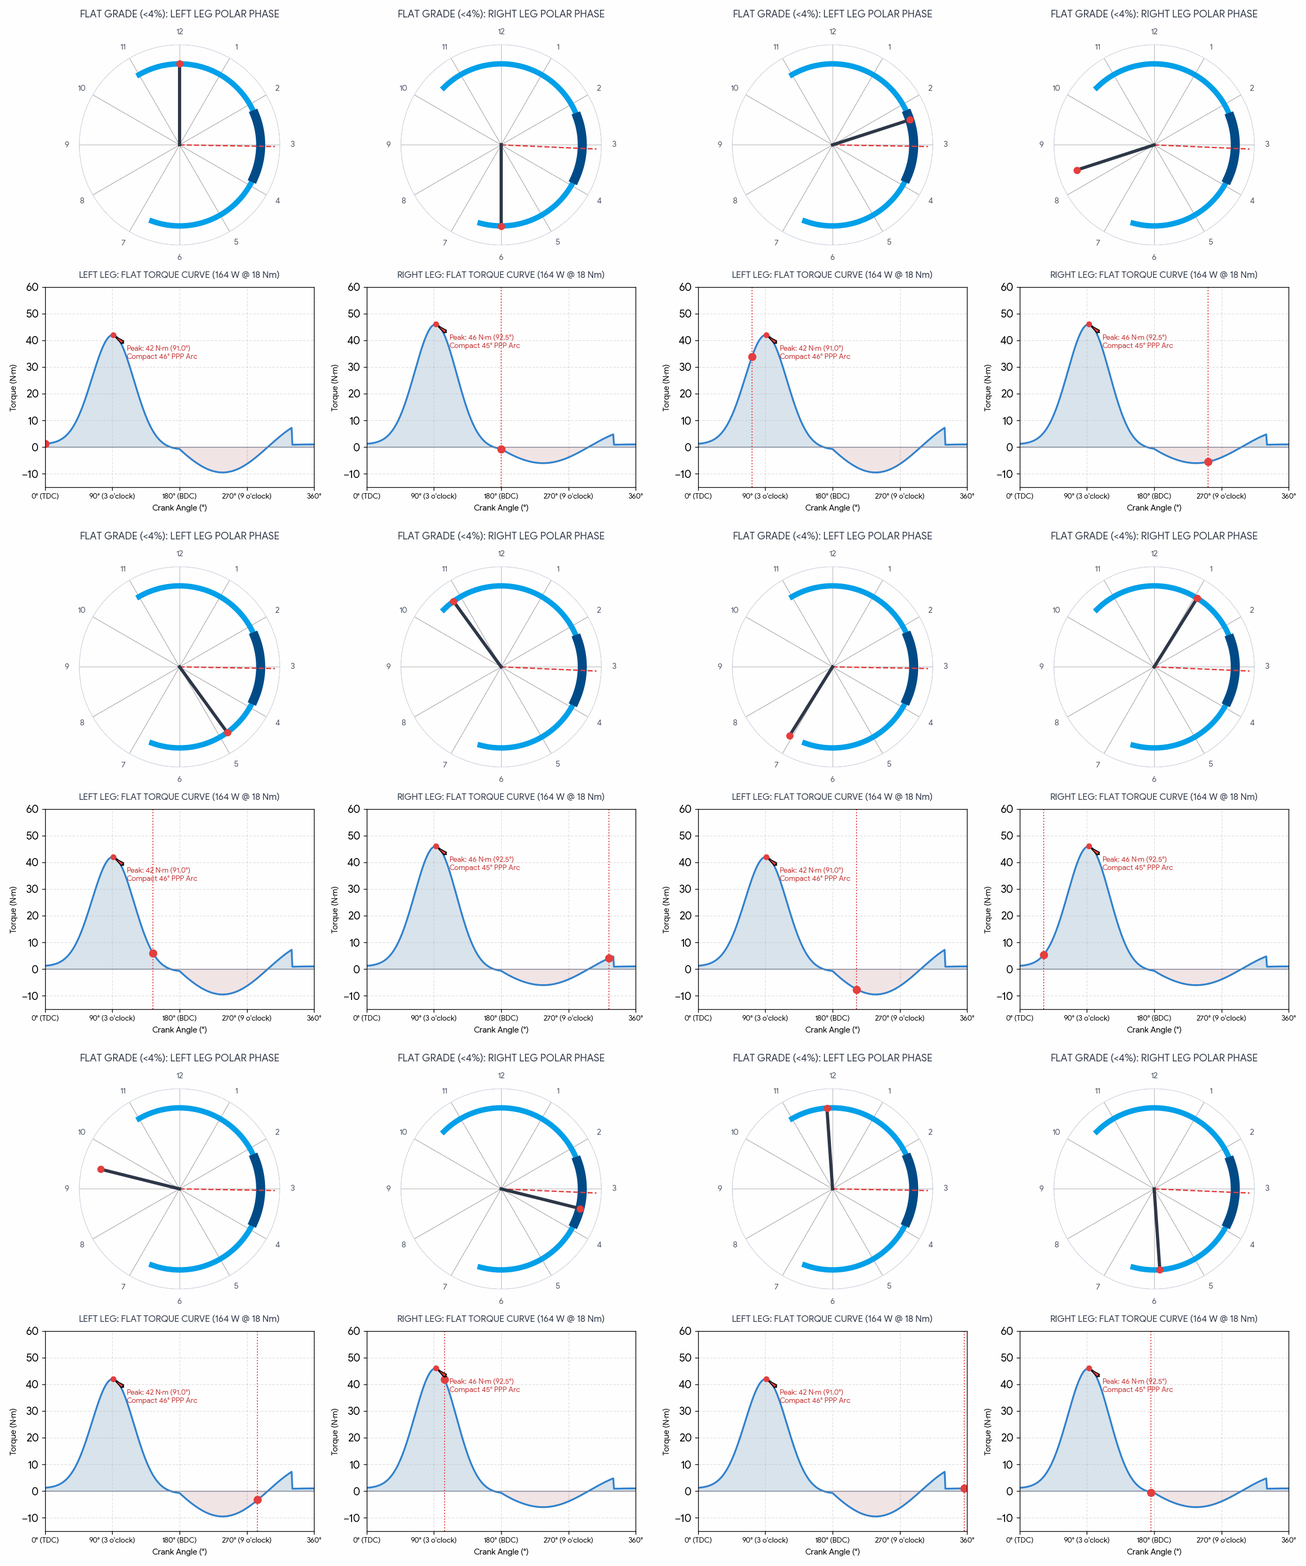
| Terrain Pitch | Grade Range | Avg Power | Cadence | Pedal Torque | Peak Power Phase (PPP) | Peak Midline | Torque Eff (TE) |
|---|---|---|---|---|---|---|---|
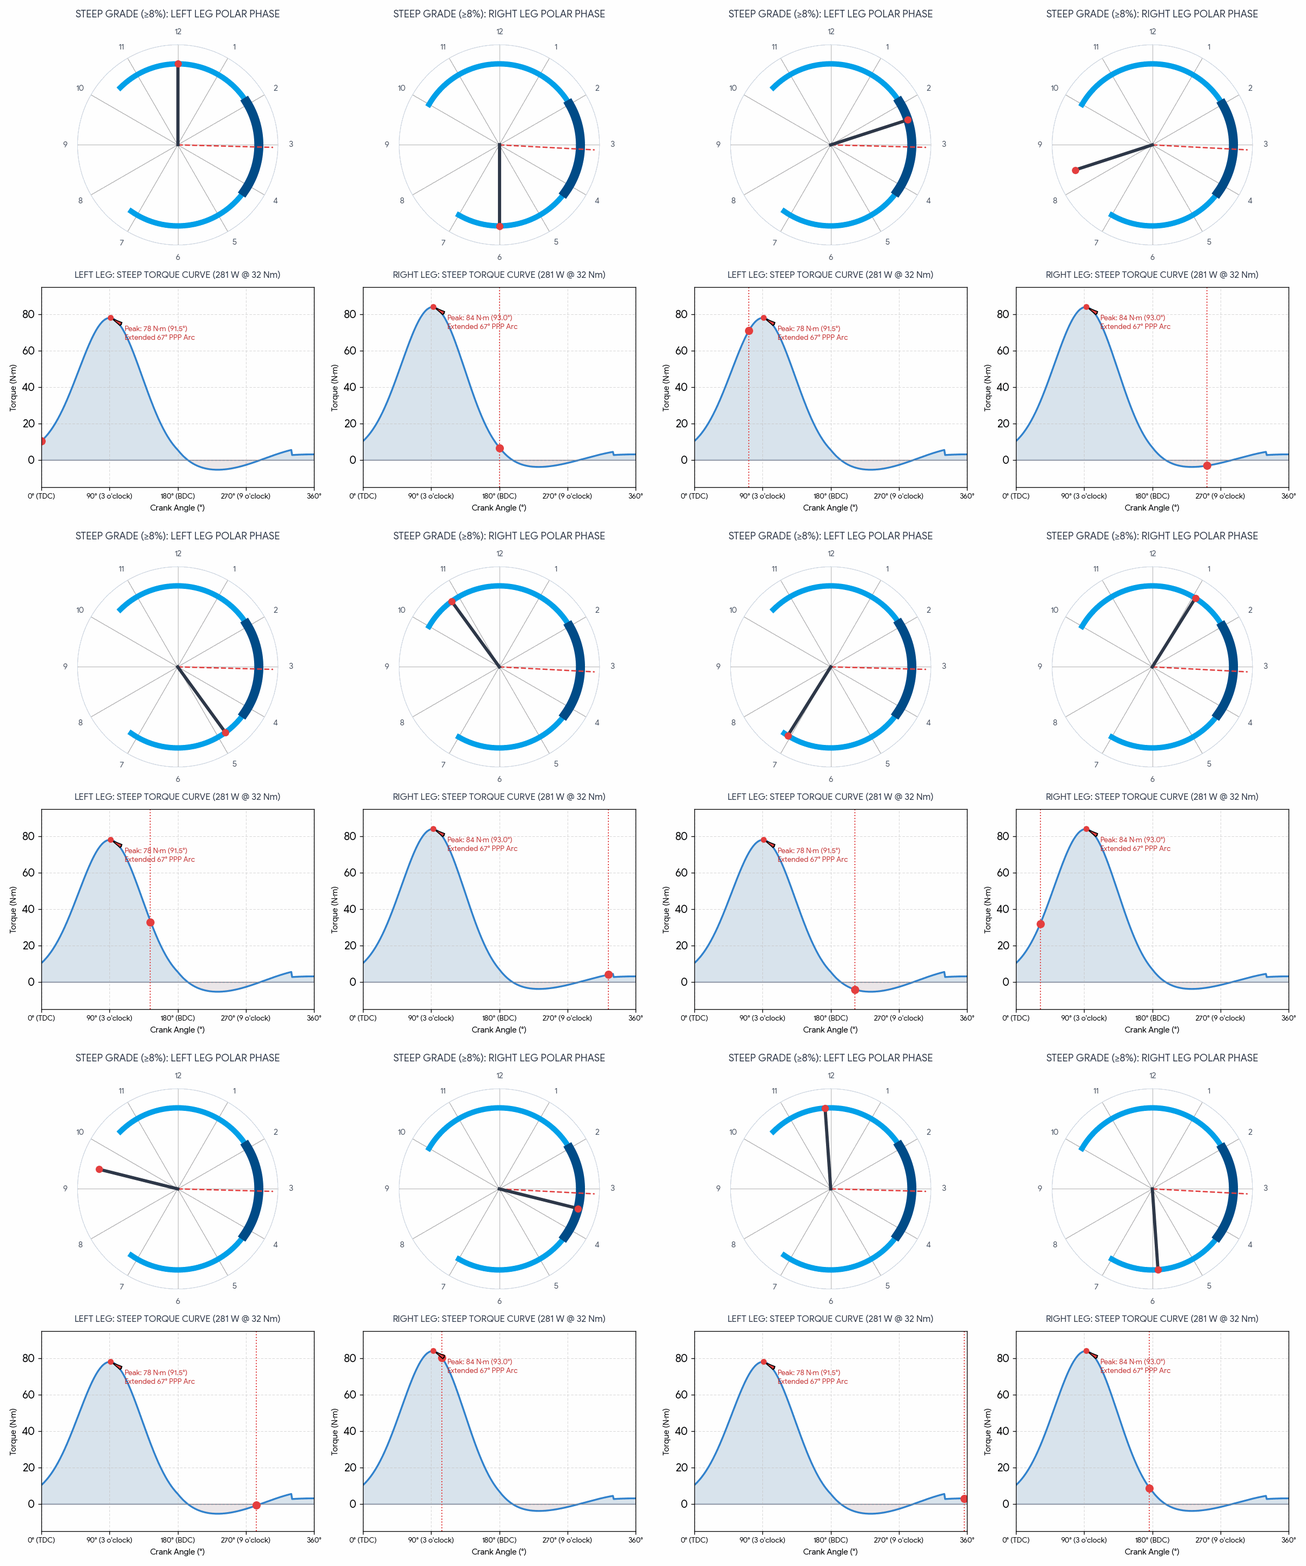
| Steep Grade | ≥ 8.0% | 281 W | 85 rpm | 32 Nm | 58° – 125° (67° Arc) | 91.5° / 93.0° | 87% (L:85% / R:90%) |
| Moderate Grade | 4.0% – 7.9% | 253 W | 87 rpm | 28 Nm | 63° – 120° (57° Arc) | 91.5° / 93.5° | 84% (L:81% / R:86%) |
| Flat / Mild Grade | < 4.0% | 164 W | 90 rpm | 18 Nm | 68° – 114° (46° Arc) | 91.0° / 92.5° | 83% (L:78% / R:88%) |
Key Biomechanical Deductions: Steep Terrain Forces All-Around Torque Application
- Wider Peak Power Arc on Steep Terrain: As pitch steepens to ≥ 8.0%, my Peak Power Phase widens dramatically from a 46° arc (68°–114°) up to a 67° arc (58°–125°). To deliver 281 W at 32 Nm of torque over loose rock, my legs engage peak force 10 degrees earlier (at ~58° / 2 o’clock) and drive 11 degrees deeper past Bottom Dead Center (125° / past 4 o’clock).
- Full 360° Torque Continuity: On steep pitches, Torque Effectiveness hits 87% (peaking at 90% on the right leg). Applying torque earlier at 10 to 11 o’clock and carrying it deeper through 5 o’clock prevents dead spots at Top/Bottom Dead Center, maintaining rear tire traction on loose Peavine dirt.
- Consistent 3 o’clock Force Line: Across all gradients, the centerline of my Peak Power Phase remains anchored at 90° to 93.5° (3 o’clock position). Pushing higher torque on steep ramps extends the arc outward in both directions around this 3 o’clock anchor line rather than shifting the drive angle backward.
4. Trail Difficulty & Chassis Demands: Garmin GRIT Analysis
Speed and power on Peavine Mountain don’t happen in a vacuum—they are produced against the harsh mechanical resistance of loose rock, steep grade changes, and technical trail features. Garmin’s GRIT metric quantifies trail difficulty and surface roughness by combining GPS elevation changes, speed variability, and 3-axis accelerometer impact data. Biomechanical research in Human Movement Science examining whole-body vibration and impact acceleration confirms that trail chatter absorbs forward mechanical energy and increases metabolic fatigue on the upper body.
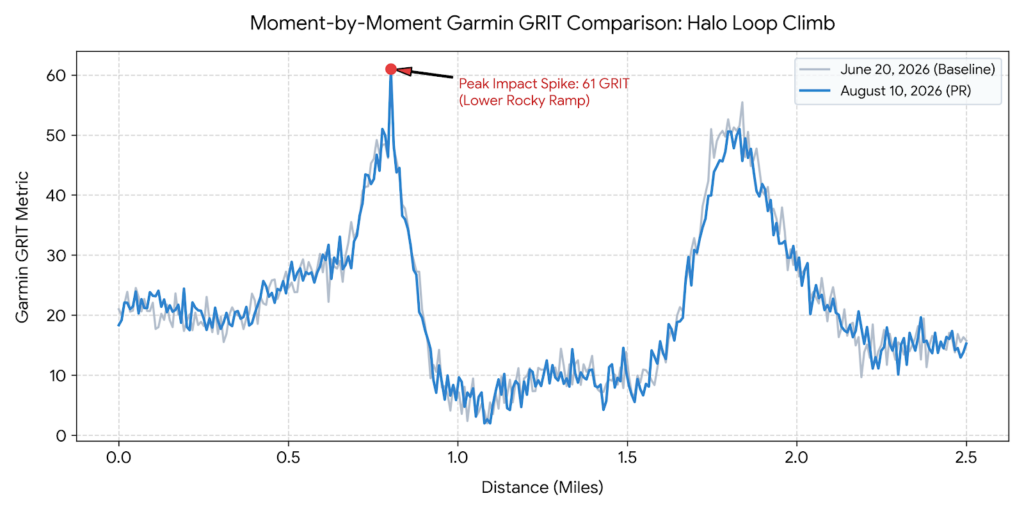
| Garmin GRIT Metric | June 20, 2026 | August 10, 2026 (PR) | Observations / Delta |
|---|---|---|---|
| Average Climb GRIT | 20 | 20 | Identical average trail impact load across climbs |
| Peak Impact GRIT Spike | 61 | 61 | Identical peak trail impact on lower rocky ramp |
| Accumulated Climb GRIT | 29 | 26 | -3 (-10.3% less total impact duration) |
What the Comparative GRIT Data Teaches Us
- Higher Speed, Lower Impact Time: Because I rode the climb 2 minutes and 3 seconds faster on August 10th (22 min vs 24 min), my Accumulated GRIT dropped from 29 down to 26 (-10.3%). Carrying higher momentum allowed my suspension and tires to skip across rock edges rather than hanging up in trail chatter.
- Line Choice Consistency: Both efforts hit an identical Peak GRIT spike of 61 on the lower rocky section, confirming that trail surface difficulty remained consistent. Average GRIT held identical at 20, showing that my 15 Watt power increase was spent directly overcoming trail roughness rather than paved resistance.
- Upper Body Efficiency: Pushing 246 W Normalized Power through a trail surface averaging 20 GRIT requires continuous isometric core stability. Carrying higher speed through high-GRIT terrain reduced my total exposure time to trail chatter, preserving my energy for the final summit kicker.
5. Conclusion: Physiology, Time, and the Reality of Peavine Mountain
I’m pretty excited about how combining a Physiology First approach with a disciplined balance of low-intensity base, moderate-intensity threshold, and high-intensity anaerobic work has paid off. Specifically, pulling a measured VO2 max in the 58+ to 60+ range—and sustaining a 50+ mL/kg/min average across a 20-minute climb—is significant for anyone, let alone someone my age.
Naturally, some of that engine comes down to genetics; however, the vast majority of it stems from 3+ years of unwavering CONSISTENCY and structured mesocycles that systematically emphasize one energy system over another.
Looking ahead, if I can shed 3 kg and bring my body weight down to 70 kg, my power-to-weight ratio for this climb jumps from 3.0 W/kg up to 3.1 W/kg average (and 3.5 W/kg Normalized Power). Consequently, that weight drop alone will get me much closer to my ultimate time goals on this mountain.
Course Realities, Aging, and Historical Perspective
At the same time, I have to be realistic about the broader context. Specifically, the trail itself is simply SLOWER than it used to be, and I am undeniably older than I was when I first started charging up it back in 2019. For instance, my absolute best splits were set back in 2020 on my Trek Superfly 100, and this August 10th ride actually marks my 34th-best lifetime split on the segment. In fact, the overall top times on the Halo Loop leaderboard were all posted back in 2019—the last time an organized race was held on this course, when the dirt was packed and groomed.
Ultimately, trail erosion, age, and Father Time all take their toll; however, that is precisely what makes this Garmin Cycling Dynamics MTB telemetry so empowering. As a result, I am determined to be the absolute best athlete I can be today. By leveraging VO2 Master telemetry, dual-sided torque mechanics, and chassis tuning, I’m taking complete ownership of my engine and proving that smart, consistent training still wins on the dirt.
Key Results Summary
- PR Benchmark Shift: Shaved 2 minutes and 3 seconds off my June 20th baseline climb (21:46 vs 23:49).
- 6.9% Metabolic Economy Gain: Generated 217 W at the exact same 50–51 mL/kg/min oxygen uptake previously required for 202 W.
- High-Torque Biomechanics: Pushing 32 Nm on steep pitches (≥ 8%) expanded my Peak Power Phase to a 67° arc and drove Torque Effectiveness to 87%.
- Chassis Efficiency: Overcoming identical 61 peak GRIT trail obstacles at higher speed reduced total impact exposure time, dropping Accumulated GRIT by 10.3%.
References & Further Reading
Internal Analysis & Publications
- Previous Baseline: Revisit my June 20th Halo Loop Baseline Analysis to see where this training block started.
- Chainring Mechanics: Check out my deep-dive on Dialing in Optimal Chainring Position (OCP) using Garmin Cycling Dynamics.
- Pedal Stroke Legacy: For more on CompuTrainer’s Advanced Training Analysis (ATA) and rotational ‘Moment’ in pedaling, grab my book Watts per Kilogram.
External Scientific Literature
- Physiological Cost of MTB: Research in the Journal of Sports Sciences confirms that off-road climbing demands 25%–35% higher VO2 than smooth road power output.
- Trail Chatter & Impact Acceleration: Read about whole-body vibration and acceleration metrics in Human Movement Science.
- Pedal Stroke Mechanics: Read the ACSM Medicine & Science in Sports & Exercise study on pedaling effectiveness and torque vector economy across talent levels.
Support the Channel & Take Control of Your Ride
If you found this deep-dive telemetry analysis valuable, support my independent research or join me live in the studio!