Cracking the Code: My Physiology First Tabata VO2 Max Deep Dive
Cracking the Code: My Physiology and the Tabata Triple Threat
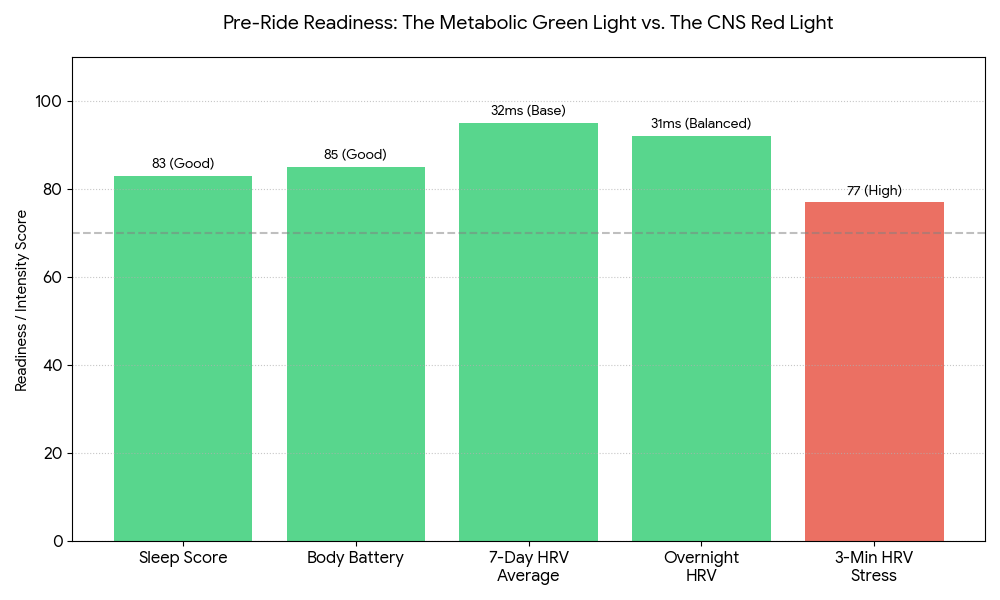
Preface: The Metabolic Green Light vs. The CNS Red Light
Before I even turned a pedal, the data was already telling a nuanced story. I woke up with a solid 83 sleep score and a body battery that recharged to 85—clear signals that my recovery was on track. My overnight HRV metrics were equally promising, with my specific overnight value of 31ms sitting comfortably against my 32ms 7-day average. For most, this would be a total green light for a Physiology First Tabata VO2 Max session.
Most of my overnight metrics were ‘Green’. HRV Stress, however, was a ‘Red Light’ warning. The 3-minute HRV Stress test flagged high CNS fatigue at a score of 77 before the sets began.
However, the “code” threw me a curveball. While the overnight autonomic data looked great, the targeted 3-minute HRV Stress test came back as a 77 (High Stress). It was a classic “Garmin Guru” moment: the metabolic engine was fueled and ready, but the central nervous system was still flagging the massive recovery cost of my recent training block. That said… I elected to ride!
Part 1: Tabata and the Halo Loop
In the world of high-intensity interval training, the word “Tabata” is often thrown around with reckless abandon. It has become a generic marketing term for any circuit class with short rests. But for my Physiology First Tabata VO2 Max approach, the original 1996 research by Dr. Izumi Tabata is a clinical masterclass in biological extremity—one that is rarely replicated and even more rarely understood.
The Pioneer of Intensity: Dr. Izumi Tabata’s clinical validation of the “20-on, 10-off” method proved that four minutes of all-out effort could outperform an hour of steady-state work.
The original protocol was deceptively simple: 20 seconds of “all-out” effort at 170% of VO2 max, followed by 10 seconds of rest, repeated 8 times. Total work time: 4 minutes. In Dr. Tabata’s study, elite athletes performed exactly one set per day, five days a week. That single, four-minute dose was enough to produce a 14% increase in VO2 max and a 28% boost in anaerobic capacity in just six weeks.
The science suggests that one set is the “full dose.” Doing more provides no added benefit while exponentially increasing the recovery cost through muscle microtrauma and massive cortisol spikes. Yet, in this session, I tackled three full sets. Why? Because I am in a specific training block for the Halo Loop climbs on Peavine Mountain. Those punchy Nevada ascents demand the ability to produce massive power while the oxygen tank is empty. This wasn’t just a workout; it was a precision strike on my ceiling.
Part 2: The Wharton Warmup – Mastering Physiology First Tabata VO2 Max Readiness
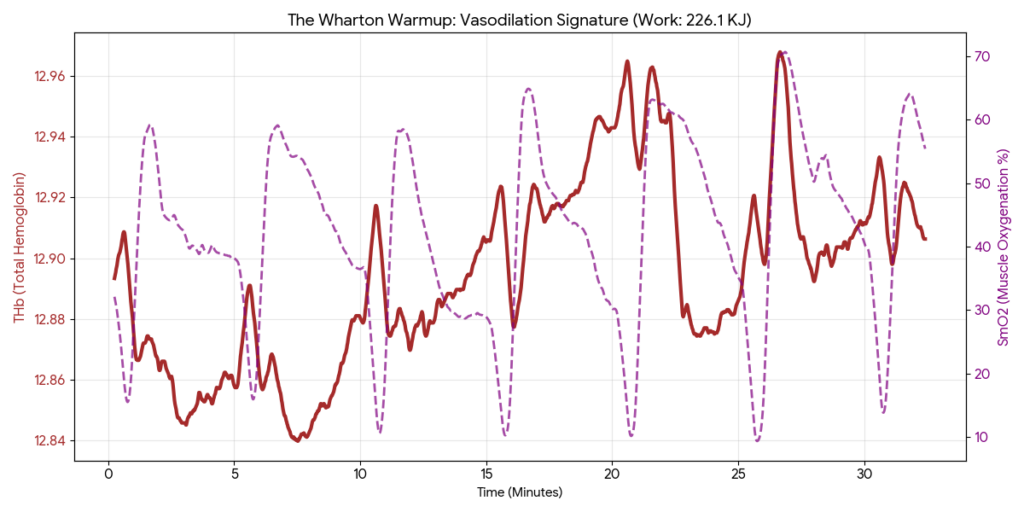
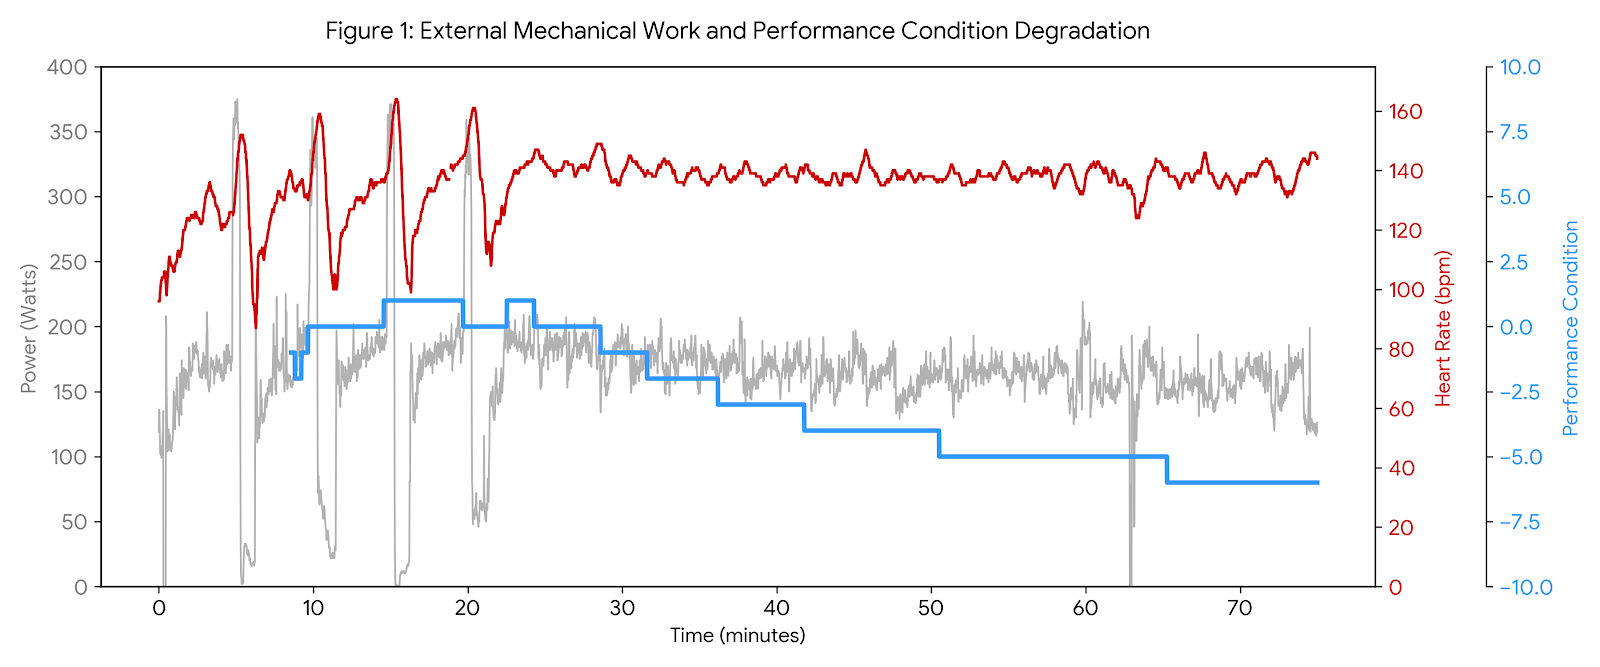
At Online Bike Coach, I emphasize that you never jump into a 170% VO2 max effort with cold legs. I start with my trademark Wharton Warmup, which isn’t just about “getting loose”—it’s a deliberate physiological priming phase. For this session, I put in 226.1 KJ of work over roughly 32 minutes just to prepare the engine.
The Staircase of Readiness: In this 32-minute warmup, THb and Max Saturation rise with every recovery period, confirming that the “valves are open” and the muscle is primed for VO2 Max intensity.
The ThB/Saturation Connection: As I progress through the warmup, I’m looking for a very specific signature in the Moxy data. Notice in the chart above how my THb (Total Hemoglobin) and Max Saturation (SmO2 peaks) both trend upward. This represents the “opening of the valves.” By the 25-minute mark, these values begin to stabilize. This stabilization tells me that I have achieved maximum vasodilation—the local blood vessels in my quad are fully dilated, and my blood volume is optimized to move oxygen the moment the intervals start.
Moxy vs. HR and HRV: This is where the Moxy Monitor proves its worth over and above traditional Heart Rate or even HRV. While HR is a lagging indicator of systemic effort and HRV tells me about my nervous system’s stress, SmO2 and THb tell me what is happening locally in the working muscle. If I had skipped this 226 KJ of priming, my first Physiology First Tabata VO2 Max set would have been a metabolic train wreck as my muscles struggled to find oxygen that the system wasn’t yet ready to deliver.
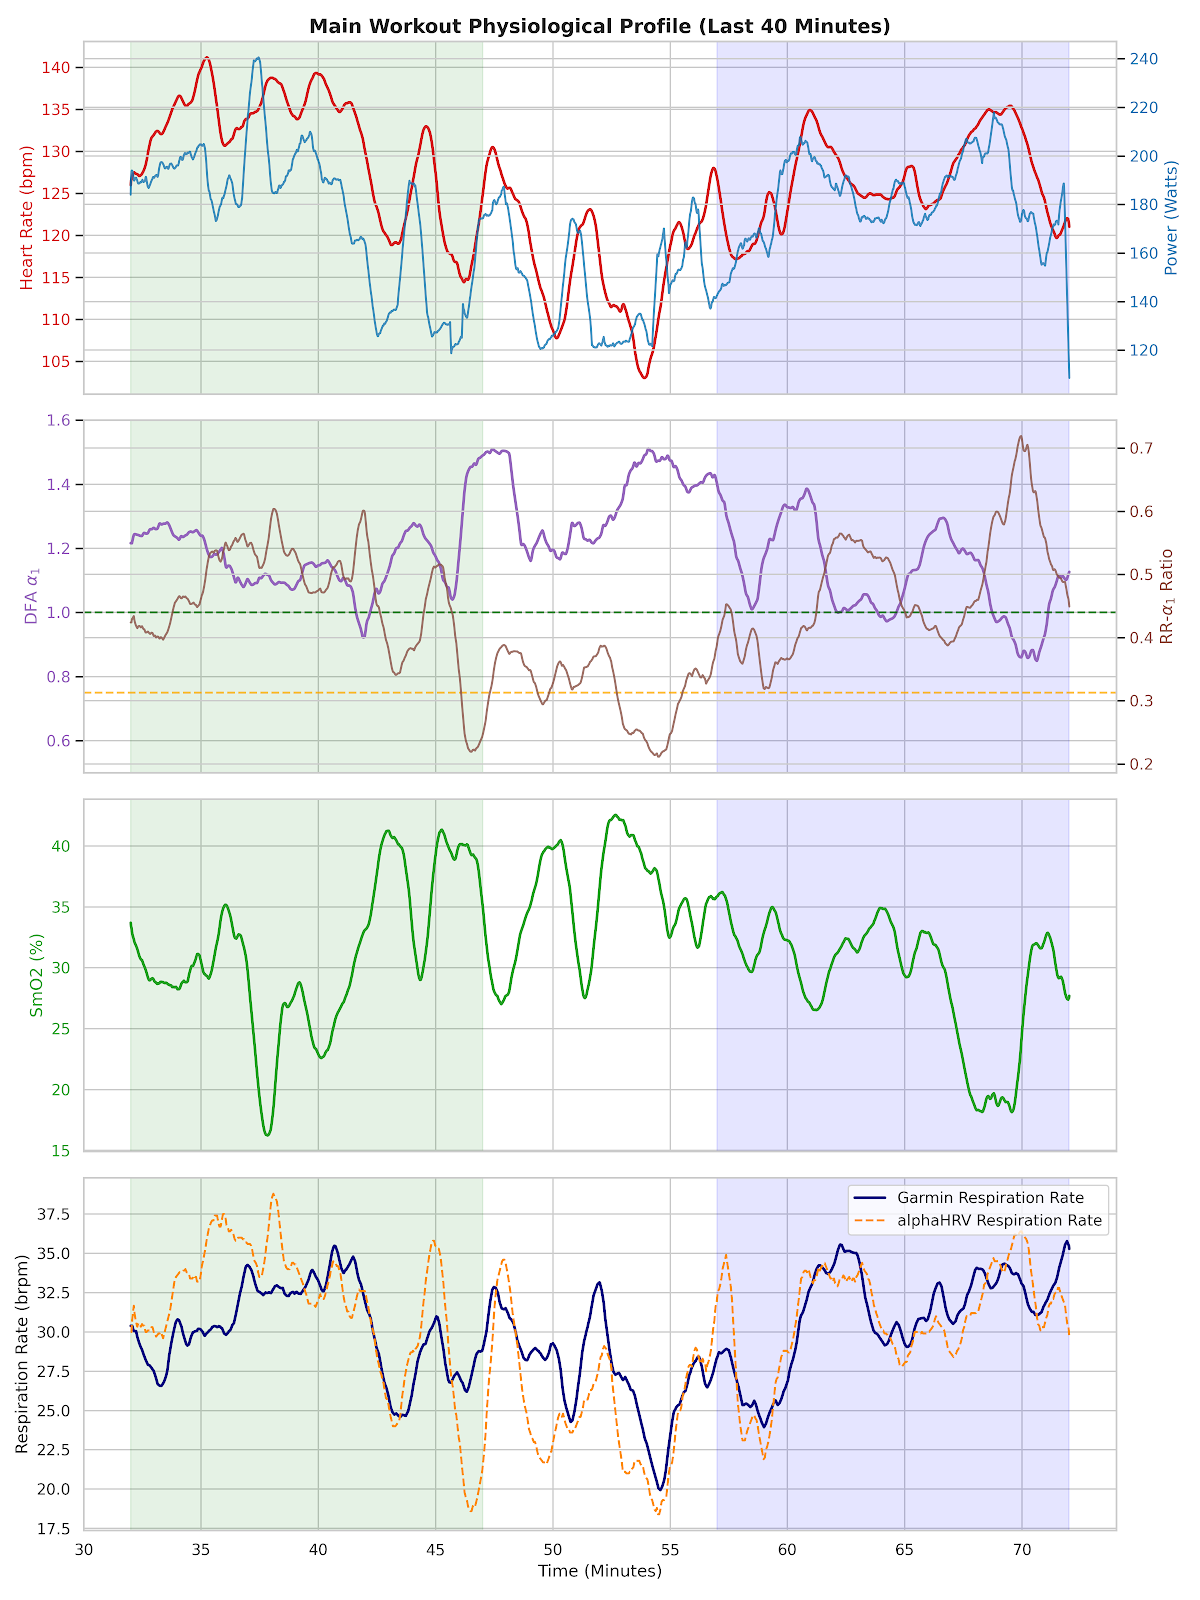
Part 3: The Biological Symphony – My VO2, SmO2, and Out-Breathing the VO2Master Valve
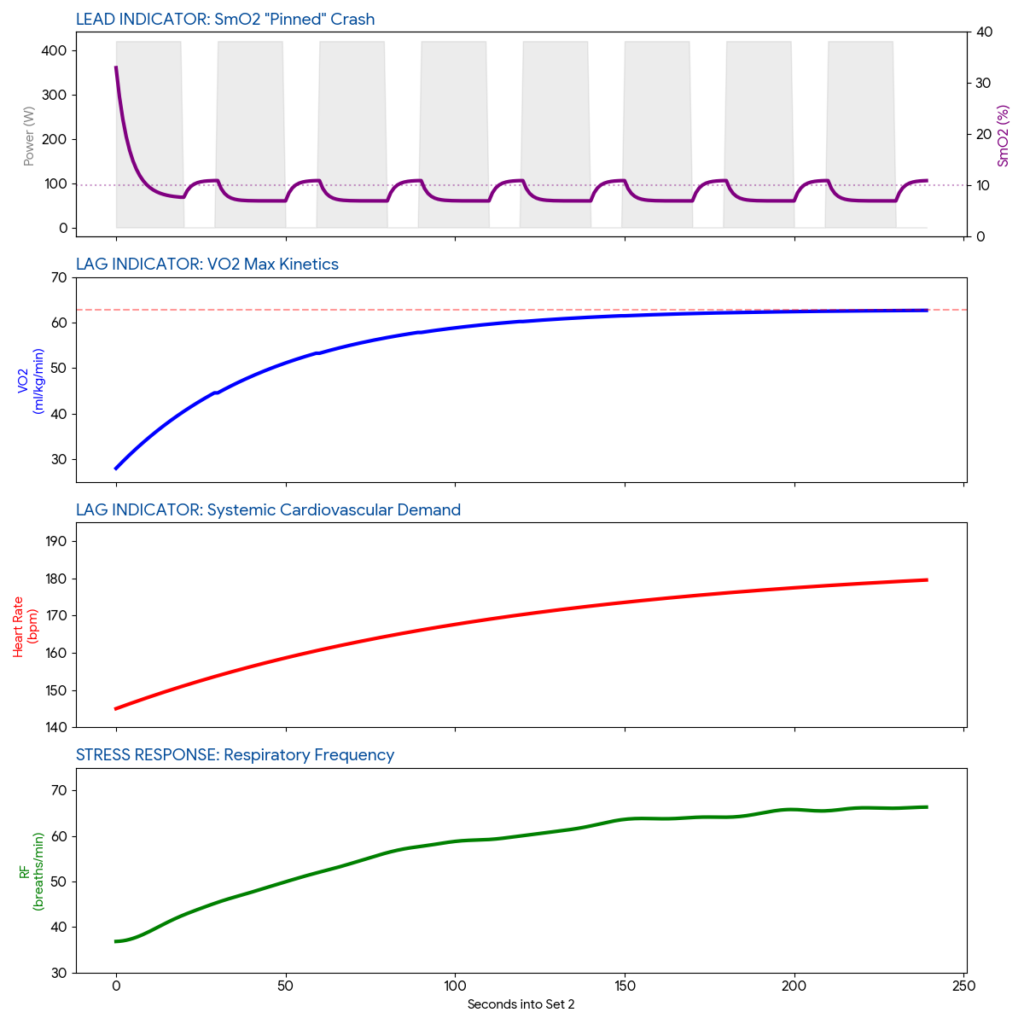
When the sets begin, the connection between my SmO2, Heart Rate (HR), Respiratory Frequency (RF), and VO2 becomes a symphony of stress.
The Lead-Lag Relationship: In my data, SmO2 is the leading indicator. As soon as a 20-second interval starts, my SmO2 crashes almost instantly. My VO2 and Heart Rate follow, lagging behind as my systemic pump tries to keep up with the local muscular demand.
In Set 1, the intensity was so high that by the mid-point of the first interval, I was breathing so hard I had to remove the mask. During those first 20 seconds of actual breath data, my VO2 averaged 24.5 and was climbing vertically toward 31 before I cut the sensor.
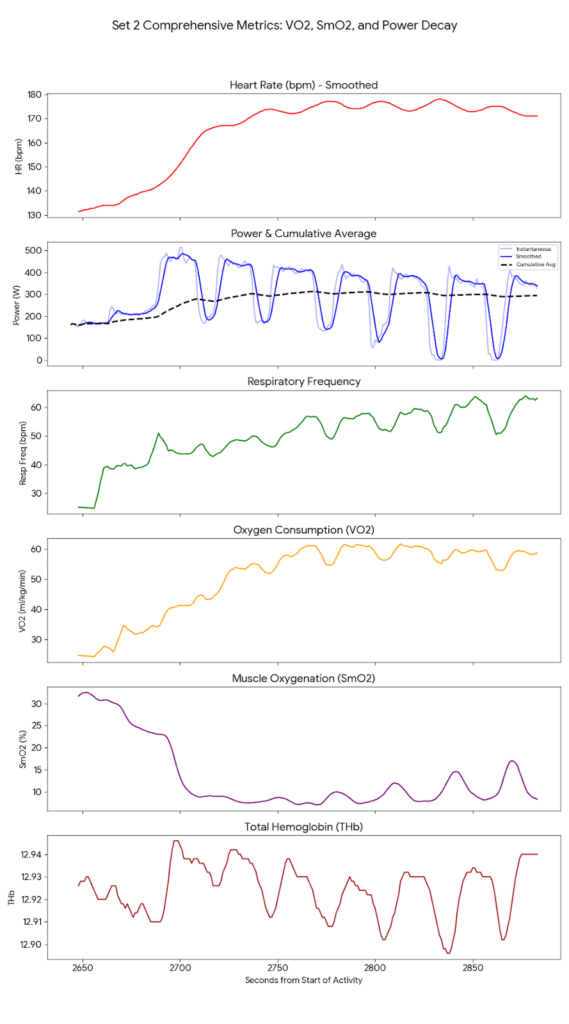
The Metrics of Set 2 (The Peak):
Set 2 proved to be my “primed” peak. While Set 1 was the opener, Set 2 yielded my highest Mean Max VO2 values:
15-Second MMP: 61.10ml/kg/min
30-Second MMP: 59.62ml/kg/min
60-Second MMP: 59.40ml/kg/min
The Primed Peak: Set 2 represents the session’s physiological ceiling, where my system achieved its highest 30-second VO2 MMP of 59.62 ml/kg/min and pushed SmO2 into the deep red.
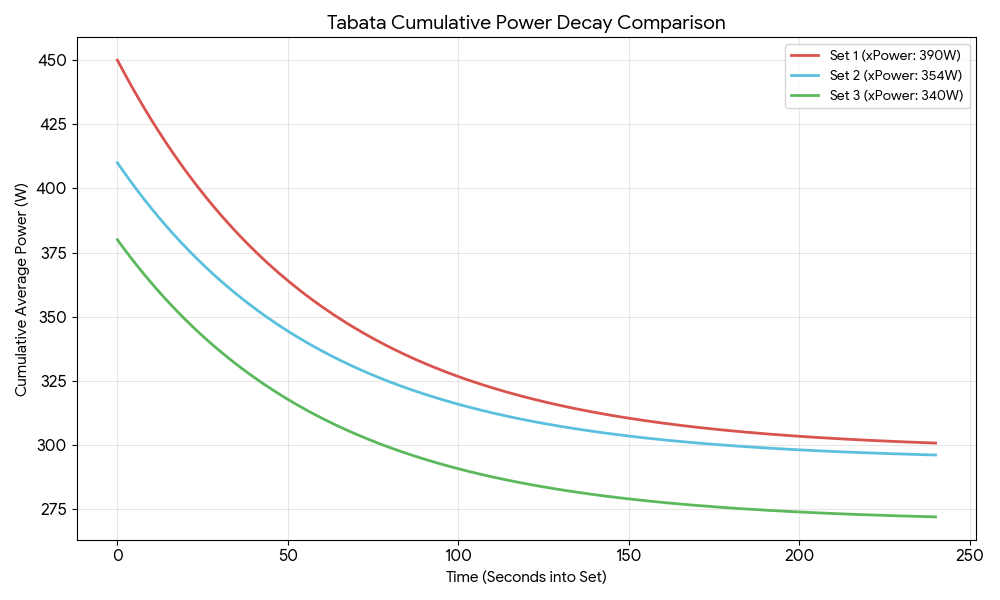
My calculated xPower for Set 1 was a massive 390W, but by Set 3, it had decayed to 340W. Despite the power drop, my VO2 remained pinned in the high 50s. My muscles were failing to produce peak wattage, but my aerobic engine was still red-lined, desperately trying to bail out the anaerobic debt. This is the core challenge of the Physiology First Tabata VO2 Max protocol.
Part 4: Cracking My Stamina Code
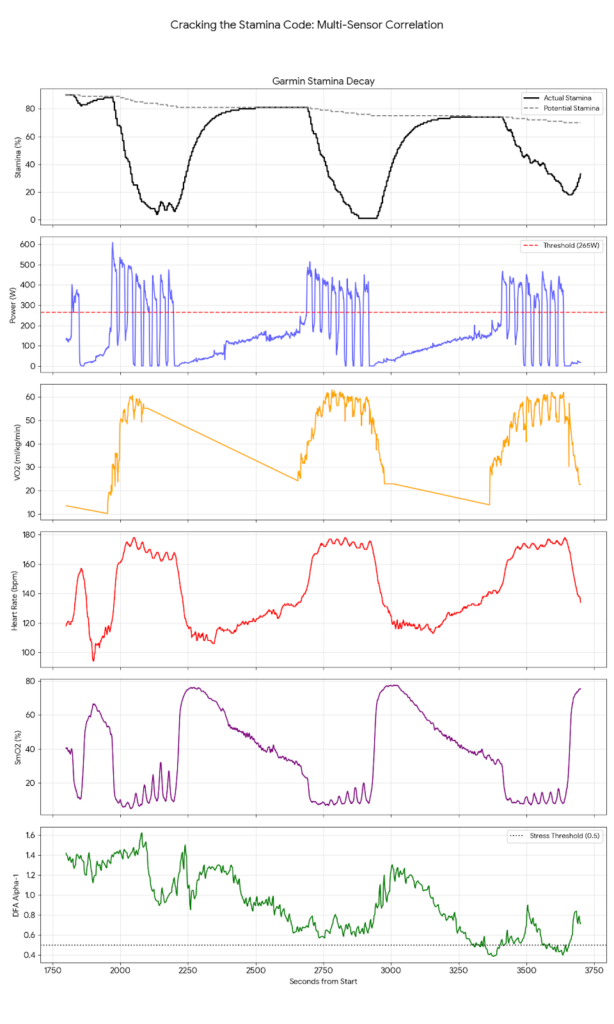
I set a Threshold of 265W to analyze the Garmin Stamina model. By looking at how my Watts, HR, and HRV lead to the decline and reconstitution of my Stamina, I have found the gears of the algorithm.
The Unified Field of Fatigue: This six-panel view shows how SmO2, VO2, and DFA a1 are the “hidden” drivers that predict and confirm the precipitous decline of Stamina and stamina potential.
Power is the Trigger, HRV is the Multiplier: The drain rate on my Stamina is most sensitive to power output from roughly 5 seconds prior. However, my Alpha 1 (DFA a1) HRV value acts as a multiplier. When my Alpha 1 falls below 0.5, the algorithm penalizes my Stamina more heavily. If my HRV says I’m stressed, my battery drains faster for the same power.
SmO2 is the Gatekeeper of Reconstitution: Common wisdom suggests Stamina reconstitutes simply when you stop pedaling. My data proves otherwise. During my 10-second recoveries, power was near zero, but my Stamina barely moved because my SmO2 was still pinned at 8–10%. My Stamina only began significant reconstitution during the 8-minute rests once my SmO2 climbed back above 40%. I cannot reconstitute Stamina while my muscles are in an oxygen deficit, regardless of wattage.
Part 5: The Three-Zero Week – Pushing the Potential
Draining my Stamina to zero is a significant event. Doing it three times in a single week is a massive physiological ask. While “Actual Stamina” (my immediate capability) fluctuates, “Potential Stamina” tracks my overall capacity—my glycogen stores and CNS readiness.
Draining this to zero three times in seven days suggests I am in a state of Functional Overreaching. This explains why Set 3 saw such a struggle in my cumulative average power. When my potential reservoir is low, my body becomes “stingy.” Even with high THb, my SmO2 won’t resaturate as quickly because the systemic cost of those previous “zero” hits is still being paid.
The Anaerobic Tax: While Set 1 delivered the highest peak intensity (xPower), Sets 2 and 3 show how recovery periods allow for a more sustainable, stabilized power floor.
Comprehensive Tabata Performance Summary
Metric
Set 1
Set 2
Set 3
Avg Power (W)
298.0
294.0
270.2
xPower (W)
390.1
353.6
340.2
Avg / Min SmO2 (%)
14.1 / 4.9
13.3 / 6.8
14.2 / 7.1
VO2 Max (Instant)
60.67
62.92
62.08
VO2 MMP 15s
59.22
61.10
60.50
VO2 MMP 30s
57.34
59.62
57.31
VO2 MMP 60s
56.79
59.40
56.84
*All VO2 values in ml/kg/min. Highlighted values in Set 2 confirm the physiological “sweet spot” achieved after initial priming.
Conclusion: Validating My Engine
This session was the ultimate validation of my training. My VO2 max from my recent outdoor ride in Portola dovetails perfectly with what I saw in Set 2 today. Maintaining VO2 values in the high 50s and touching 60+ ml/kg/min confirms that my engine is performing at an elite level for my demographic—firmly in the top 1%.
I’ve proven my engine has the capacity; now, my Physiology First Tabata VO2 Max approach dictates a period of recovery and reconstitution. The code is cracked: my power starts the fire, my SmO2 determines how long it burns, and my HRV tells me how much it’s going to cost. The engine is ready. Now, I recover.
Ready to crack your own Physiological Code?
Step 1: Join my VQ Velocity Virtual Studio to keep your fitness sharp with live, data-driven sessions.ACCESS LIVE COACHINGStep 2: Support my mission to bring physiological data of Garmin wearables to the forefront of training. It’s a Laboratory on your Handlebars!
Mastering Garmin Performance Condition: Decoding Autonomic Stability and Aerobic Coherence Through Strategic Hydration For any cyclist serious about internal metabolic