
When “Easy” Power Isn’t Easy: A VO2 Master Data Deep Dive
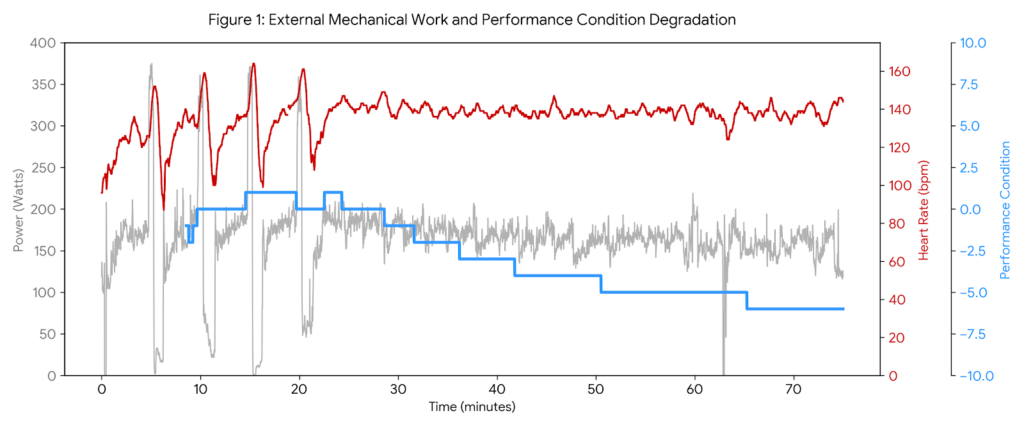
Analyzing VO2 Master data reveals a stark reality check from my ride this Friday morning. I expected a straightforward, low-intensity recovery base day. Instead, my body gave me a loud warning. Even though I intentionally kept my external intensity low, the internal cost of the ride was exceptionally high. This ride is a textbook example […]
Stop Ignoring Garmin Performance Condition: How to Use It as a Real-Time Health Governor
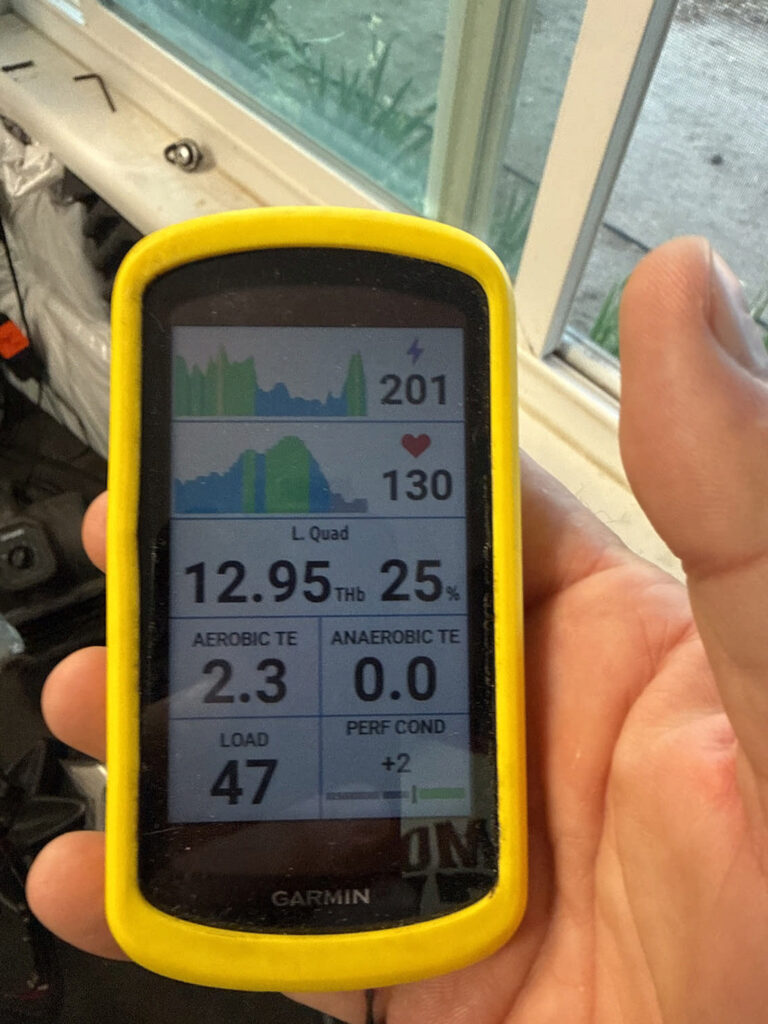
How I Used Performance Condition to Stay Healthy on Today’s Base Ride This morning’s ride wasn’t about speed or hero watts. It was about physiology, recovery, and learning how to leverage Garmin Performance Condition to protect my autonomic system. For the first time, I used this real-time metric as the primary governor for the entire […]
The Garmin Daily Double Dip: A Stamina and Potential Deep Dive
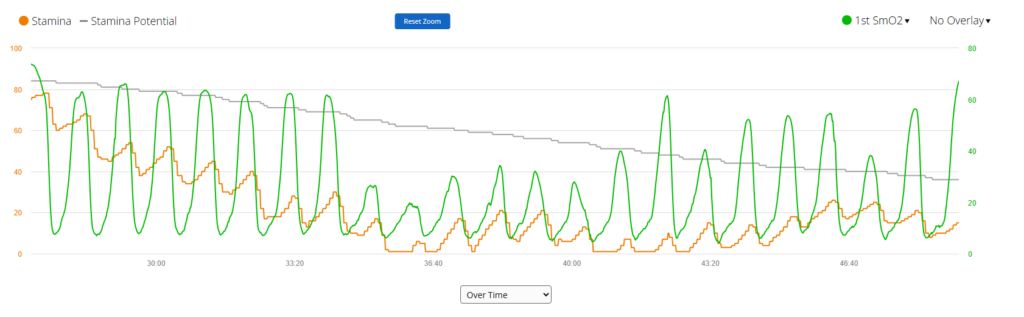
The Garmin Daily Double Dip: A Stamina and Potential Deep Dive Coach Wharton – May 7, 2026 Understanding Garmin Stamina metrics like Actual Stamina and Stamina Potential has fundamentally changed the way we analyze real-time capacity and athletic recovery. While Potential represents your total “fuel tank” for the entire ride, Actual Stamina reflects what you […]
Rocky Terrain Suspension Efficiency: The Open vs. Locked Debate

May 7, 2026 Rocky Terrain Suspension Efficiency: The Open vs. Locked Debate; A Peavine Challenge In November 2025, I conducted a “Physiology First” experiment on Reno’s Peavine Mountain to analyze rocky terrain suspension efficiency. This ride has since become the archetype and benchmark for my 2026 training season. The mission was simple: Two laps on […]
The Half-Glass Difference: How Alcohol Sabotages Your Garmin Recovery

When analyzing Garmin sleep recovery, alcohol is often the “X-factor” that derails even the most disciplined athlete. We’ve all heard it before: “It was just a couple of glasses of wine.” But as a coach who lives by the mantra Physiology is King, I’m less interested in what the menu says and more interested in […]
Sleep Score HRV Stress: The Yin and Yang of Recovery
The Yin and Yang of Recovery Physiology First Training | By Coach Richard Wharton Managing your Sleep Score HRV Stress data is the ultimate balancing act for any serious athlete. I’ve spent the last 48 hours in the “pain cave” building a trailer, manhandling heavy steel. When I pulled my metrics this morning, I saw […]
Predicting the Redline: Using Garmin Sleep Scores to Master Ronnestad 30-15 Intervals
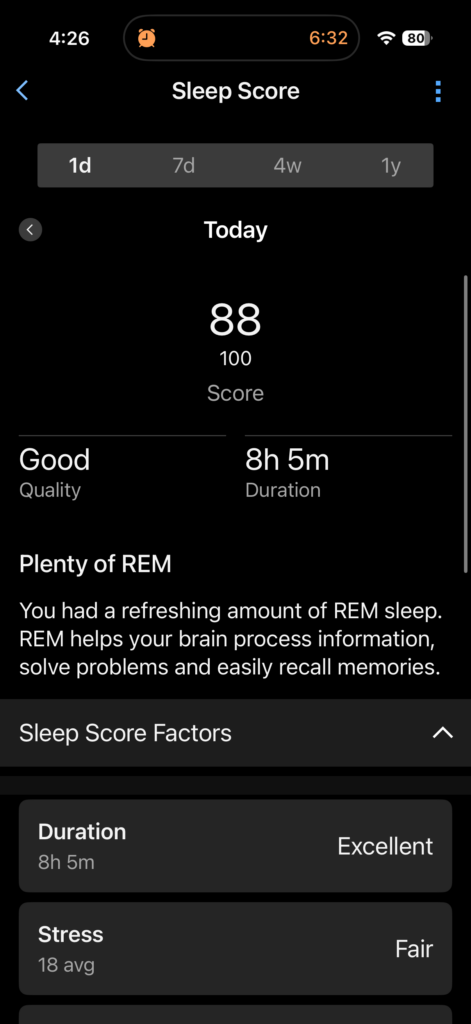
Physiology First: Using Garmin Sleep Scores to Predict Ronnestad 30-15 Success Part I: The Garmin Sleep Score Ronnestad Preflight We often treat training like a game of chance, but the reality is that your body provides a daily “weather report” if you know where to look. Before I even touched my bike this morning, I […]
Physiology First: Navigating a “Red Light” Morning with AlphaHRV
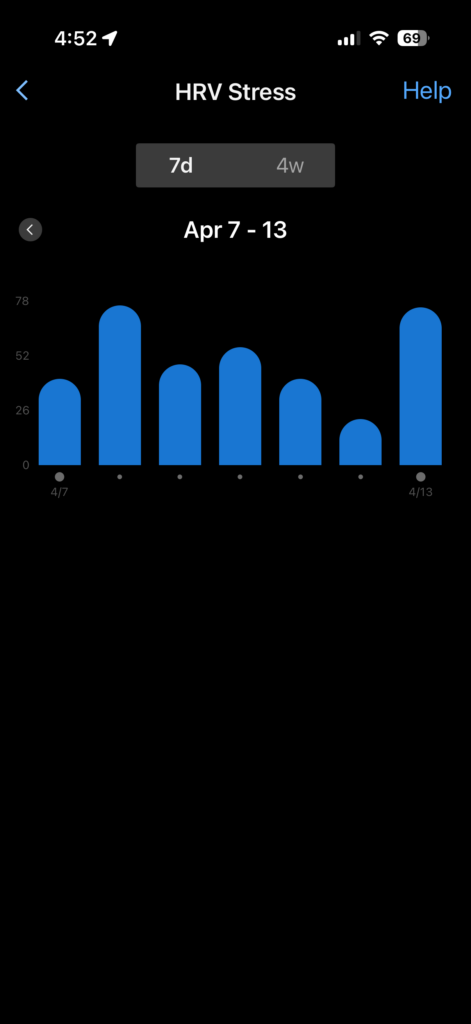
Physiology First: My Red Light Recovery Ride This morning was a masterclass in why I apply a Physiology First framework to every session, looking at the internal engine before I look at the wattage. Between a late meal and the devastating news about my friend Murray being struck by a motorist—suffering a serious […]
Xert FTP Tested
Xert Claims my FTP (Functional Threshold Power) Sits At 265 Watts. Is It Accurate?
I’ve always wondered if calculated Functional Threshold Power Values are accurate. Since 2017, however, I have relied on the Xert FTP value.
For years, we relied on the “20-Minute” Test. Riders would perform a 20-Minute effort, all out, and then subtract 5% from that value. The new number was considered “Threshold”.
Later, physiologists looked at 90% of a 3-Minute Maximal Effort.
There’s the 5-1-5 test….
Step Tests (25w steps every 3 minutes)…
Ramp tests (15-20w every minute)…
The latest ‘Testing’ asks for a 20-minute, 5-minute, 1-minute, and 5-second effort.
[caption id="attachment_12832" align="aligncenter" width="1024"] Xert Claims that my FTP (Functional Threshold Power) is at 265 watts. Let’s find out how accurate that really is.[/caption]
NO MORE TESTING???.
The Xert “Time-to-Exhaustion, Time-to-Recovery” Garmin Field in REAL TIME.
Today’s Xert Daily Ditty shows how the Xert “Time-to-Exhaustion, Time-to-Recovery” Field shows timer countdowns and count ups, as wattage is generated while cycling. Not much is going on this week, since I am tapering, but the Xert “Time-to-Exhaustion, Time-to-Recovery” Field will be integral to my 5MMP Breakthrough Effort. Thanks for watching, and ENJOY THE RIDE!