The Rolling Debt of Fitness: How I Use Garmin’s “Load Focus” to Build Better Athletes
As a cycling coach with over 20 years of training history, I’ve seen every metric come and go. I used to believe “Power is King,” but my coaching philosophy has evolved into something far more precise: Physiology is King. Your power meter tells me what you did; your internal metrics tell me what it cost you—a reality best captured by the Garmin Load Focus metric. When I’m out on the road or on the trainer, I look at my “Internal Receipt”—a metric called EPOC (Excess Post-Exercise Oxygen Consumption). On my Garmin screen, I watch this absolute Load value climb in real-time. It is the metabolic debt I am accruing, and understanding how that debt is structured is the secret to moving from “just riding” to true physiological adaptation.
The Real-Time Receipt vs. The Post-Ride Summary
There is a massive connection between the numbers I see while I’m sweating and the horizontal bar charts I analyze after I shower. At OnlineBikeCoach.com, I emphasize that these aren’t just colors; they are metabolic categories.
- On the Bike (Absolute EPOC/Load): This is the “Live Bill.” As I push into a set of 8-minute intervals, I see my cumulative Load units ticking up. If I hit a 150-unit session, I know I’ve put a significant dent in my homeostasis.
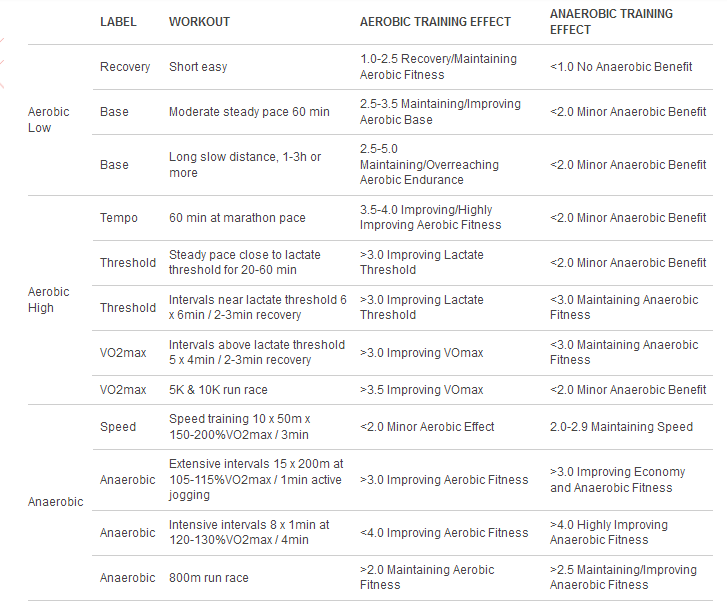
- In the App (Load Focus Bars): This is where the bill is categorized. Firstbeat Analytics takes that total debt and buckets it into Low Aerobic (Blue), High Aerobic (Orange), and Anaerobic (Purple).
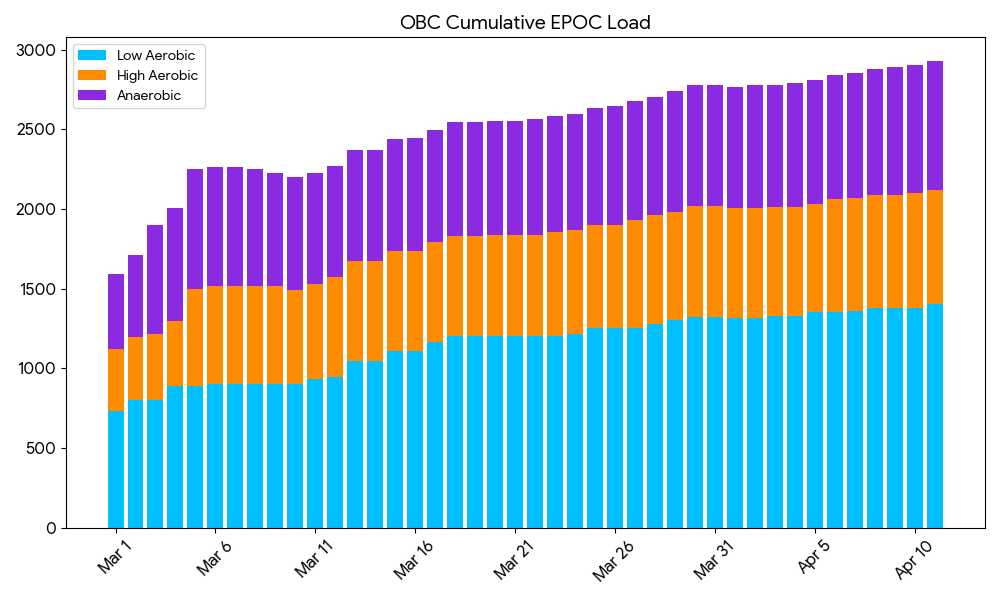
Most athletes only ever see the final summary. Here is what my raw Garmin Load Focus looked like over a 42-day period, shifting every morning as old rides fell off the back of the 28-day rolling window:
Visualizing My 42-Day Garmin Load Focus Journey
To show you what this looks like when we apply a “Physiology First” lens, I’ve synthesized my own data from March 1 to April 11. I wanted to see how consistency—or the lack of it—shows up in my metabolic profile.
My Cumulative “Metabolic Mountain”
In the chart below, you can see my absolute volume. My total metabolic debt grew from roughly 1,600 units to nearly 3,000 units. As my fitness improved—eventually hitting a 56 VO2max—I didn’t just get faster; I became capable of carrying more debt.
My Periodization “Shadow”
The following animation shows my relative percentages. In early March, my Anaerobic focus hit 36%. I was sharp, but I was overextended. Over the next 30 days, I didn’t just stop training; I consolidated. This is how you earn a threshold jump. You don’t recover from a hard block in a day; you consolidate it over a month.
Physiology Forward: The Sleep Connection
Why does this distribution matter so much? Because adaptation happens while you sleep. If your Garmin Load Focus is constantly skewed toward High Aerobic and Anaerobic without enough Low Aerobic to balance it, your nervous system stays “on.” By maintaining a consistent, balanced Load Focus, I make it easier for my body to “switch off,” leading to better recovery and higher HRV scores.
Coaches Need Coaches, Too: The VQ Velocity Secret
Even coaches need coaches. This morning, I was in the VQ Velocity room with Robbie Ventura, the owner of the platform. Seeing a legend like Robbie push me reminds me that structure is the only way to attain this level of consistency.
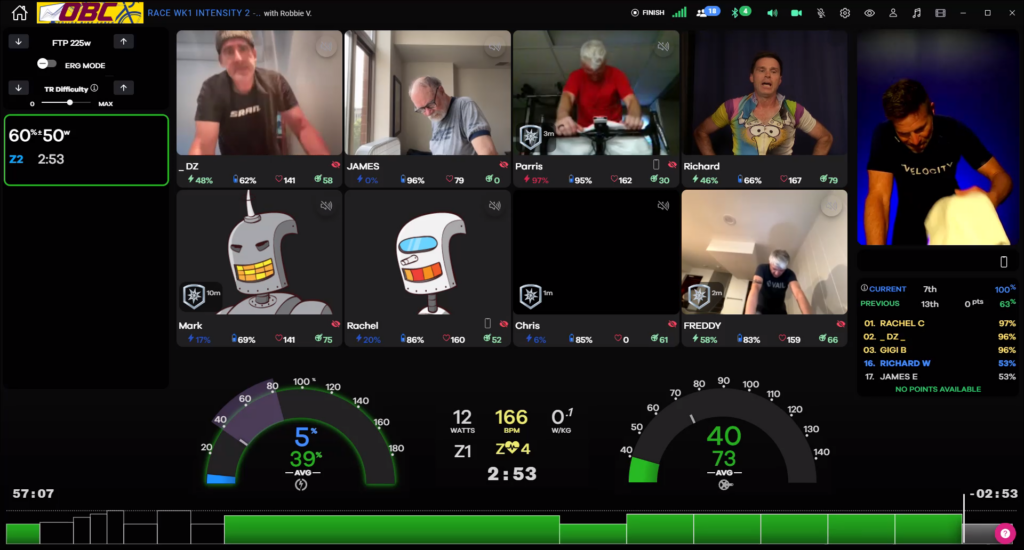
In my VQ Velocity room, I provide that same structure for you. It’s easy to go hard once; it’s incredibly hard to go right for 28 days straight. I manage the “Physiology First” approach for you, ensuring every ride helps improve your fitness rather than just digging a hole you can’t sleep your way out of.
Join the VQ Velocity Room
I provide the structure, the science, and the “Physiology First” coaching you need. Join my VQ Velocity room for $225/month and start training with a plan built for adaptation, not just exhaustion.
If you found this analysis helpful, consider buying me a coffee. Every bit helps me keep the sensors charged and the data flowing!