How I Used Performance Condition to Stay Healthy on Today’s Base Ride
This morning’s ride wasn’t about speed or hero watts. It was about physiology, recovery, and learning how to leverage Garmin Performance Condition to protect my autonomic system. For the first time, I used this real-time metric as the primary governor for the entire session — not as a post-ride curiosity, but as an active pacing tool to ensure a true endurance workout.
It worked.
By the end of the ride, I logged:
- 68 EPOC
- 2.7 Aerobic Training Effect (Base)
- 715 kcal burned
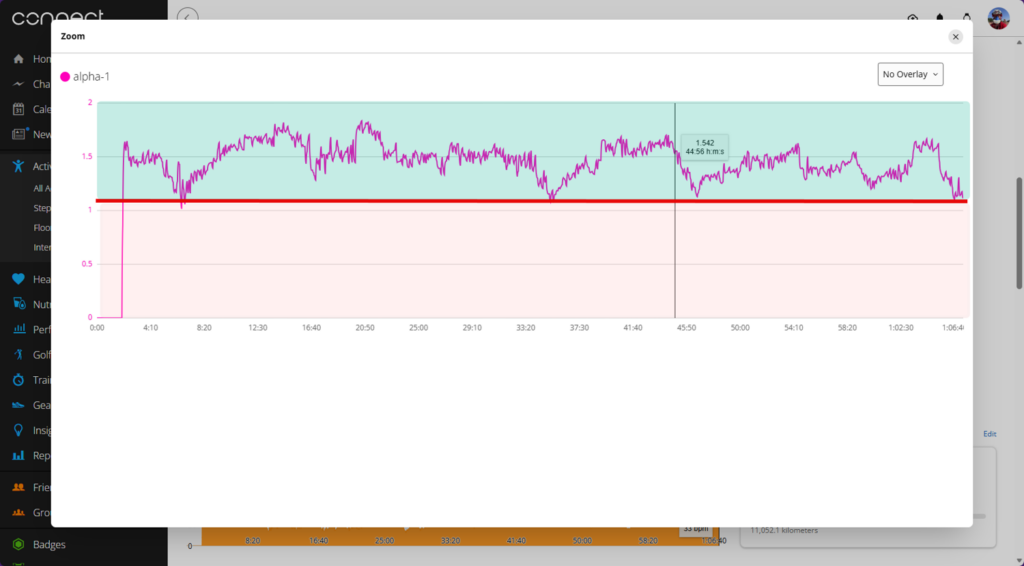
- DFA‑α1 consistently above 1.00 (mostly above 1.17)
- RR‑A1 held below 0.5
- Respiration Rate kept below 33
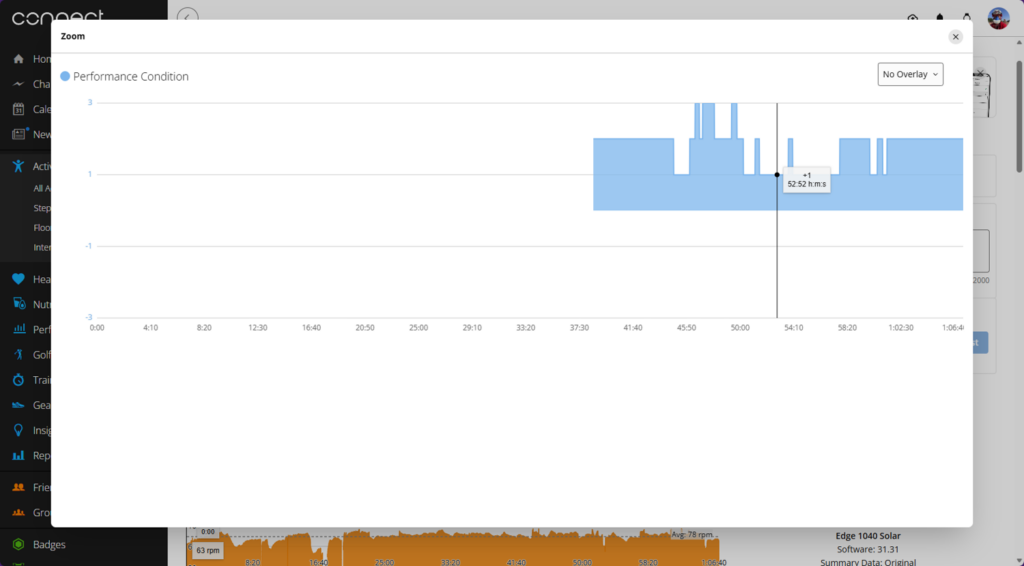
- Performance Condition rising from +1 → +2 → +3
This wasn’t just a “good recovery ride.” It was a healthy ride — one that protected my autonomic system, kept drift under control, and left me feeling better at the end than at the start.
Why Garmin Performance Condition Took 40 Minutes to Show Up
One of the most interesting parts of the ride was what didn’t happen: the metric didn’t appear until minute 40.
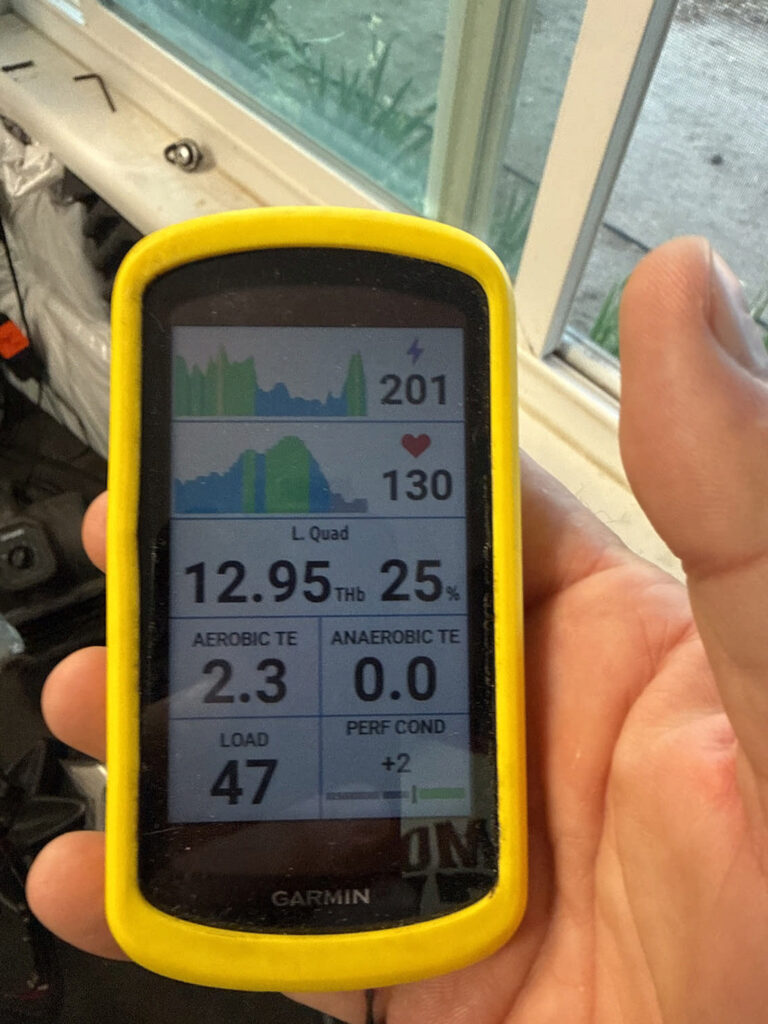
The moment Garmin “PerfCon” finally appeared — stabilizing at +2 around minute 40 after my autonomic and respiratory systems settled.[/caption>
Most riders see it within the first 6–12 minutes. Mine took more than triple that. And that delay wasn’t a glitch — it was physiology.
Why the delay happened:
1. The autonomic system needed time to stabilize.
Early in the ride, HRV complexity was still settling. DFA‑α1 was rising toward coherence, but not quite there.
2. Internal breathing patterns weren’t yet consistent.
Respiration rate was still normalizing. The system won’t calculate until ventilation is stable.
3. Crucially, the HR-to-power ratio needed to “lock in.”
The algorithm compares early HR and power against my baseline. Until those signals stop drifting, the data stays hidden.
4. An extended warmup is part of my athletic signature.
I don’t hit steady-state physiology quickly. My aerobic system ramps slowly — which is actually a durability signature.
When it finally appeared at +2, it was because all three major systems — cardiovascular, respiratory, and autonomic — had synchronized.
That’s the moment the ride truly began.
What Garmin Performance Condition Actually Is
At its core, Garmin Performance Condition is a real-time estimate of how your body is performing compared to your long-term baseline. If you want to dive deeper into the backend analytics, you can check out the engineering definitions on the Firstbeat Analytics Hub.
It’s calculated from:
-
- Heart rate
-
- Power
-
- Respiration rate
-
- HRV-derived variability
-
- VO₂max history
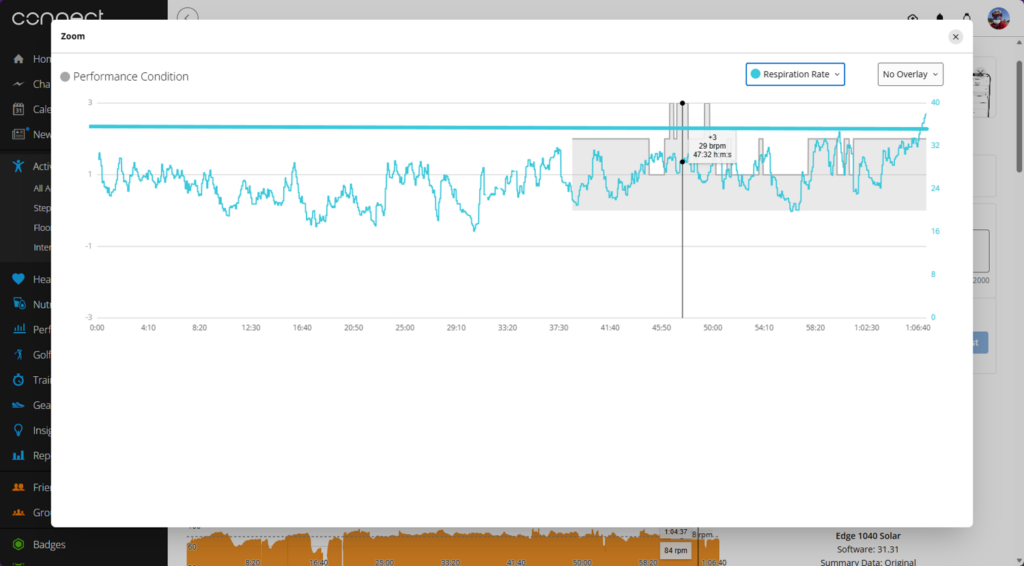
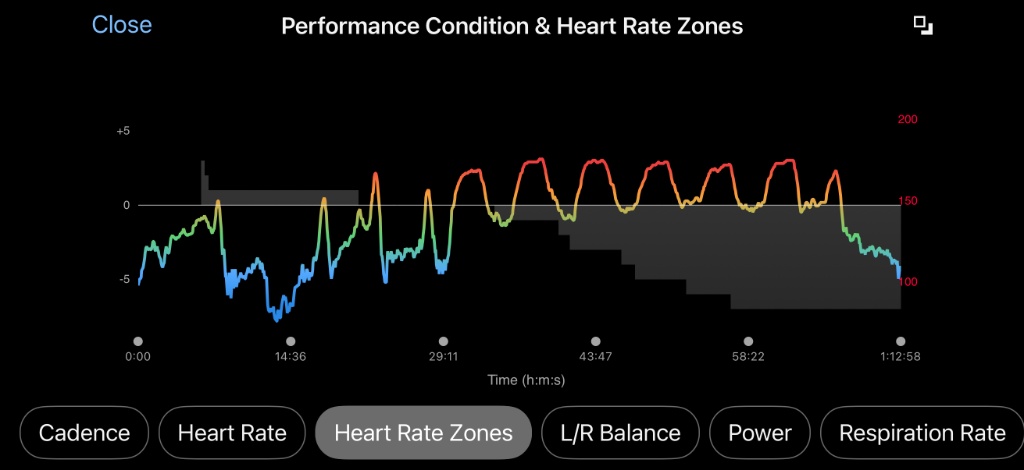
Respiration rate held below 33 bpm while PerfCon climbed to +3, marking the moment my ventilation and autonomic system fully stabilized.
A positive score means you’re more efficient than usual.
A negative score means you’re working harder than expected for the same output.
It is not a fitness score — it’s a stability score.
It tells you whether your physiology is coherent or chaotic. And that makes it incredibly useful for everything from baseline aerobic development to intense interval execution. If you need assistance setting up your data screens to view this live, take a look at our Garmin Guru Coaching Services.
Today, I used this data as a real-time “health governor.”
The Three Metrics I Used to Protect My Physiology
To keep my metrics positive and avoid drift, I used three physiological guardrails:
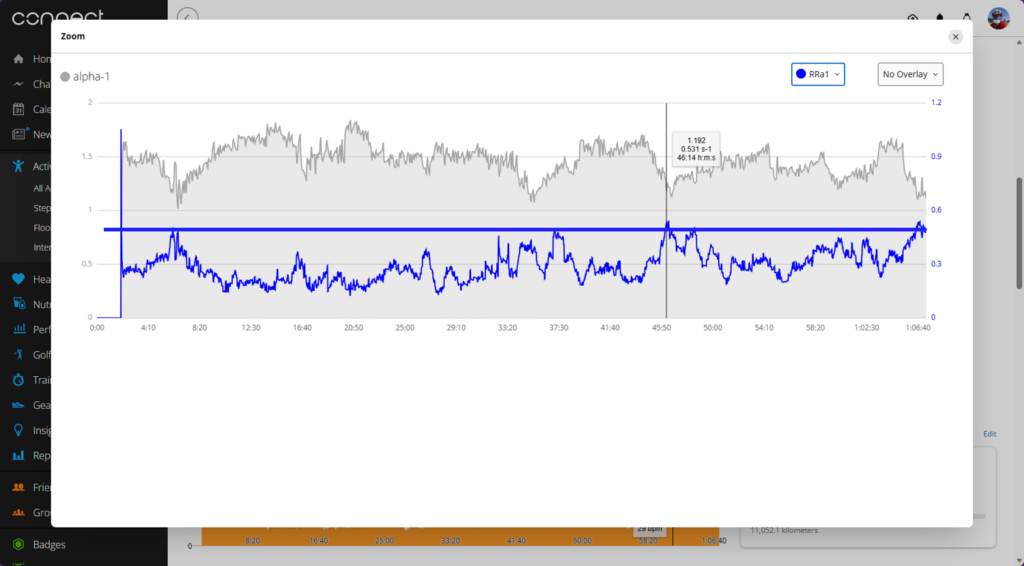
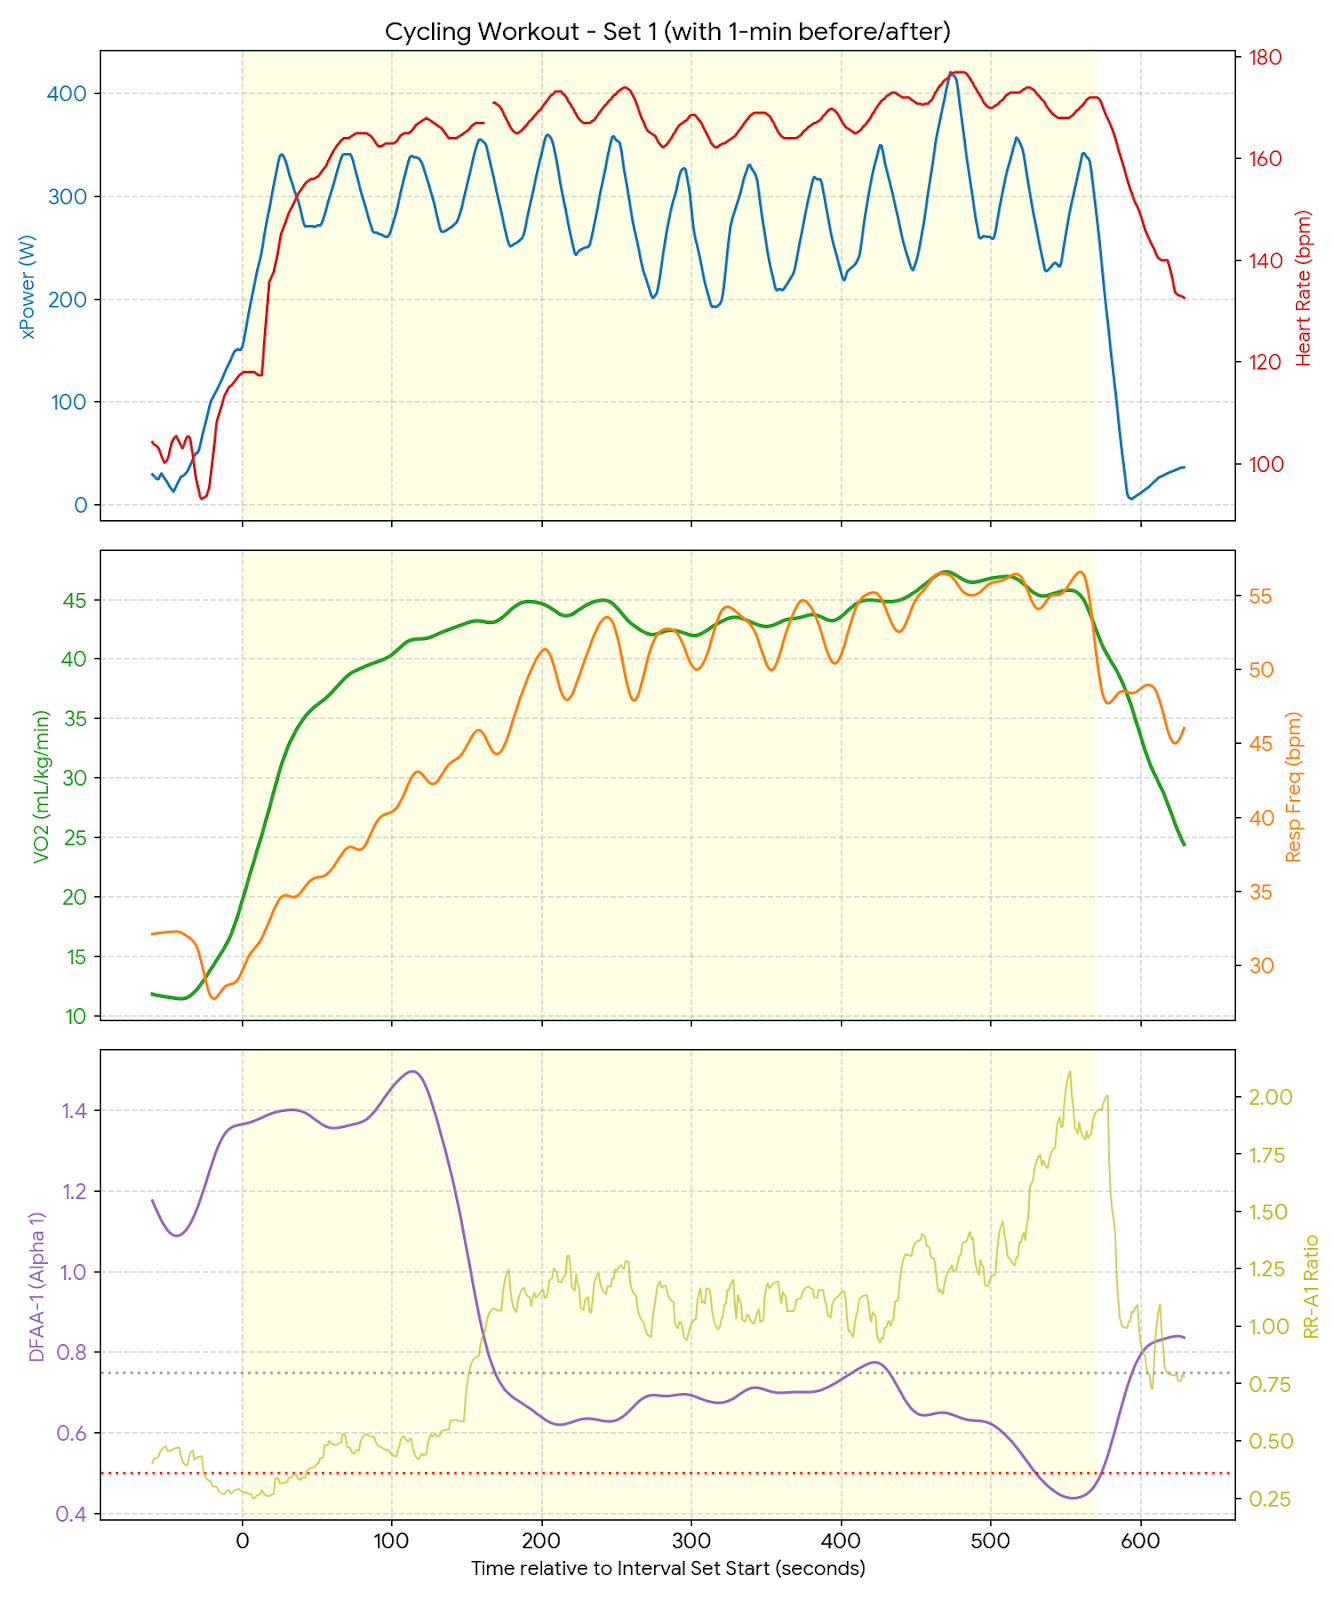
DFA‑α1 stayed well above 1.17 while RR‑A1 remained below 0.5, confirming the autonomic stability that supported a rising Performance Condition.
1. DFA‑α1 above 1.00 (ideally above 1.17)
This kept me in aerobic territory and prevented sympathetic overload.
2. RR‑A1 below 0.5
This ensured my autonomic system stayed ordered and stable.
3. Respiration Rate below 33
This kept me below ventilatory threshold (VT1) and prevented unnecessary strain.
When all three were aligned, my condition stayed positive — and even climbed.
How Garmin Performance Condition Guided the Ride
Once the number appeared at minute 40, I used it as the primary pacing tool.
When the metric was +1
I held power steady and focused on breathing rhythm.
When it rose to +2
I knew my system had stabilized — stroke volume was strong, ventilation was efficient, and HR drift was minimal.
When it hit +3
This was the greenest of green lights. My physiology was not just stable — it was thriving. I stayed in the pocket, kept SmO₂ above 20%, and let the ride unfold naturally.
The value never dropped. Not once.
That’s the hallmark of a healthy ride.
What I Accomplished Today
This wasn’t a high-intensity day. It wasn’t a breakthrough day. It was a maintenance day — and a very successful one.
Here’s what the physiology says I accomplished:
- Recovered without accumulating junk fatigue
- Strengthened aerobic durability
- Improved autonomic stability
- Protected HRV for tomorrow
- Built mitochondrial efficiency
- Avoided drift, strain, and sympathetic spikes
- Finished stronger than I started
This is what a base ride is supposed to feel like.
Why This Metric Matters for Future Training
Your Garmin Performance Condition is more than a fleeting number on a screen. It’s a real-time window into your physiology.
Used correctly, it can:
- Prevent overreaching
- Protect recovery days
- Guide intensity days
- Signal readiness for VO₂max work
- Help pace long climbs
- Keep drift under control
- Improve durability
- Reduce injury risk
- Optimize fueling
- Make training healthier, not just harder
Today’s ride was proof: when you listen to the right signals, your body rewards you.
Final Thoughts
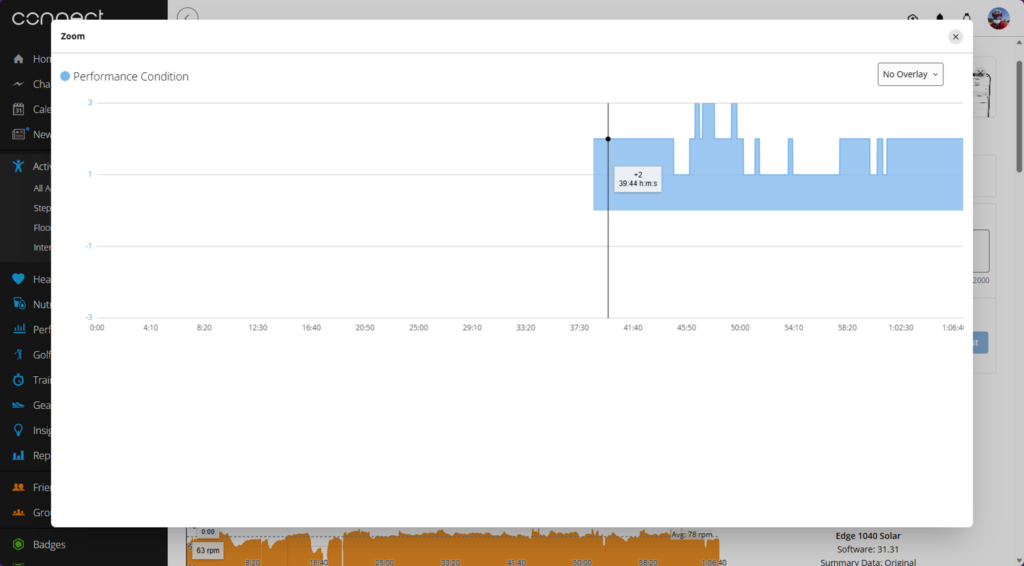
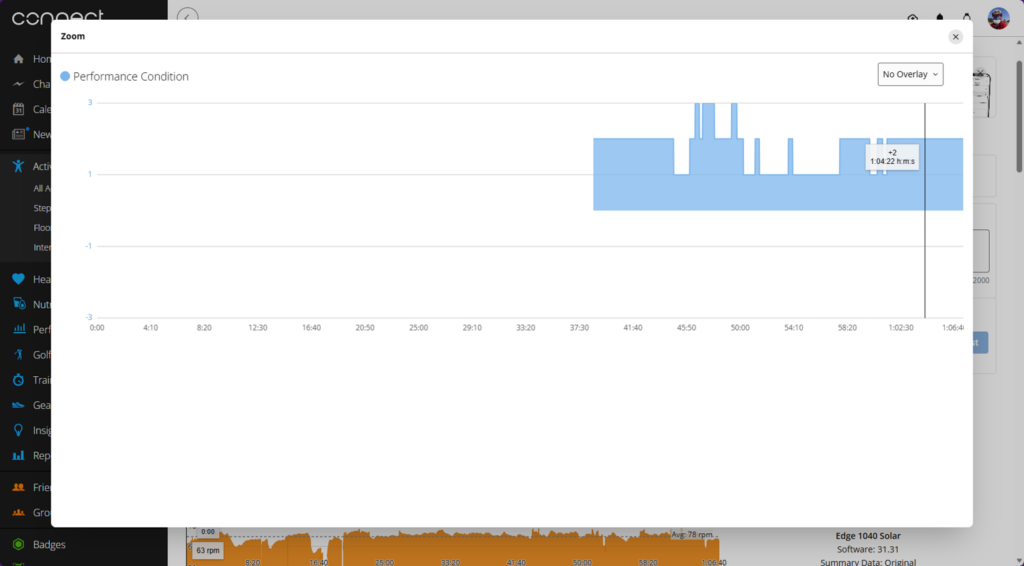 This image shows the final Performance Condition graph from my morning base ride, highlighting a +2 value at 1:04:22. The blue shaded area reflects consistent positive PerfCon values throughout the session, with this late‑ride reading demonstrating sustained autonomic stability, low drift, and strong aerobic efficiency.
This morning’s ride wasn’t flashy. It wasn’t fast. It wasn’t heroic.
But it was healthy — and that’s the foundation of every breakthrough session that comes later.
By pairing your actual live metrics with DFA‑α1, RR‑A1, and respiration rate, you turn a simple recovery spin into a physiology-driven success.
Have you been paying attention to your Performance Condition during intervals? Look for your own standing signatures and structural cliffs in your Garmin Connect files.

I’m the only coach in the world who is melding the powerful metrics of the Garmin Ecosystem with Group Fitness Programs. This is available LIVE, 5-6 days a week. Classes roll at 0500 PST.

If you’re not interested in live coaching, let’s look at your Garmin Connect Data and see if there are ways to make the most out of your fitness and time. I’ve been doing this since 1993, so I know a thing or two (or three…)