Every endurance athlete knows the feeling of hitting a wall, but few can see it coming down the track with mathematical precision, which is why monitoring your Garmin Performance Condition is so vital during hard blocks. Yesterday, I set out to complete a critical high-intensity maintenance block: 7×3-minute VO2max intervals targeting north of 270 watts.
I didn’t make it. I structurally failed my 6th interval, watched my body force a mechanical bailout, and completely pulled the plug on my 7th.
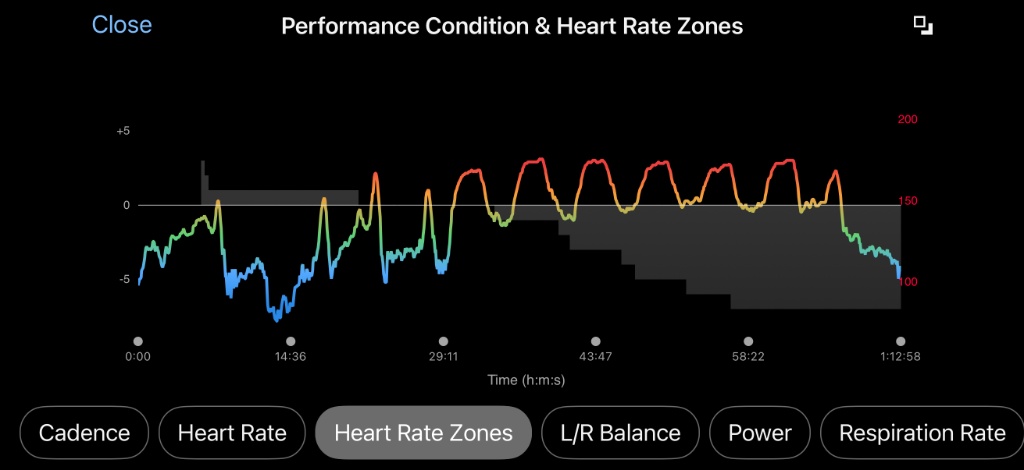
While a traditional coach might attribute this to a simple “lack of motivation” or an off day, my physiology-first approach reveals a systemic autonomic and metabolic collapse. The master conductor of this warning system was a real-time Garmin metric that too many athletes relegate to a post-ride curiosity: Performance Condition (PC).
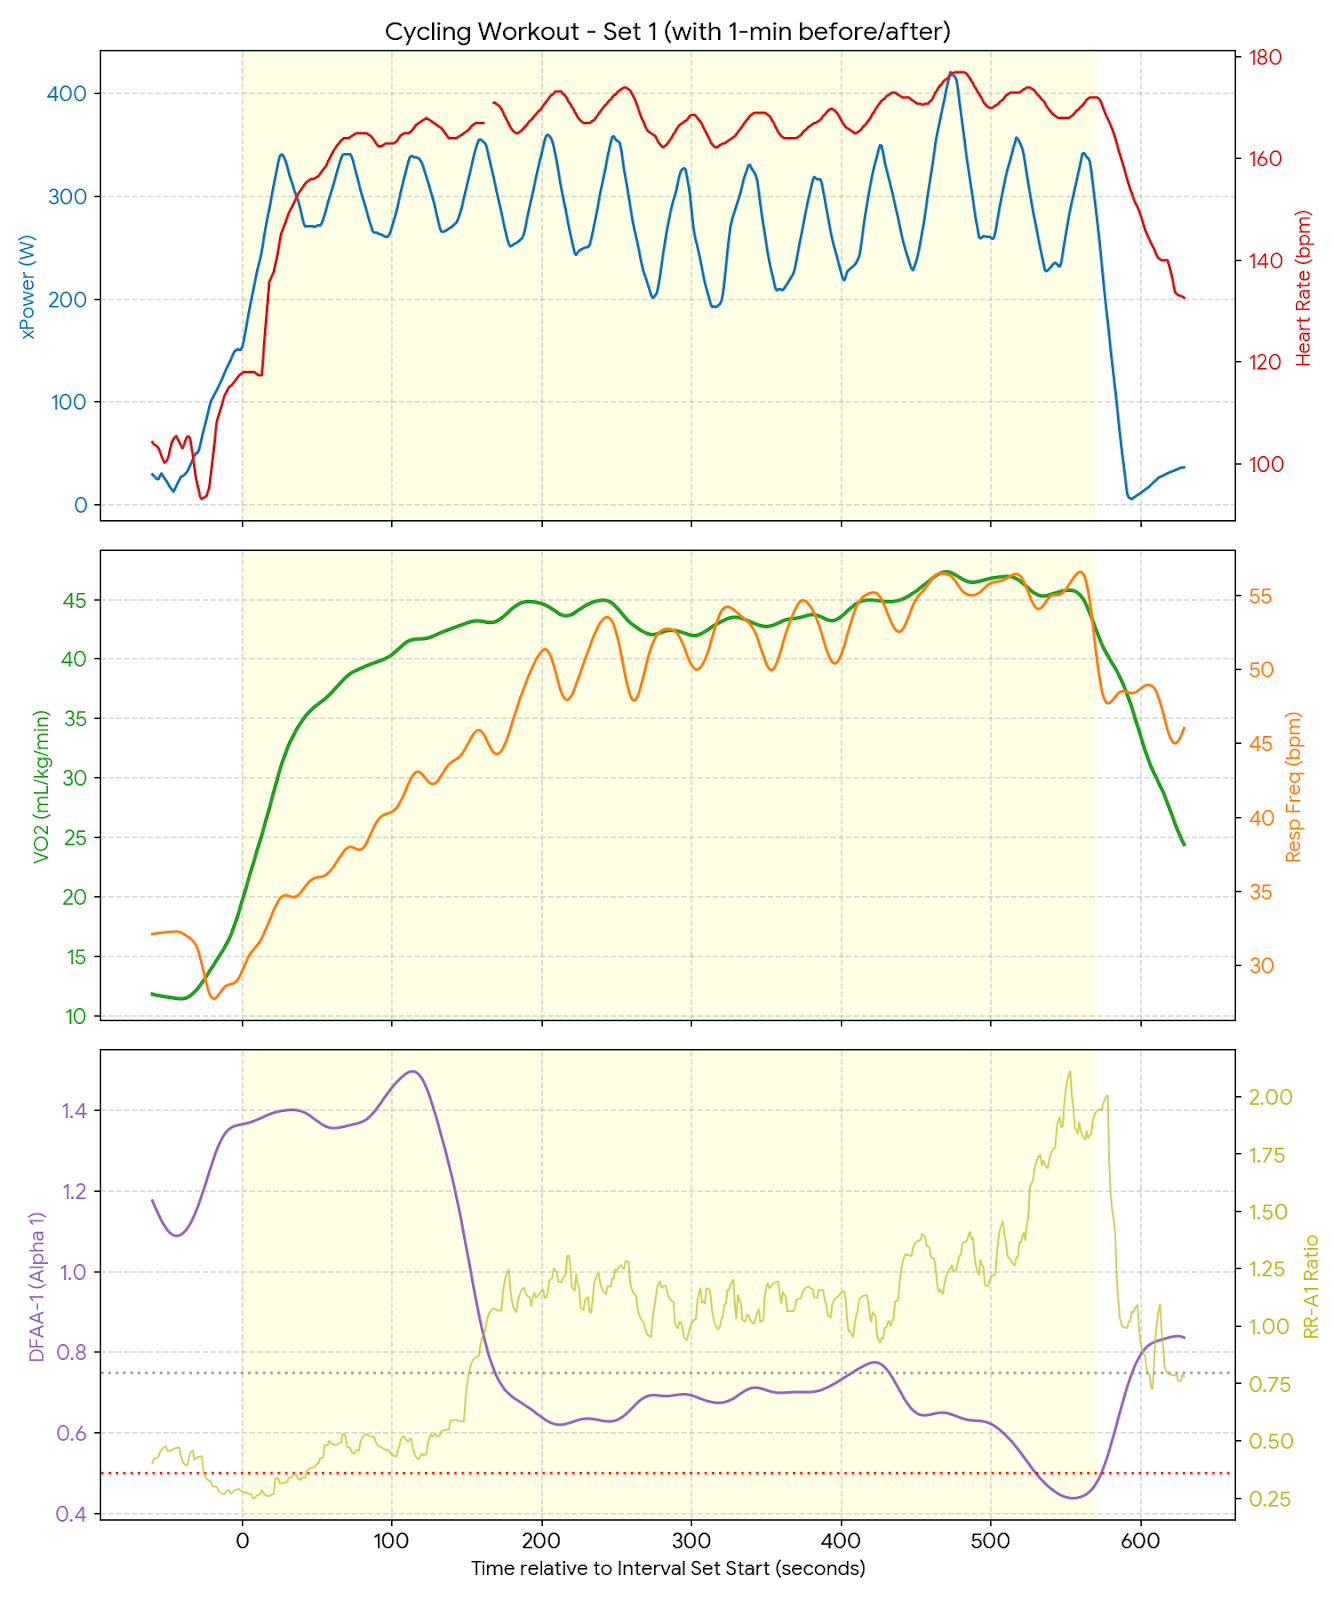
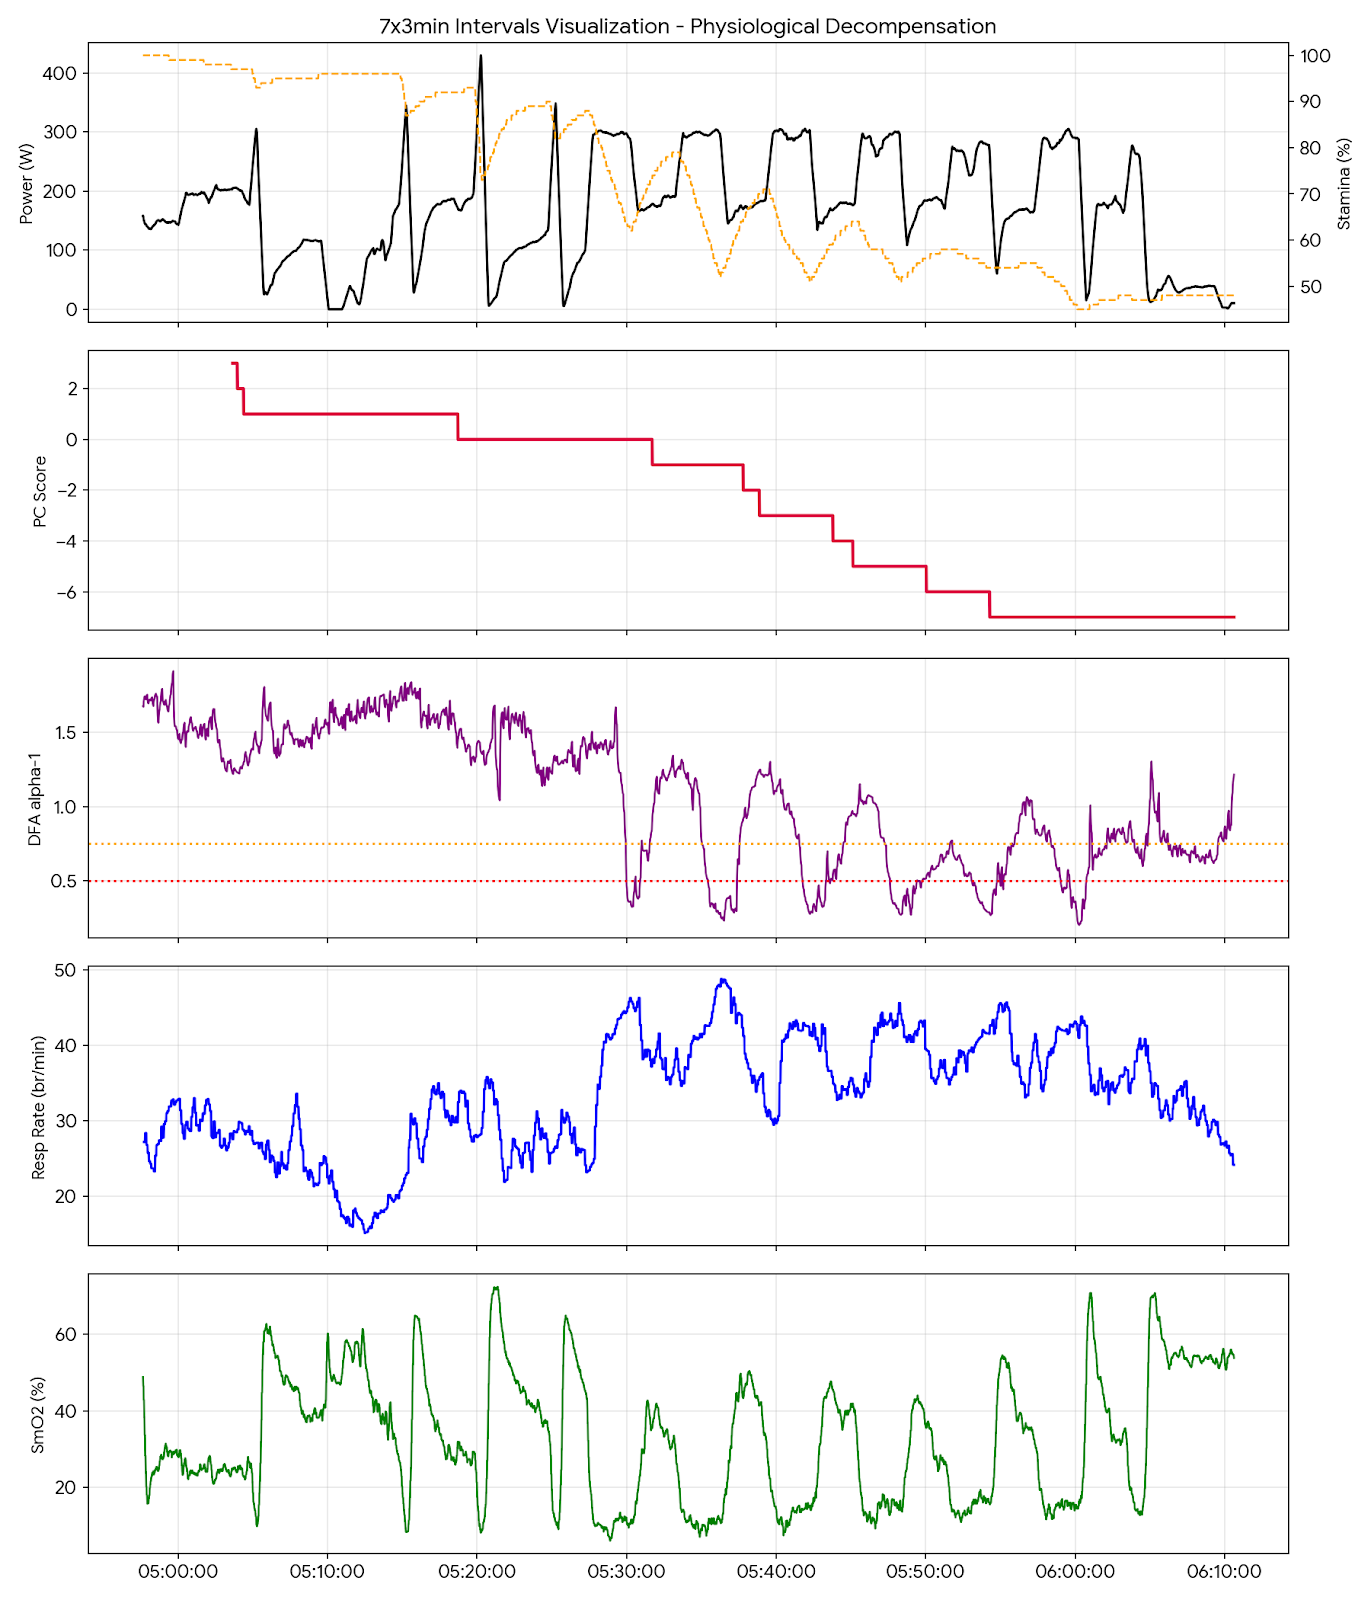
To help visualize this collapse, I’ve overlaid my raw CSV sensor data from 7x3min intervals failed performance condition.csv—capturing the exact alignment of my Performance Condition, DFA alpha-1 (α₁), Stamina, and power output—in the chart below.
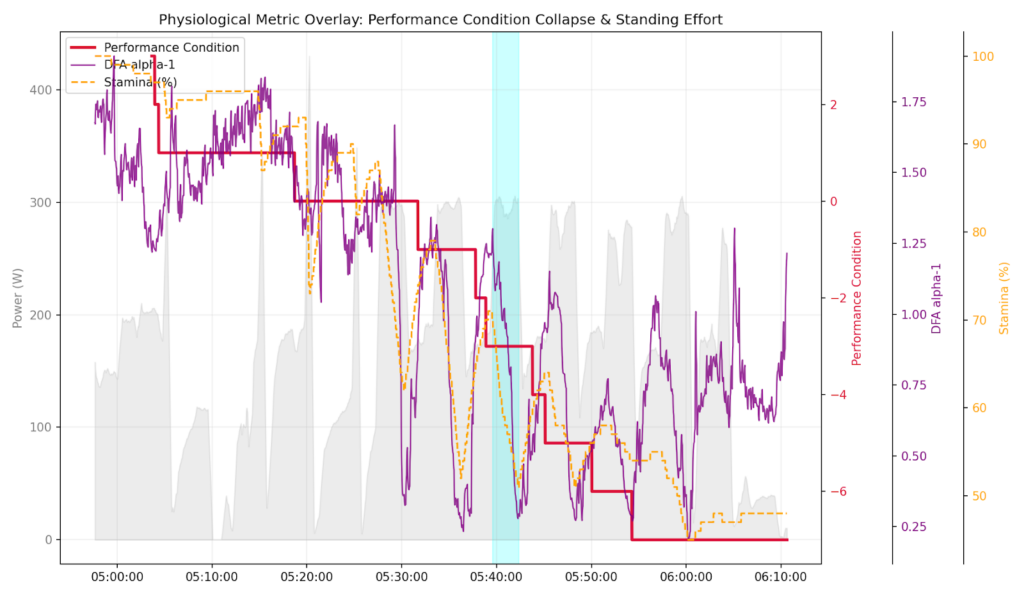 Figure 1: High-fidelity physiological data tracking the linear collapse of Performance Condition (red) and DFA alpha-1 (purple). The cyan box highlights a forced biomechanical shift to a standing effort during the third interval.[/caption>
Understanding Garmin Performance Condition: My Real-Time Efficiency Index
Performance Condition is a real-time assessment of my operational capacity compared to my historical baseline fitness. Powered by Firstbeat Analytics, it analyzes the relationship between my mechanical output (my power in watts) and my internal strain (my heart rate and heart rate variability) during the first few minutes of my ride, and continues updating dynamically throughout my session.
-
- The Scale: A score of +1 to +10 indicates that my heart rate is lower or my HRV is higher than expected for a given wattage—signaling a fresh, highly efficient aerobic system. A score of 0 down to -7 indicates my cardiovascular system is working significantly harder to clear metabolic waste and match my mechanical load.
-
- My Efficiency Index: Unlike static post-ride metrics like Training Stress Score (TSS), using this living data layer acts as my real-time indicator of metabolic strain. My actual Garmin Performance Condition tells me exactly how much metabolic currency my body is spending to produce a specific mechanical output right now.
My Physiology-First Baseline: A Systemic Deficit
The story of my failure started hours before I turned on my Tacx trainer. My physiological bank account was severely overdrawn, turning this workout into an uphill battle before it even began.
My Precondition Matrix: Flashing Red Before My First Interval
Reviewing the multi-layered baseline data reveals exactly why the systems failed:
-
- My Overnight Sleep Score & Sleep Stress: Wearable data from
image_2980ee.pngandimage_29812e.pngsignaled an incomplete recovery window. Autonomic restoration was truncated, leaving my resting parasympathetic system vulnerable.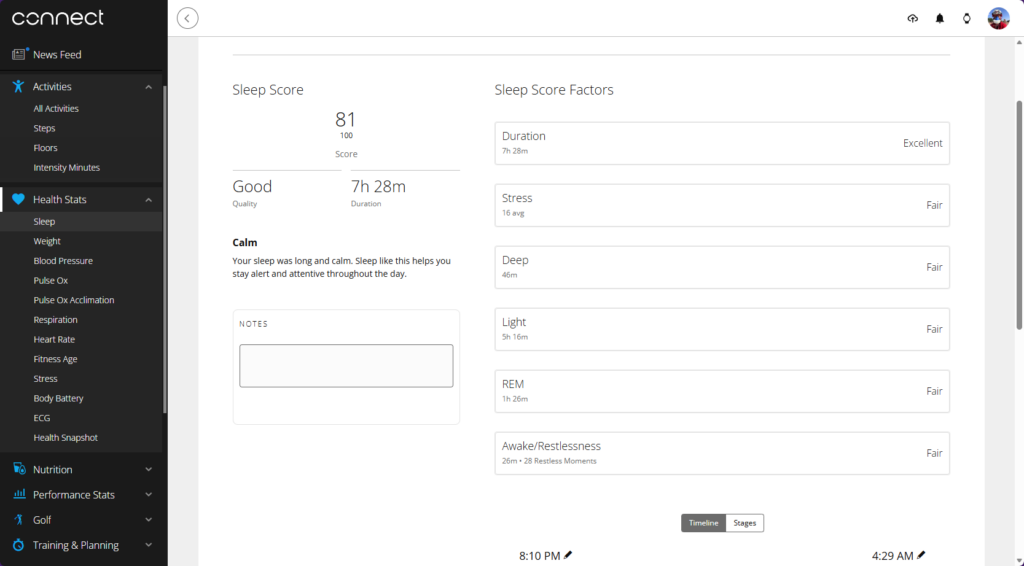
Figure 2: My overnight sleep recovery metrics captured from the Garmin Connect dashboard. While a headline score of 81 is rated “Good,” the individual breakdown reveals “Fair” scores across my autonomic stress, deep sleep, and restlessness indicators, mapping out a pre-ride recovery deficit.
- My Overnight Sleep Score & Sleep Stress: Wearable data from
-
- My Pre-Ride HRV Stress Score (54): Stepping into a high-intensity session with an elevated HRV Stress score of 54 indicates that my sympathetic nervous system was already dominating. The regulatory capacity of my vagus nerve was suppressed.
Figure 3: My pre-ride HRV Stress test score registering at 54 (“Moderate Stress”) on my Garmin watch face. This crucial biometric provided an early warning of a pre-fatigued sympathetic nervous system before I even spun a pedal.
- My Pre-Ride HRV Stress Score (54): Stepping into a high-intensity session with an elevated HRV Stress score of 54 indicates that my sympathetic nervous system was already dominating. The regulatory capacity of my vagus nerve was suppressed.
-
- My Diagnostic Verdict: Under pre-fatigued conditions, the body must work significantly harder to clear metabolic byproducts. Mobilizing glycogen and maintaining my cardiac output becomes far more costly. Consequently, my structural warnings were flashing red before my warm-up even concluded.
Dissecting My Collapse: My 7-Interval Breakdown
By tracking my high-fidelity timeline, I can pinpoint exactly how my system unraveled block by block.
My Intervals 1 & 2: The Illusion of Compliance
Interval 1 (05:27 AM): 287 Watts. Holding at +3, my Garmin Performance Condition initially suggested everything was fine. However, my DFA alpha-1 (α₁) immediately plummeted, indicating instant reliance on anaerobic glycolytic pathways.
Interval 2 (05:33 AM): 288 Watts. The PC index slipped toward 0 shortly after. Seated cadence remained smooth at 89.8 rpm, but internal cardiac drift was accelerating rapidly.
My Interval 3: My Biomechanical Leverage Shift (My Standing Effort)
Interval 3 (05:39 AM): 287 Watts. To maintain my wattage as my aerobic system choked, I had to stand.
The data signature confirms this: my cadence collapsed from its 90 rpm seated baseline down to an average of 69 rpm (bottoming out at 52 rpm), as highlighted in the cyan box.
Standing allowed me to use my body weight to clear my target power, but it leveraged an unsustainable metabolic toll. My DFA alpha-1 (α₁) bottomed out to an extreme floor of 0.25, signaling my total cellular distress. Concurrently, my muscle oxygenation (SmO2) plummeted to a suffocating 10.5%.
My Intervals 4 & 5: My Linear Decline
Interval 4 (05:45 AM): 278 Watts. Real-time efficiency metrics officially crossed into negative territory here, hovering between -1 and -3.
At this stage, my Enhanced Respiration Rate spiked toward 40 breaths per minute. Heavy hyperventilation began as my lungs attempted to compensate for acute metabolic acidosis.
Interval 5 (05:51 AM): 257 Watts. Mechanical power output finally started to fade. Simultaneously, my Garmin Performance Condition sank heavily to a deficit of -5.
My Intervals 6 & 7: Systemic Failure and Forced Bailout
Interval 6 (05:53 AM): 265 Watts. Total structural failure. The tracker plummeted to -6, and my actual Stamina bottomed out at 45%. Even though my heart rate was completely pinned, my working muscles could no longer process the calcium ions required for high-velocity contraction, causing the power to drop.
The final gasp arrived during **Interval 7 (05:57 AM)** at 281 Watts. My Garmin Performance Condition hit -7—the absolute terminal floor of my tracking ecosystem. Looking at my quad SmO2, it was clear my muscles could no longer recover during the rest intervals. Recognizing that continuing to force the effort would only result in severe central nervous system fatigue without any VO2max adaptation, I pulled the plug and bailed.
Can We Reverse a Collapsing Garmin Performance Condition? My View on Dynamic Recovery at VO2max
A compelling question in my data-driven cycling coaching philosophy is whether we can use a declining Garmin Performance Condition to create dynamic intervals—adjusting targets on the fly to improve our score or reverse the decline.
At lower endurance or tempo intensities (Zones 2 and 3), my experience shows the answer is sometimes yes. Dropping my power by 10–15% can allow my heart rate to settle, lowering my internal-to-external strain ratio, and stabilizing my PC score.
However, at high intensities like my VO2max intervals, I cannot reverse a plummeting PC score. Once my score hits a terminal downward trajectory during a high-intensity block, it signifies that my cellular homeostasis has collapsed. My autonomic nervous system is entirely pinned in a fight-or-flight response, and my stroke volume cannot keep pace with my systemic fluid drift.
Altering my workout by “dropping the watts” to crawl through my remaining intervals yields zero positive physiological adaptations:
- Lost Stimulus: I fail to achieve the required time above 90% of my VO2max.
- Extended Recovery Deficit: I dig a massive autonomic hole that compromises my next 48–72 hours of training.
- Injury Risk: My biomechanical coordination degrades rapidly under my severe central nervous system fatigue.
My Physiology-First Philosophy: Knowing When I Need to Cruise In
When my pre-ride biometrics (my HRV Stress of 54) align with my rapidly collapsing real-time metric (my PC moving from +3 to -7), cutting my workout short and cruising in is my mathematically superior coaching choice.
True high-performance coaching requires accountability with a human in the loop. It means looking past my raw grit, putting my ego aside, and respecting the hard limits shown by my data. I spin my pedals light, clear my lactate, and live to fight another day.
Have you been paying attention to your Performance Condition during intervals? Look for your own standing signatures and structural cliffs in your Garmin Connect files.
 Figure 6: Out on my backyard testing grounds—Peavine Mountain in Reno, Nevada.
I’m the only coach in the world who is melding the powerful metrics of the Garmin Ecosystem with Group Fitness Programs. This is available LIVE, 5-6 days a week. Classes roll at 0500 PST.
![]()
Garmin Products are the most advanced sport and fitness metrics in the history of the world. But there’s a gap between the DATA they provide, and the KNOWLEDGE we can gain from this information. If you’ve got questions, I’ve got answers. Sign up for a consult, and let’s look at your data together. No AI necessary! 🙂