Garmin Recovery Metrics: When “Life Stress” Becomes a Physiological Debt
Coach Richard Wharton
Published: May 11, 2026
Understanding your Garmin recovery metrics is the only way to stay objective when non-training stress starts to bleed into your performance. Following our May 5th deep-dive into what those orange bars actually mean during sleep, today I’m showing the cold, hard reality of how these metrics track a systemic collapse driven by manual labor and poor recovery.
Analyzing the 28-Day Slide in Garmin Recovery Metrics
Physiology doesn’t care about your training plan; it only cares about homeostasis. Over the last month, the manual labor I’ve been putting in has acted as a “shadow workout.” While these activities don’t always show up as a “Ride,” the internal physiological measurements certainly track the damage in the trends.
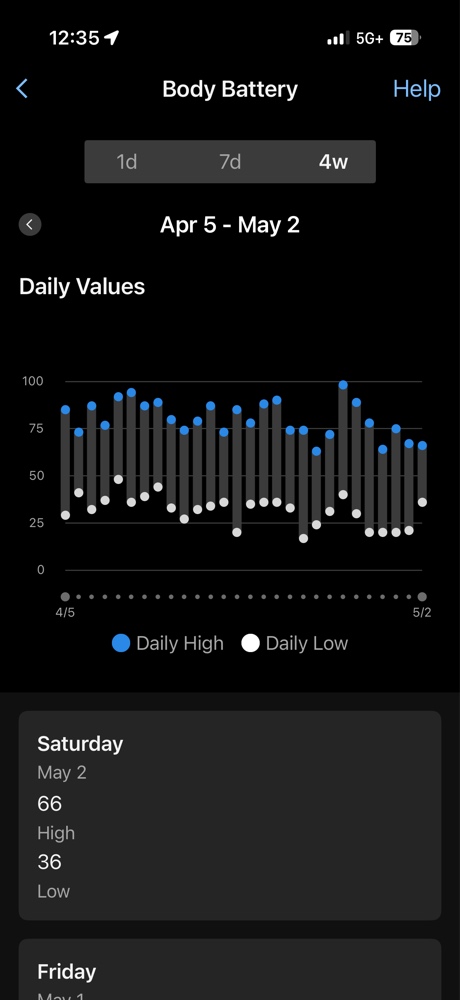
When your Body Battery fails to reach a full charge for weeks at a time, you are living on credit. As you can see in my 4-week timeline, my system is starting every single morning with a “half-empty tank.” This affects everything from my professional driving focus to my ability to coach effectively in Reno.
How Garmin Recovery Metrics Reveal the Sleep Score Illusion
Last night was the perfect case study. If you just looked at the clock, you’d think I was doing great. I hit nearly 8 hours of duration—a number any athlete should be happy with. But the physiology told a different story.
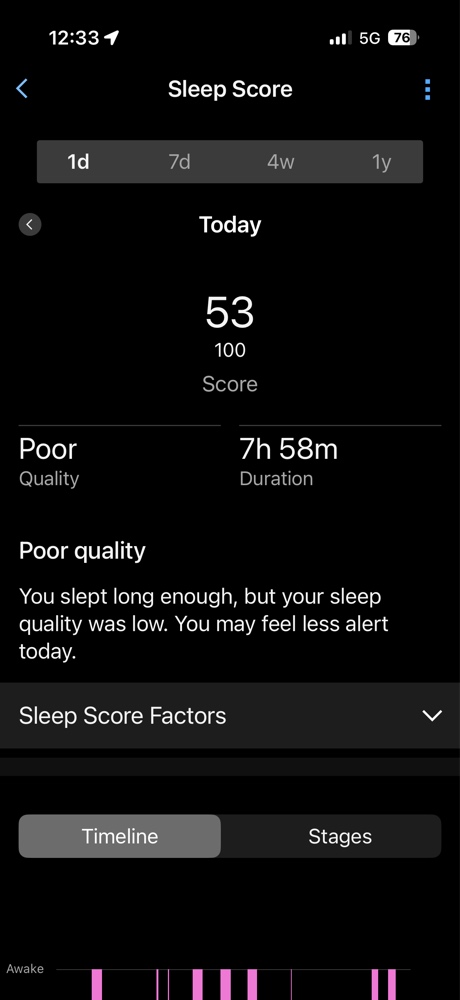
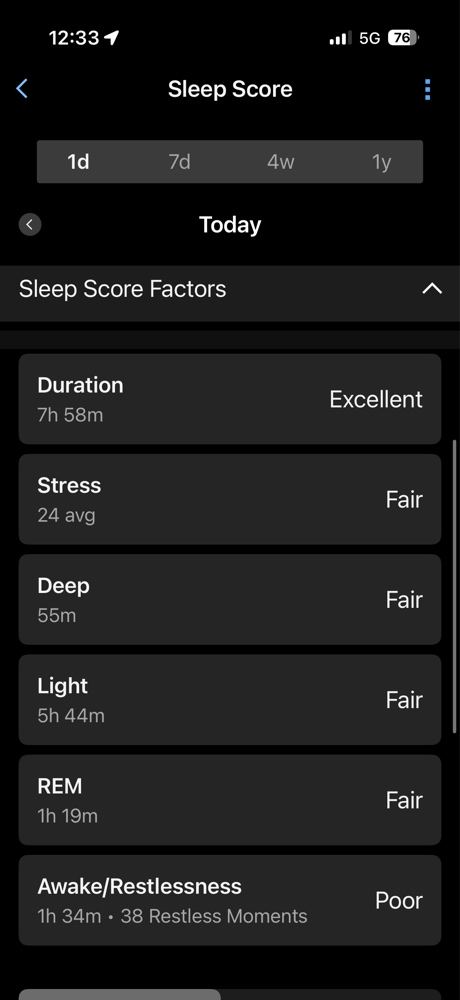
The “orange bars” we discussed in the last post were out in full force. Despite 8 hours in bed, I had 38 restless moments and over an hour and a half of “awake” time. Because my sympathetic nervous system was still “vibrating” from the day’s labor, my parasympathetic system—the “rest and digest” branch—couldn’t take the wheel. I gained +45 Body Battery points, but it was shallow, low-quality recovery.
The “Recovery Debt” Collection: 52 Hours
Last Thursday, I made the mistake of trying to force a sprint workout. I thought some high-intensity work might “wake up” the legs. It was the final straw for my nervous system. These Garmin recovery metrics are essentially a smoke detector for overreaching.
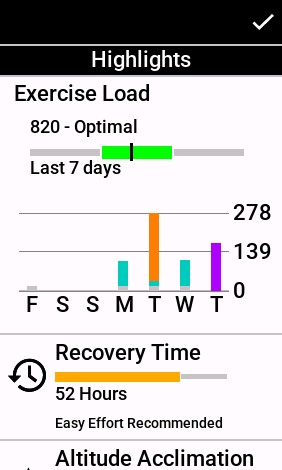
Normally, a session like that might require 24 hours. But when you are already in a deep physiological hole, the cost of intensity triples. This has a massive ripple effect: **my race prep is now officially delayed.** I cannot build VO2max or anaerobic capacity on a foundation of systemic exhaustion.
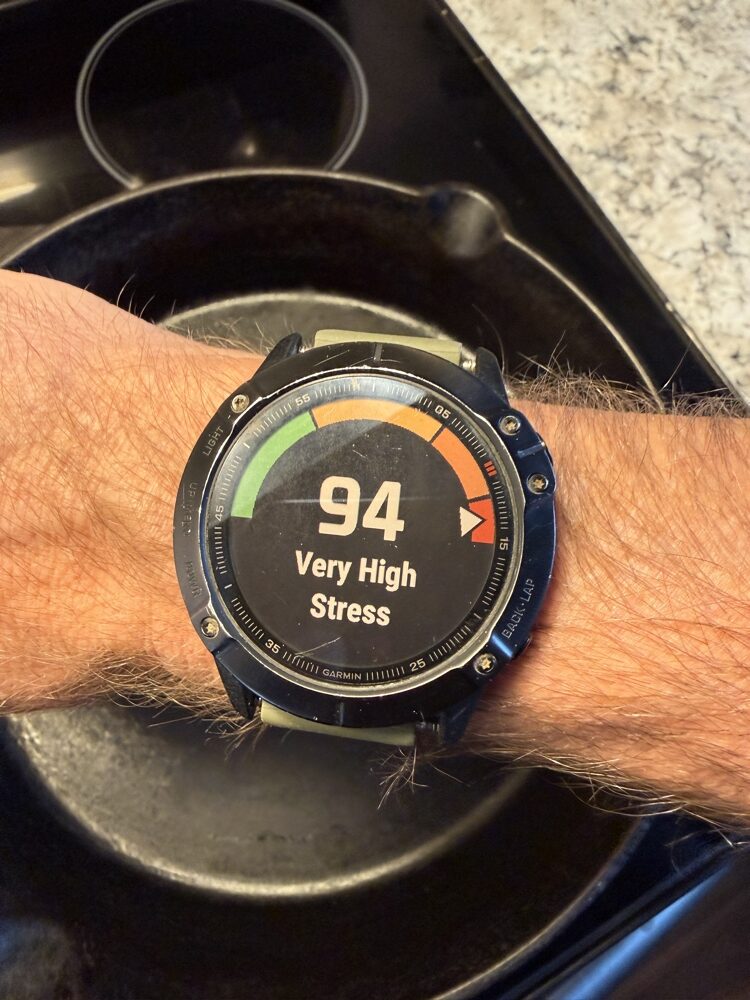
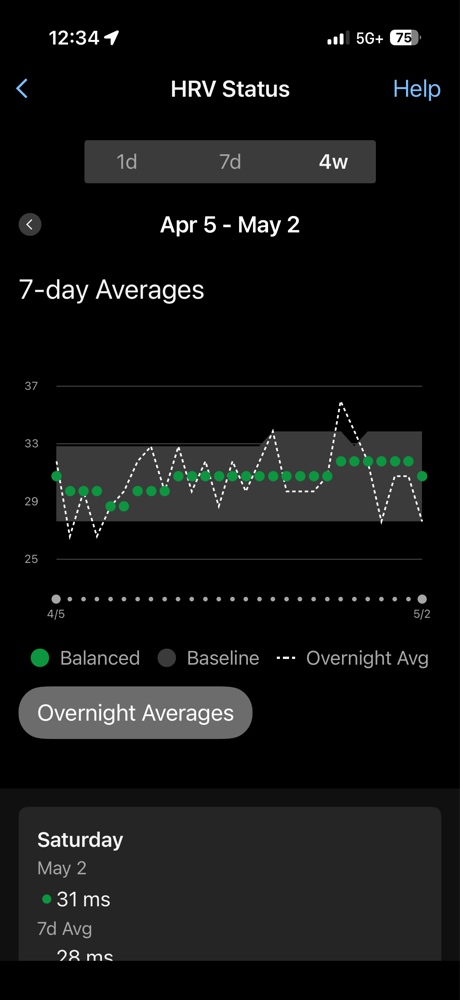
HRV Stress 94: The Ultimate Garmin Recovery Metric
To understand why that recovery time is so high, look at my HRV Stress. This is a snapshot of the battle between your sympathetic and parasympathetic systems. I am currently sitting at a 94—Very High Stress.
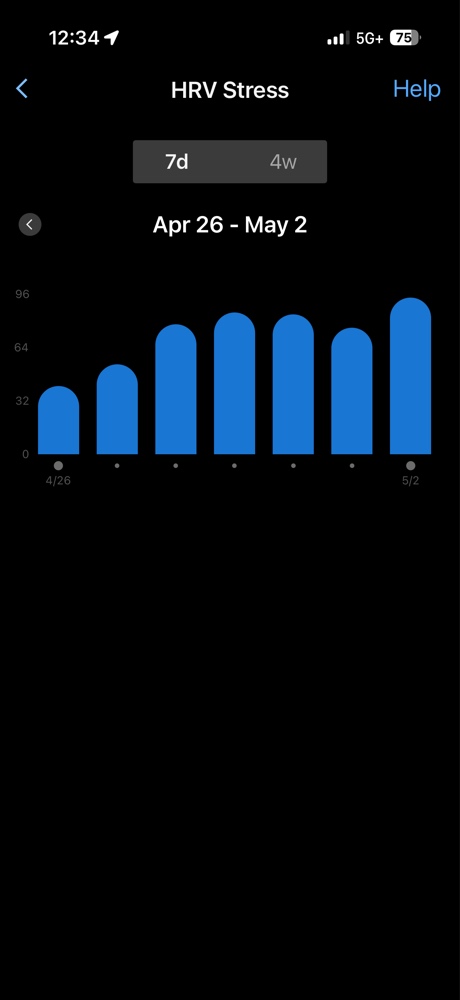
My overnight HRV has dipped to a 7-day average of 28 ms. For someone focusing on a “Physiology First” approach, as championed by Dr. Bruce Rogers, this is the ultimate red light. My baseline is crumbling because the manual labor is preventing the parasympathetic system from doing its job.
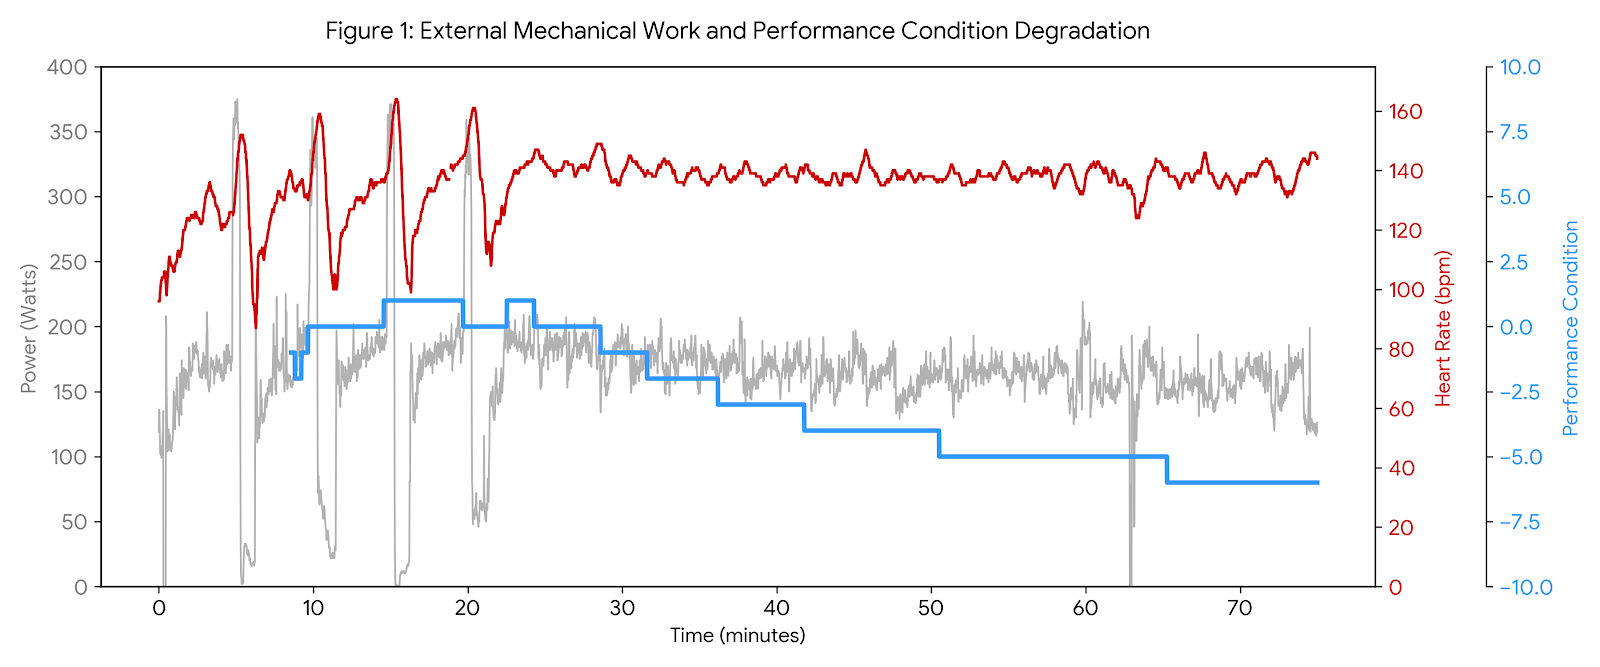
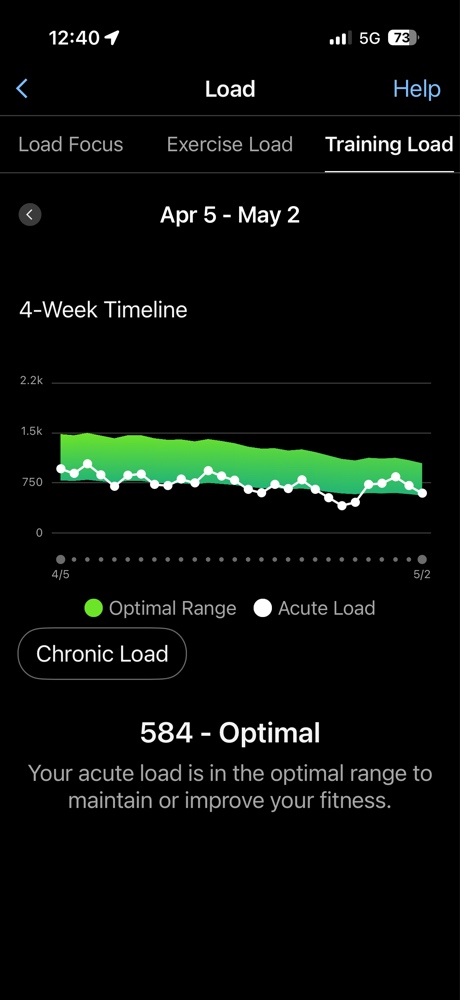
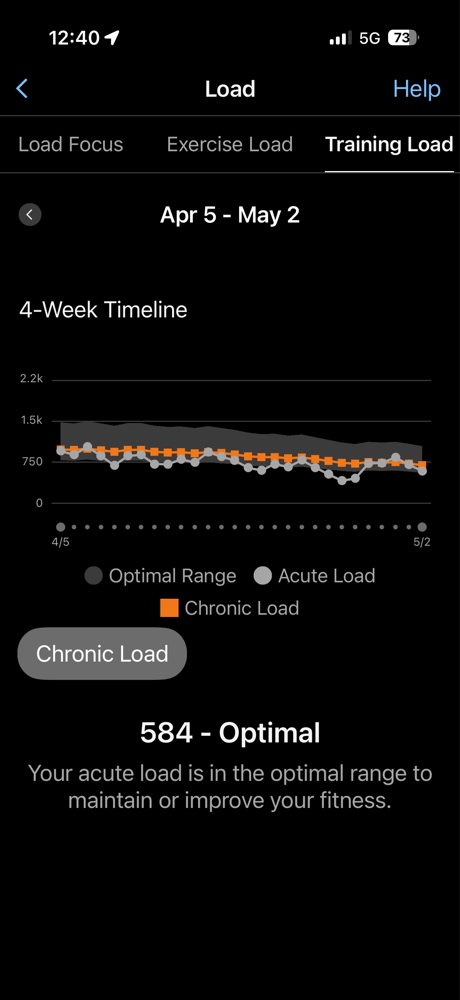
Volume Decline: Respecting the Data
Finally, let’s look at the training load. My Acute Load has dropped to 584. To an outside observer, it looks like I’m tapering or losing fitness. But look at the Chronic Load trend—it’s a steady decline because I’ve had to take significant time off, including this past Friday through Sunday.
The Lesson: Recovery is a Workout
As a coach, I have to be the first person to follow the data. We often think of training as the only “work,” but right now, Recovery is the workout. Sleep is the workout. Understanding your Garmin recovery metrics is the only way to train effectively for the long term.
Until my HRV Stress drops below 30 and my Sleep Score returns to “Good,” I will not be attempting any high-intensity work. I’m going to take several days of complete rest once this manual work is done to reset my physiology. Don’t be afraid to delay your plan when your body issues a debt collection notice. The bike will be there when the orange bars finally disappear.
If you want to stop guessing, it’s time for a physiological deep dive. Join me for LIVE Classes. Sign up today.
Sign Up for LIVE CLASSES HERE! Join my VQ Velocity Virtual Studio!
Enjoyed this deep dive into Garmin recovery metrics? Consider supporting the lab!