Billat 30-30 Physiology: Why Garmin Stamina Contradicts the SmO2 Test
By Coach Wharton
April 29, 2026
1. The Performance: Analyzing Billat 30-30 Physiology
The session consisted of three blocks of 10 reps, progressing from 110% to 120% of threshold power. Based on the metrics, this represents a standout 30-minute effort for the year. With a Skiba’s xPower of 259.1 W sustained for nearly half an hour, this effort suggests a significant shift in my Critical Power (CP).
Coach’s Insight: While standard metrics focus on the watts, the “Physiology First” story is written in the blood.
2. METs vs. Garmin: Proving the VO2max Range
Garmin’s training effect algorithm labeled this a “Threshold” session. However, metabolic physics suggests otherwise. By using the MET (Metabolic Equivalent) calculation, we can estimate the actual oxygen cost of the effort.
At the peak intervals of 346 W, the metabolic demand reached 16.0 METs. This means my body was consuming oxygen at 16 times its resting rate. For an engine with a VO2max of 59, this translates to roughly 56 ml/kg/min—or 95% of my absolute ceiling.
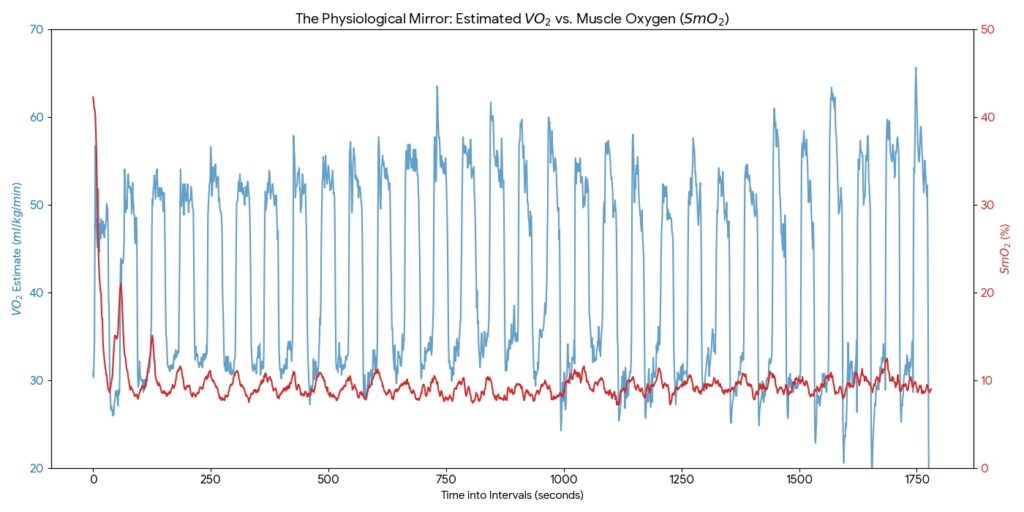
3. The “VO2 Lag”: Understanding the SmO2 Curve
The behavior within the 1-minute rep windows provided striking evidence of intensity. In physiology, VO2 kinetics describe the delay in oxygen consumption at the start of an effort. We see this mirrored in the “SmO2 Lag.”
When looking at the 1-minute windows (30s ON / 30s OFF), you can see that even after stopping a 350W effort, muscle oxygenation does not immediately recover. In fact, for the first 3–5 seconds of the “rest,” SmO2 often continues to drop or stays pinned at its floor. This is Oxygen Debt in action.
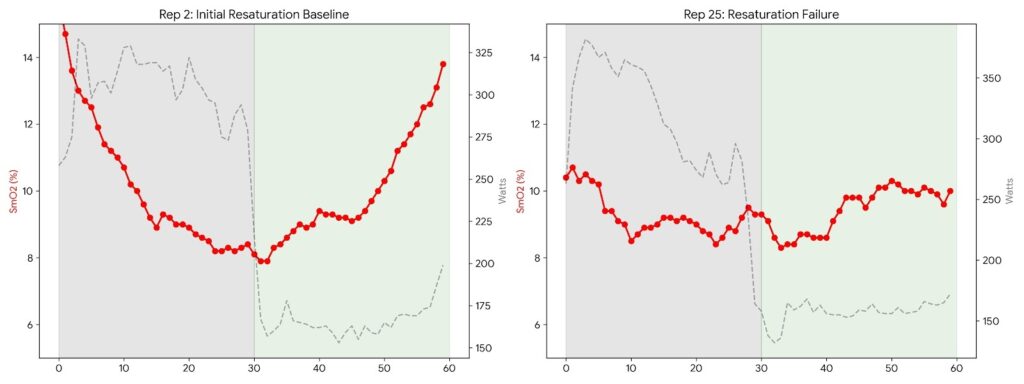
- Early Reps: In Rep 2, the muscle crashed to 8.2% but “bounced” back to 13.8% during the rest. The lag was present, but recovery was healthy.
- Late Reps: By Rep 25, the lag became permanent. Despite dropping to 160W, SmO2 was trapped. The resaturation delta dropped from 5.6% at the start to just 1.2%.
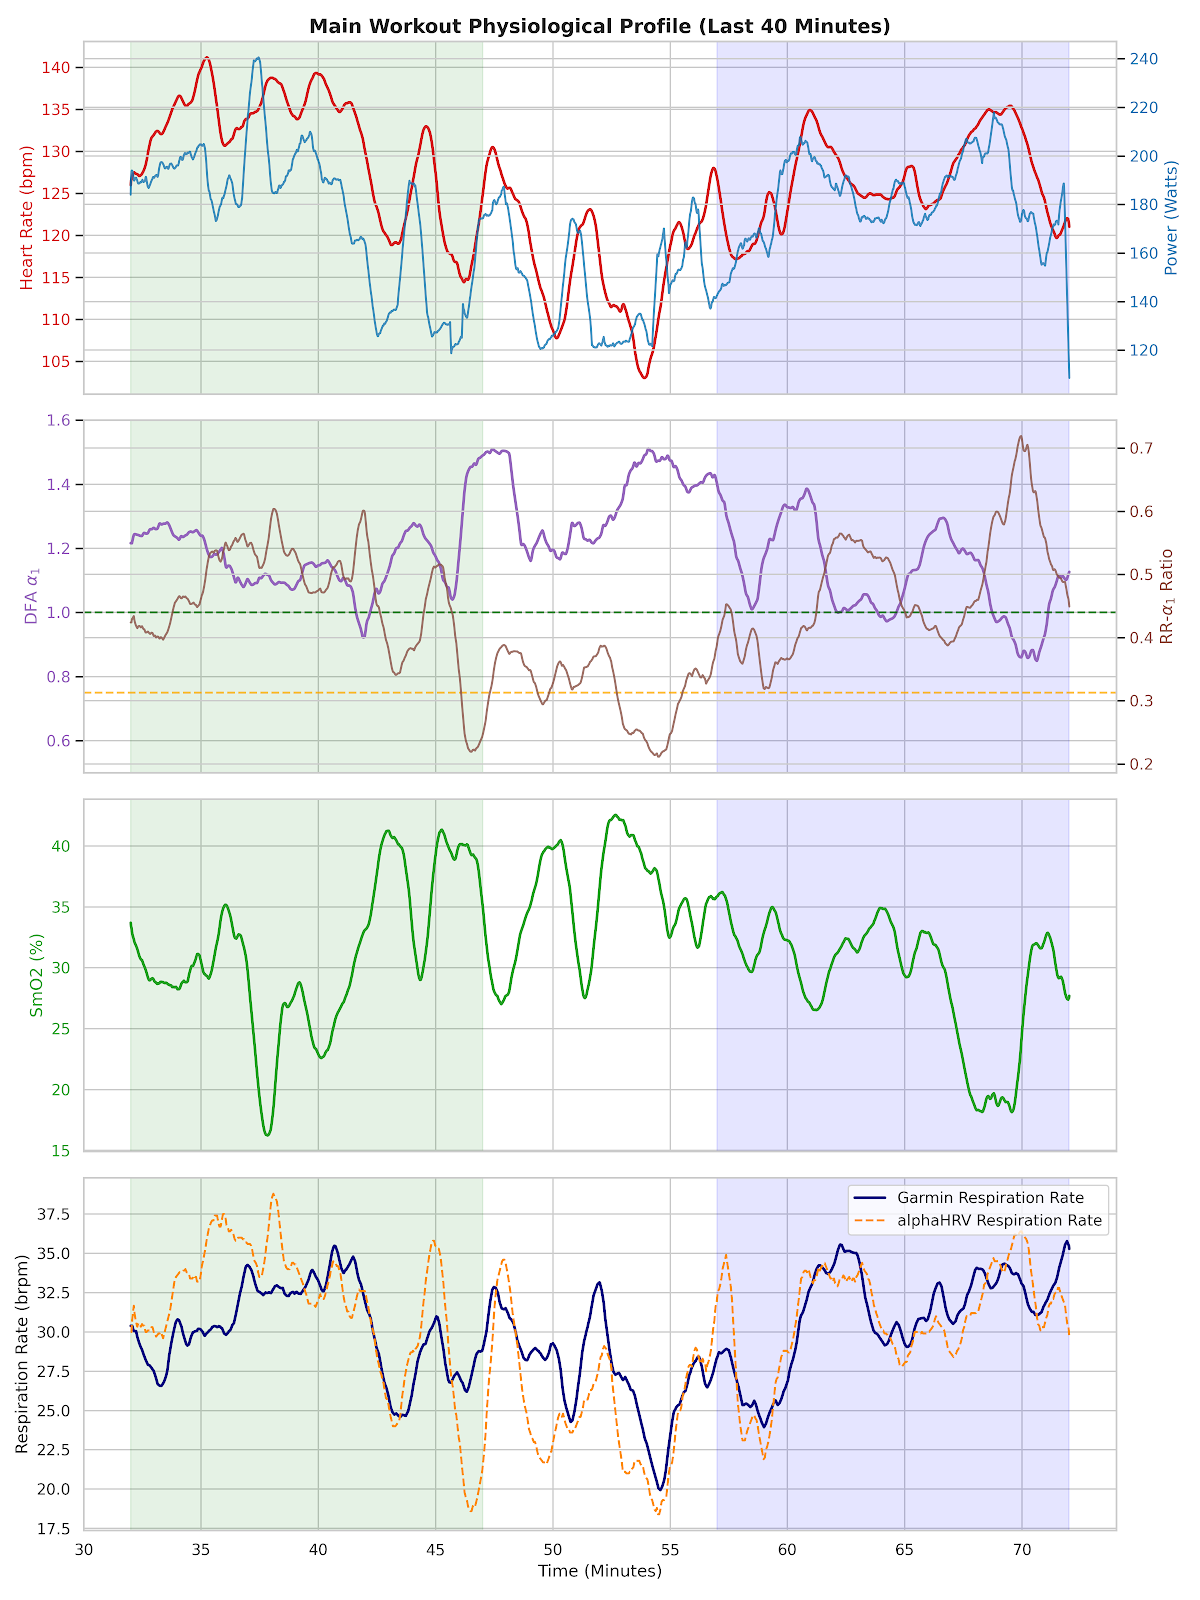
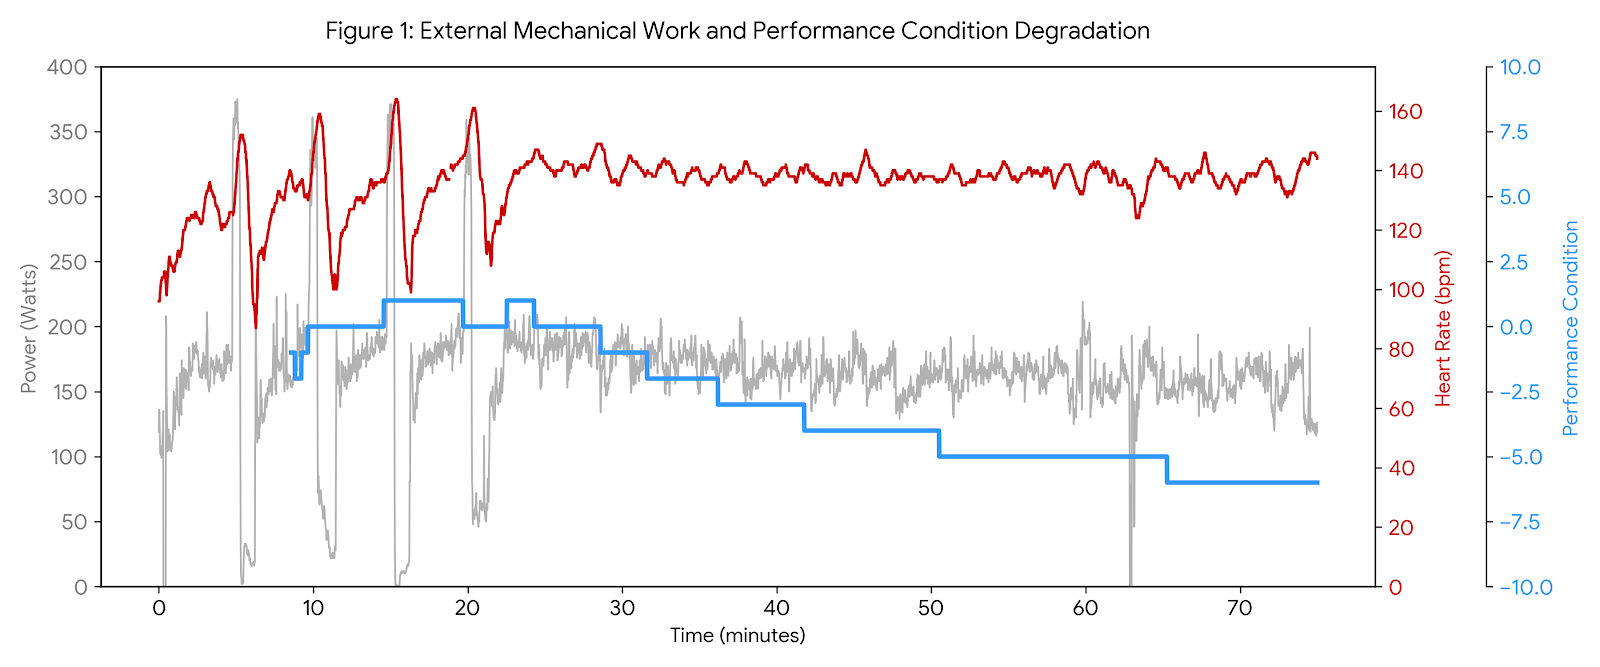
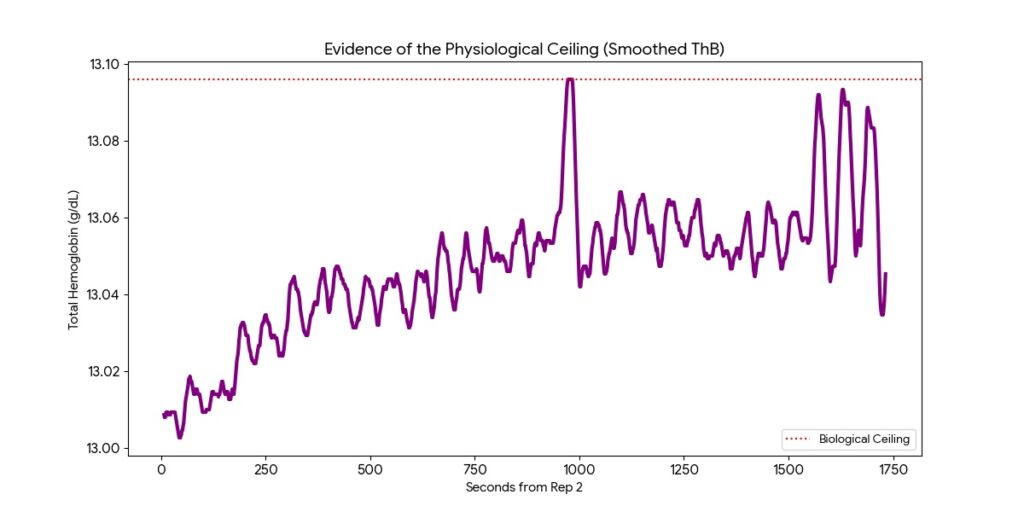
4. Billat 30-30 Physiology: The ThB Ceiling and the “Standing” Glitch
Total Hemoglobin (ThB) measures the blood volume in the capillary bed. During this session, the smoothed data revealed a hard Biological Ceiling at 13.10 g/dL. Once my body reached this point of maximal blood recruitment, it could not deliver a single drop more to the quads.
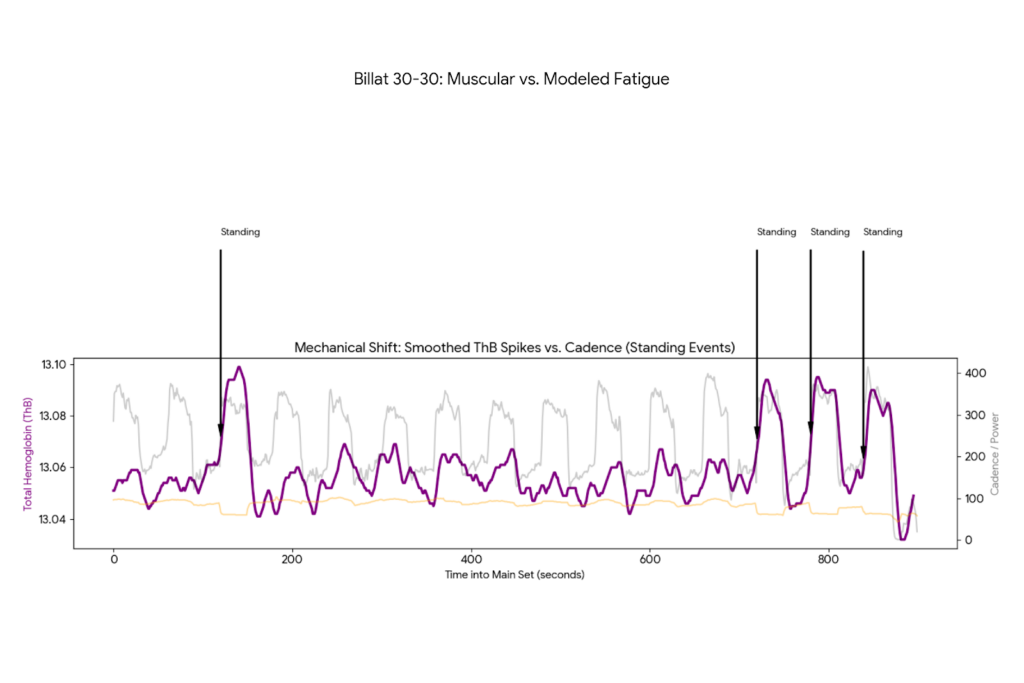
Interestingly, I stood up four times during the set. This mechanical shift is a critical observation for anyone studying Billat 30-30 physiology. At the exact moment blood volume hit the ceiling and cadence dropped, the Stamina metric stopped falling and actually began to rise.
5. Final Session Stats (Intervals 2–30)
| Metric | Performance Data |
|---|---|
| Main Set xPower | 259.1 W |
| Max Effort METs | 16.0 |
| Average Heart Rate | 163 bpm (Range: 145-173) |
| Respiratory Rate Max | 42 breaths/min |
| SmO2 Session Floor | 7.2% |
| ThB Biological Ceiling | 13.10 g/dL |
If you want to stop guessing, it’s time for a physiological deep dive. Join me for LIVE Classes. Sign up today.
Sign Up for LIVE CLASSES HERE! Join my VQ Velocity Virtual Studio!
Enjoyed this deep dive into Billat 30-30 physiology? Consider supporting the lab!