Why My Garmin Labeled This SmO2 Threshold Training as VO2 Max
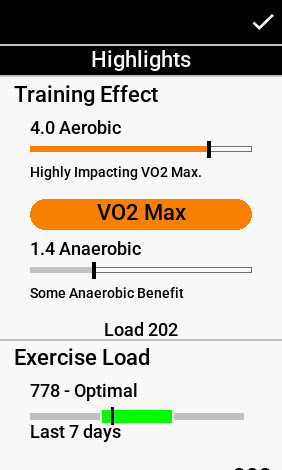
After the ride, the Garmin 1040 flashed a VO2 Max benefit rather than a “Threshold” or “Tempo” result. For a Physiology First athlete, this might seem like an error, but it’s actually the algorithm working exactly as intended.
Garmin’s Firstbeat analytics look at the relationship between power output and heart rate. Because I was talking and coaching throughout the intervals, my heart rate drifted significantly higher than the power alone would suggest—resulting in an 18% aerobic decoupling. Even though the power was in a threshold range, my heart rate was in the “red zone,” causing the device to interpret the session as a VO2 Max effort. This drift is a direct byproduct of the internal stress I was managing while directing the session.
Decoding the SmO2 Threshold Training “Life Raft”
When I am coaching at the limit, I can’t always wear a gas exchange mask. That’s where SmO2 (Muscle Oxygen Saturation) and AlphaHRV become my eyes. If you aren’t familiar with how I use these sensors, check out my Essential Guide to SmO2 Training.
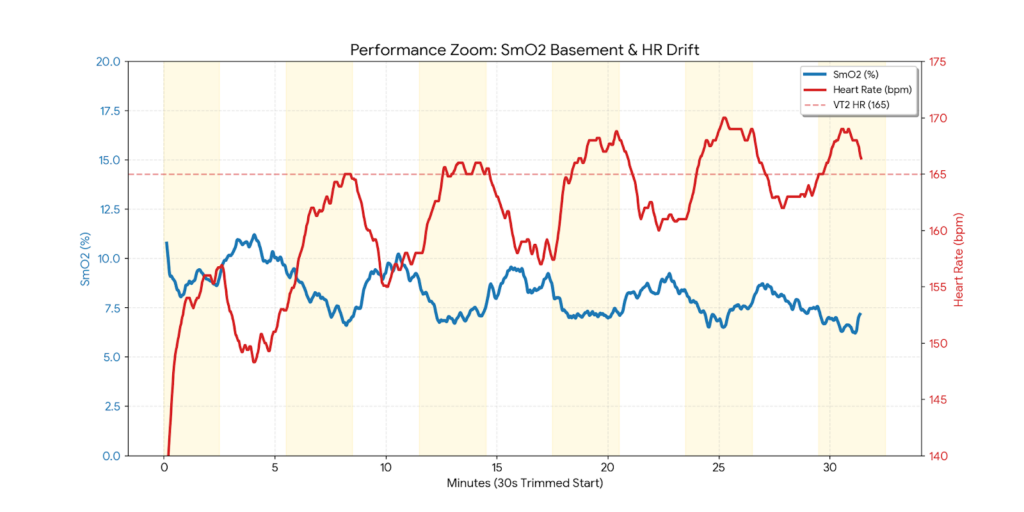
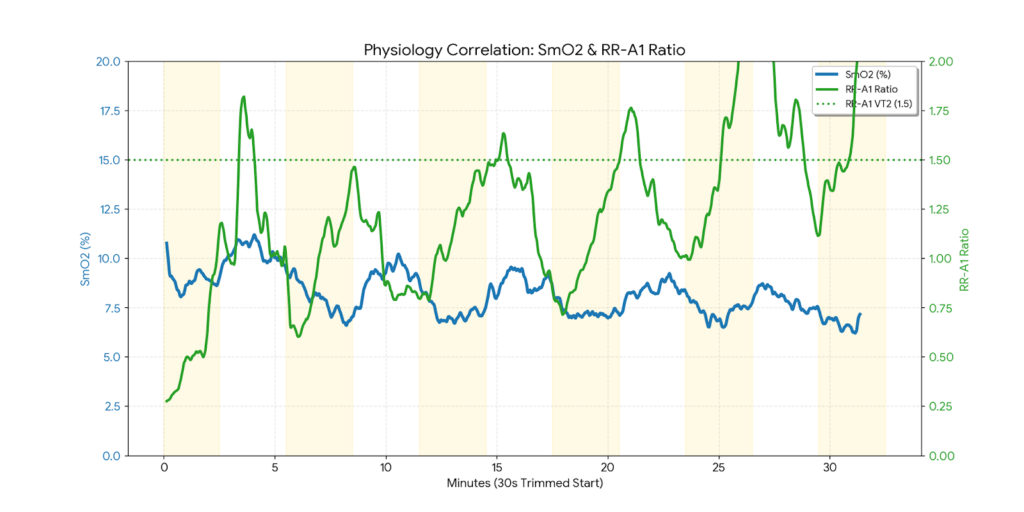
During the “Over” portions, my SmO2 dropped into the basement, pinning itself between 8% and 10%. In the “Under” portions, I saw what I call the 2% Life Raft. The SmO2 didn’t “recover” in a traditional sense; it simply stabilized or rose by a tiny fraction. Mentally, that tiny shift was enough to signal my brain that the muscle wasn’t failing, allowing me to keep the power on the pedals despite the profound lack of oxygen.
The Autonomic Response: RR-A1 and Alpha-1
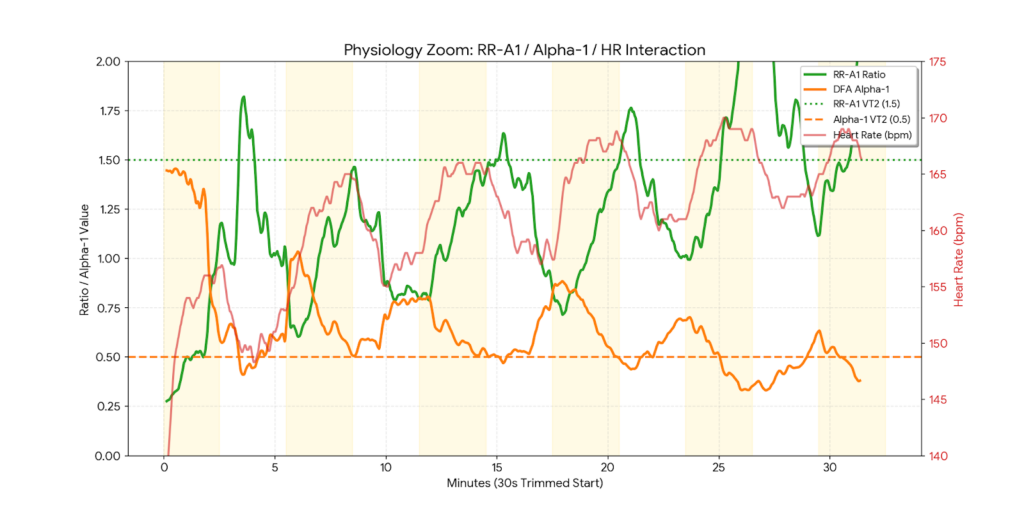
I also tracked the RR-A1 ratio (Respiration Rate / DFA Alpha-1). Following the groundbreaking research and discussions led by Dr. Bruce Rogers, I look at two critical markers for my intensity thresholds:
- VT1 (Aerobic Threshold): A ratio of 1.0.
- VT2 (Anaerobic Threshold): A ratio of 1.5.
As the 30-minute block progressed, the RR-A1 ratio surged. In the final sets, it consistently crested the 1.5 marker, signaling that my ventilatory drive was maxed out. My DFA Alpha-1 stayed pinned below 0.5, confirming that my autonomic nervous system was under heavy stress—partly from my legs, and partly from the “Coaching Tax” of managing my client’s needs in real-time.
Estimating the Load: METS and VO2
Even without my VO2 Master data today, the physiological load can be calculated. Based on a 13.5 METS average for the 32-minute interval part, my estimated VO2 was approximately 47 ml/kg/min. Given that I tested at a 59 VO2max earlier this week, operating at ~80% of my max capacity for 30 minutes while simultaneously directing a workout is a massive win for my metabolic durability.
Why I Feel Good About This SmO2 Threshold Training
It is easy to get frustrated when the “perfect” data isn’t there, or when a client leaves a session early. But looking at the numbers, this was my highest 20 and 30-minute power output in three months. I feel good because the data proves I can maintain threshold power even when my local oxygen is at 8% and my autonomic system is under dual-task stress.
For my clients in the VQ Velocity room: you should feel good knowing that the intervals I build aren’t just random numbers. I am practicing the exact metabolic management you need to survive. When you see your coach working in the SmO2 basement alongside you, it’s proof that my system works.
Join My Virtual Studio
Ready to dive deep into your own physiology? Join me for live coached sessions that prioritize your biology over your ego.
Visit the VQ Velocity Virtual Studio
If you liked this blog post, and you feel it was worth your time, please support my work by clicking here. Thank you!