Garmin Guru Deep Dive: Decoding the Internal Response to 4-Minute VO2max Intervals
Today’s session of 4-minute VO2max intervals was a masterclass in why I lead with physiology, not physics. As the Garmin Guru at Online Bike Coach, I’m constantly looking for the “truth” behind the numbers. Today, that truth was found in gas exchange and muscle oxygenation, while my power meter and Garmin’s “Performance Condition” tried to tell a different story.
Part 1: The Anatomy of a “Green Light” – Pre-Ride Prep
I don’t believe in guessing. In my Physiology First coaching practice, “listening to your body” means measuring it. Before I even swung a leg over the bike, my Garmin ecosystem gave me the physiological “all-clear” for this high-intensity mission.
My Metrics of Readiness:
- Sleep Quality: An Excellent 91/100. High-quality sleep provided the neurological recovery required for the aggressive 4-minute VO2max intervals ahead.
- HRV Status: My 7-day average remains Balanced (31ms), proving my system is ready to absorb a severe training load.
Part 2: The Physiology Truth of 4-Minute VO2max Intervals
Today’s session was the ultimate proof of why I quit chasing watts. If I had judged my success by power alone, I would have been discouraged by the drop in my fourth set. Instead, my gas exchange data shows I crushed the effort.
The Physiology Stack: Consolidated 5×4 View

Interval Effectiveness & Kinetics of 4-Minute VO2max Intervals
The goal was to maximize my time above 50 mL/kg/min of $VO_2$. Across 20 minutes of work, I achieved 13.6 minutes at or above that target.
| Set | Time to 50 VO2 (s) | Time ≥ 50 VO2 (s) | Avg VO2 | SmO2 (%) | Power (W) |
|---|---|---|---|---|---|
| 1 | 101 | 140 | 52.3 | 6 | 280 |
| 4 | 45 | 196 | 53.8 | 7 | 245 |
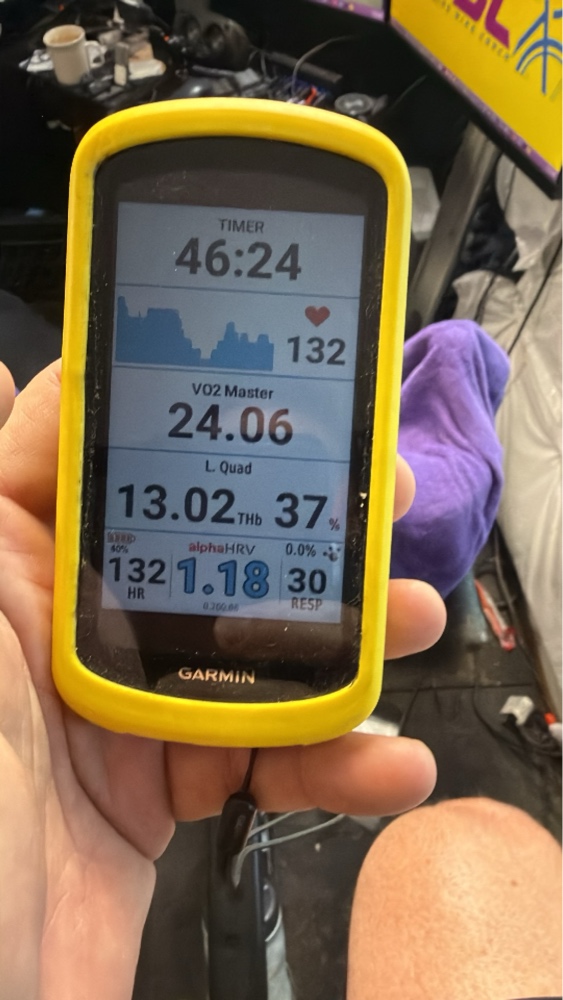
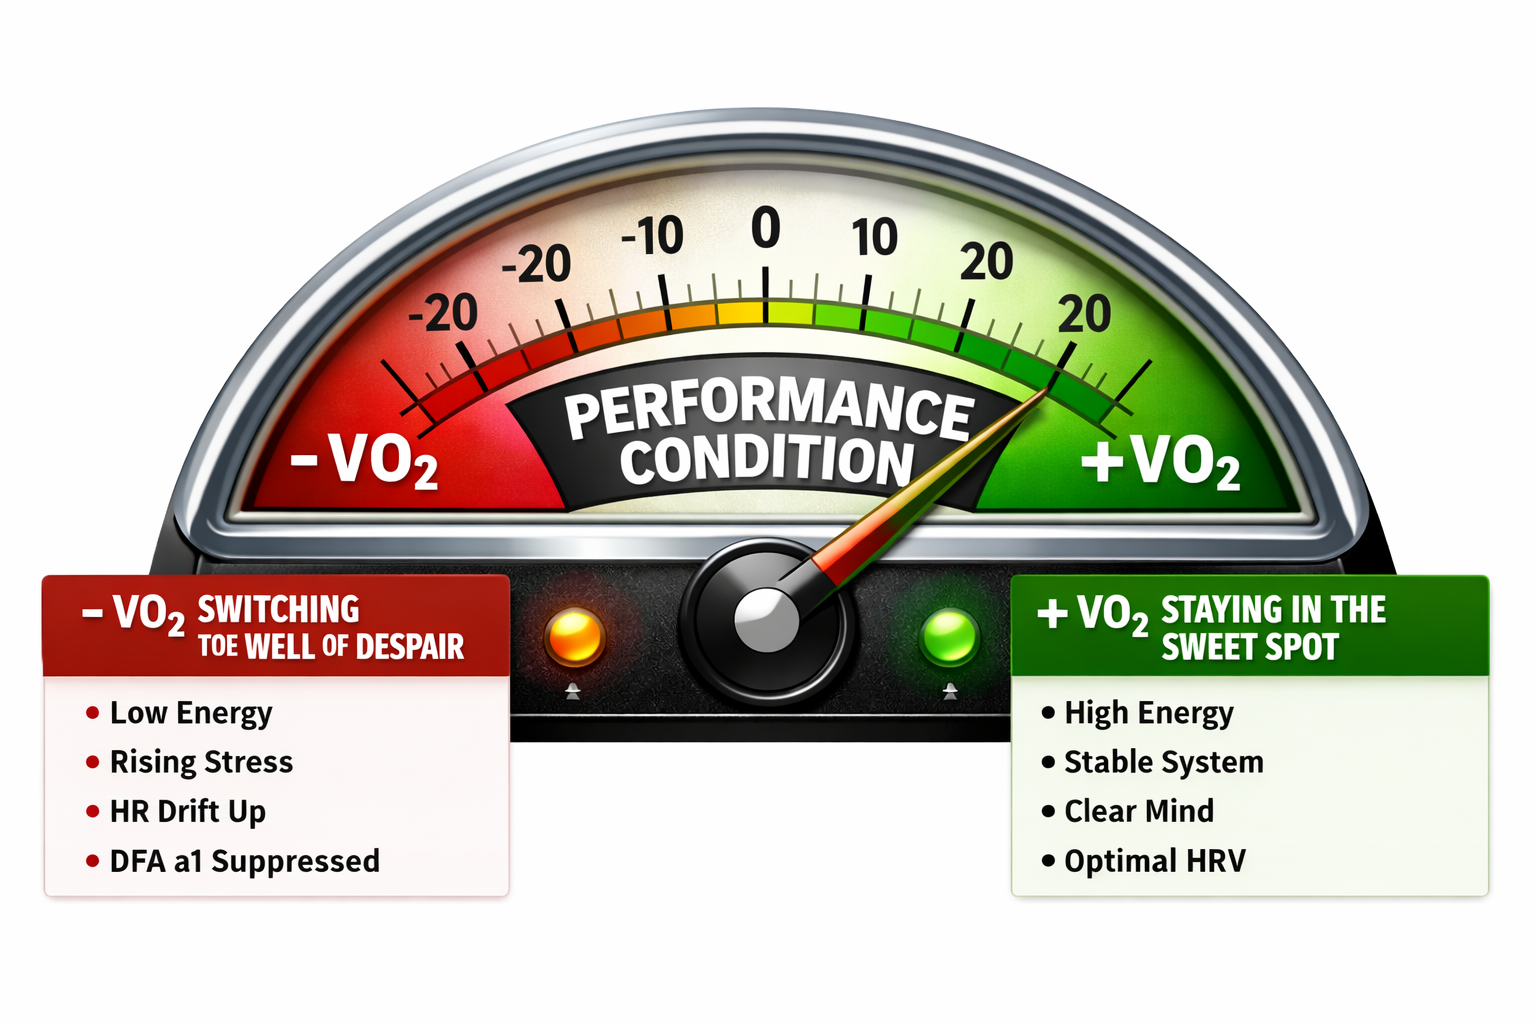
The “Performance Condition” Mismatch
During the ride, my Garmin 1040 gave me a Performance Condition of -9. Because my heart rate stayed high while my wattage “floated” down, Garmin’s algorithm interpreted this as a lack of fitness. This is the “Physics Trap”—Garmin’s calculation doesn’t account for the VO2 Slow Component.
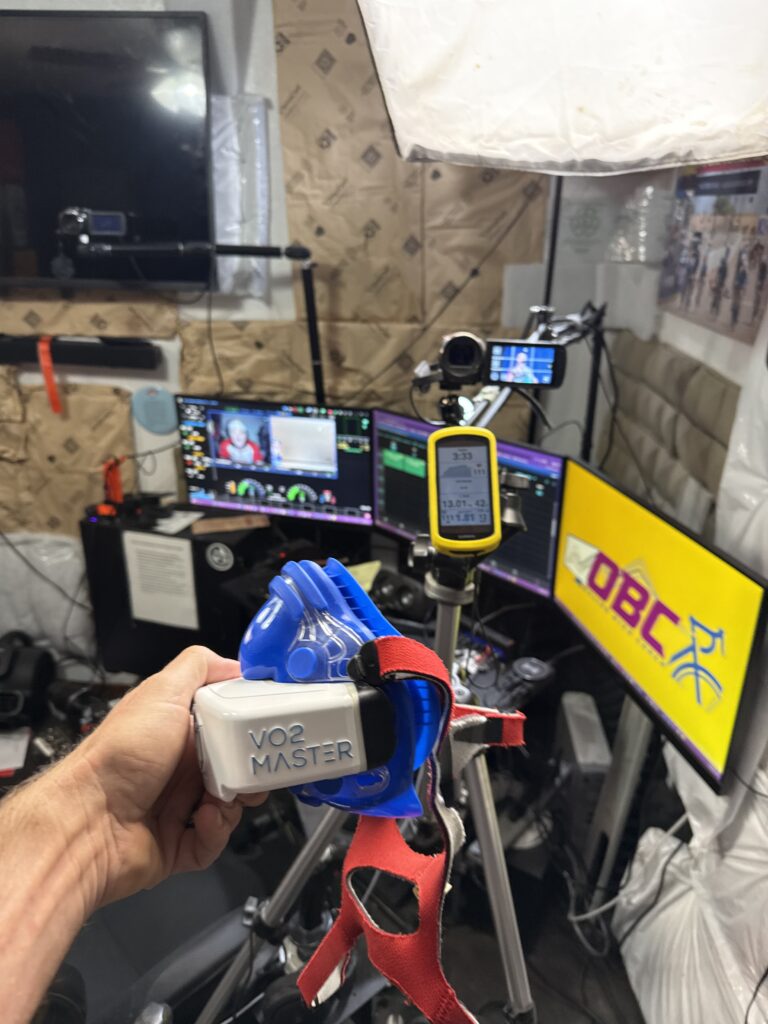
The 6% SmO2 Floor
My Moxy sensor confirmed I was in the “severe” domain with a 6% floor. This is the gateway to a true $VO_2max$ breakthrough.
Advanced Demand vs. Supply: The Gear Shift
Notice how my Smo2 dipped to 5% in the first 1/3 of the 4-minute VO2max intervals. I shifted gears and backed off the wattage, letting it rise just 1% to save the set.

Conclusion: Physiology Over Physics
Focusing on $VO_2$ above 50 during these 4-minute VO2max intervals allowed me to ignore the wattage and hit a new 30-second peak of 59.03 mL/kg/min. Thursday, we tackle Threshold intervals to observe Stamina decay and reconstitution.

Join my VQ Velocity classes every morning at 0500 PST for individualized training in a live group setting.