Xert Time-To-Exhaustion – Introduction
The Xert Time-To-Exhaustion, Time-To-Recovery Field is one of the most powerful, yet least-understood or used Fields in the Xert Ecosystem. But when you use it correctly, it can be one of the most powerful tools on your Garmin head unit.
What Is the “Time-To-Exhaustion” Xert Field?
The Xert “Time-To-Exhaustion” Field (TTE) is a little-understood field that performs a couple of functions. It can be found in the Garmin Connect App Store.
Primarily, enter a known wattage in the “TTE” setup, and another known wattage in the “Time-To-Recovery” Field (TTR). Then install the Field on your Garmin Profile. When the phone syncs with the head unit, the field will populate two times. The “TTE” time will show how many minutes a seconds a cyclist has until their MPA (and High Intensity Energy – HIE) is exhausted, and the “TTR” will show how many minutes at a certain wattage are required for the athlete to recover.
Alternatively, there’s another setting. You can enter a known MPA as a “Floor”, and another known MPA as a “Ceiling”, Then, when you ride at ANY intensity, it will count down the time to reach that MPA, and then count down the time required to hit that MPA Ceiling for recovery.
This is a GREAT TOOL for a lot of reasons!
Scenario #1
I’ll use myself for the first example.
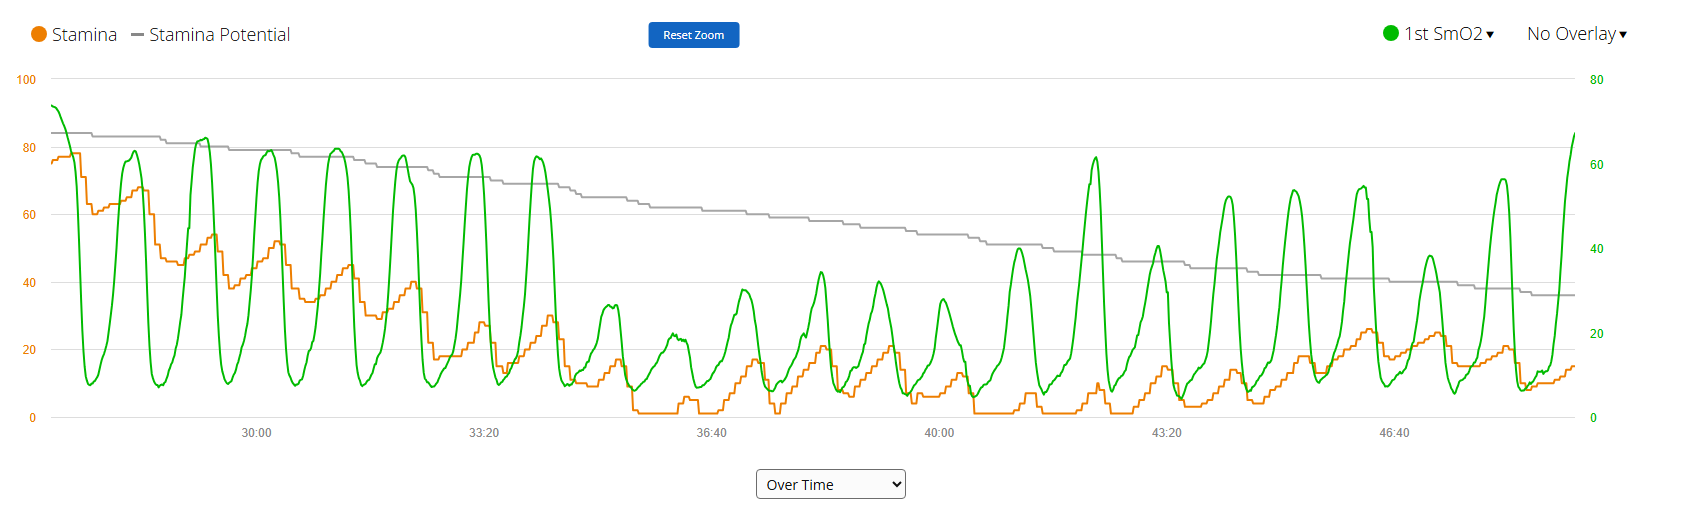
Yesterday, I performed a series of 30-second intervals that were designed to DEPRESS my MPA (Maximum Power Available).
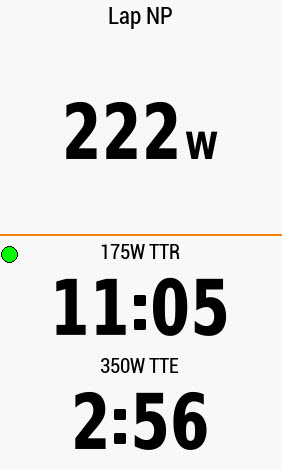
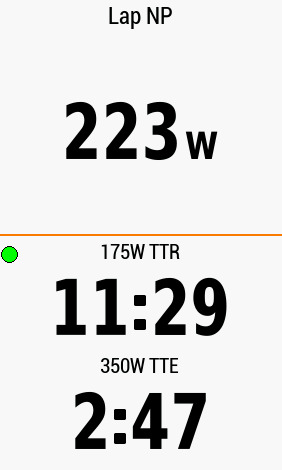
I set the Wattage Values in the Xert Time-To-Exhaustion (TTE) and Time-To-Recovery (TTR) Fields at “350 Watts”, and “175 Watts, respectively. This means that the Xert Field, once aligned with my current Fitness Signature, gave me a “Clock” that displayed how much time and energy I had remaining in my “High Intensity Energy” (HIE), at an average of 350 Watts OR ABOVE, before my MPA (Maximum Power Available) would decline to my Threshold Power. Conversely, the “Time-To-Recovery” (TTR) Field showed how many minutes and seconds would be required to get my MPA back up to full MPA.
As I pursued the Intervals, the ‘Clock’ on the bottom of the Field Counted Down. The ‘Clock’ on the top actually counted UP, since getting back to full MPA takes longer.
Here’s one of the early Screenshots, taken after a few intervals.
WHY 350 Watts? Why 175 Watts?
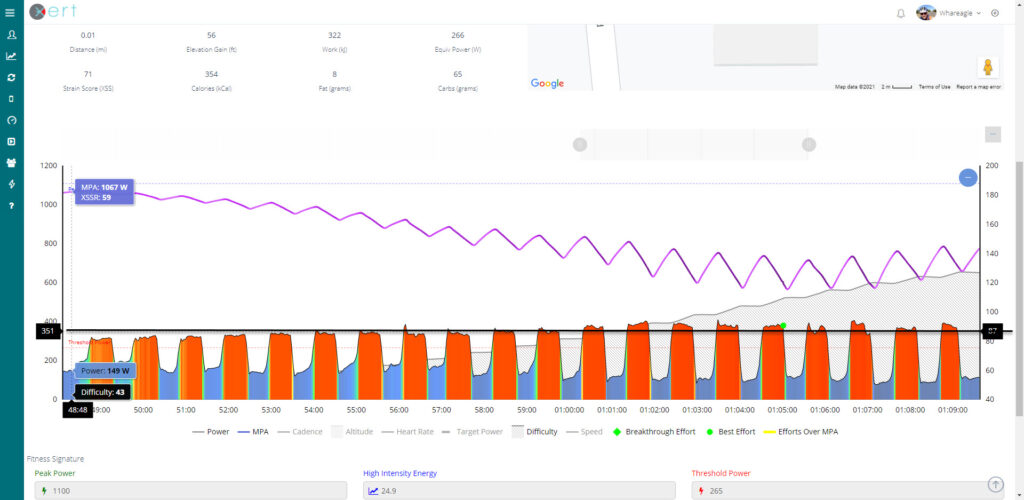
I chose 350 watts as my Xert Time-to-Exhaustion value, because when we look at a recent ride’s Power-Duration Curve, we can see that my 5 Minute Mean Max Power, reads 344 Watts.
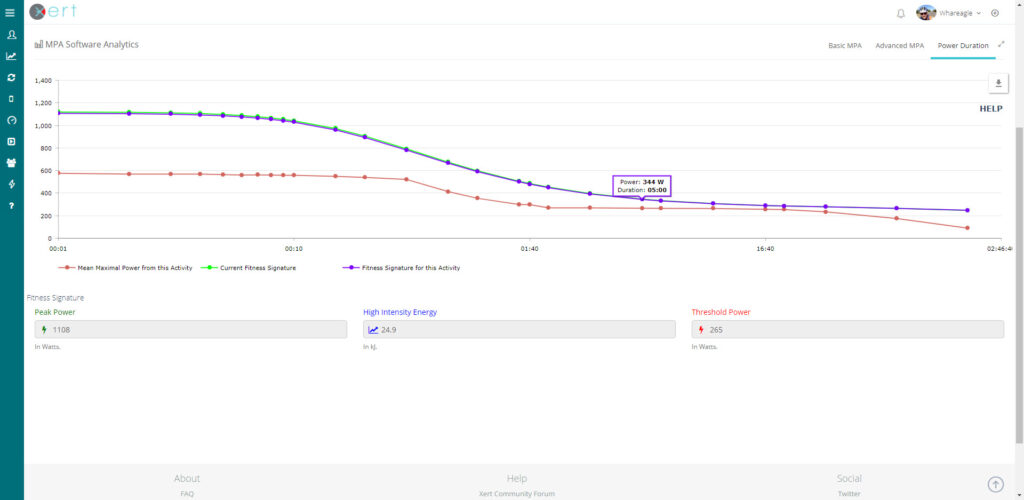
By entering “350 Watts”, I’m ensuring that I will be pedaling at an intensity that evokes Maximal Aerobic Power, and Vo2 (Volume of Oxygen Uptake). It’s also the goal value that I have selected for optimization in this current training block.
The 175 Watt Xert Time-to-Recover value corresponds with a solidly aerobic intensity. It is well below my Lower Threshold Power, yet it keeps me FOCUS on active recovery, instead of noodling along at 80 watts or thereabouts.
Scenario #1, Continued…
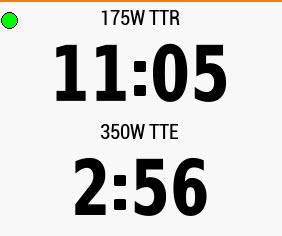
As I continued to perform these 30-second intervals, I began to gently increase my intensity. As the average power per interval crept above 350 watts, my Xert Time-to-Exhaustion began to decline more rapidly.
Here are some time checks…
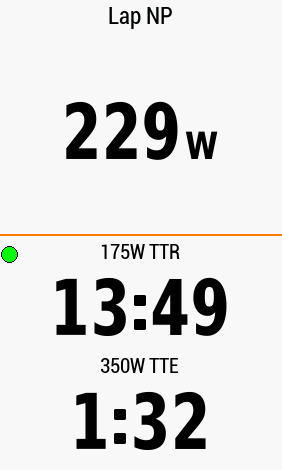
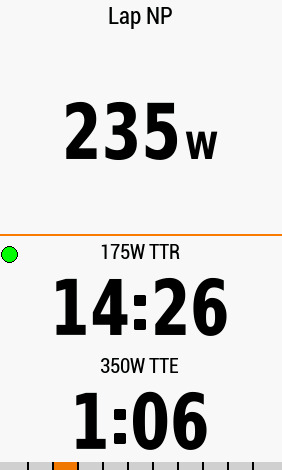
Notice that my “Lap NP” continues to rise. I use Normalized Power instead of XEP because it removes the Zeroes that come from coasting, and the algorithm tends to better estimate my ‘metabolic’ average power output over the lap time. As I recovered, the time would rise back up again, by a few seconds, which forced me to pedal that much harder for the next set, to depress the value even further.
In Part II, I’ll show you how to enter this information via the Garmin IQ app on your phone. Then, in Part III, we’ll explore the MPA Ceilings and Floors, and how to make a workout using that type of information.
Thanks for reading, and Enjoy the Ride!