Get the Complete Picture.
Measuring improvement is a nuanced science. We are always looking at numbers, trends, and metrics, to try and glean information. When you look at a bike ride, there are ALL SORTS of things we can measure and record. Here are just a few:
- Speed
- Cadence
- Altitude
- Temperature
- % grade
- Vertical Feet/Meters climbed
- Heart Rate
- Wattage
- Energy Expenditure
- Wind velocity and direction
- Pace
- Time of day
There’s just a ton of information out there. It’s up to the cyclist or the coach to figure out what it all means, and how we can assess it for analysis and improvement.
Take A Deeper Look at Heart Rate.
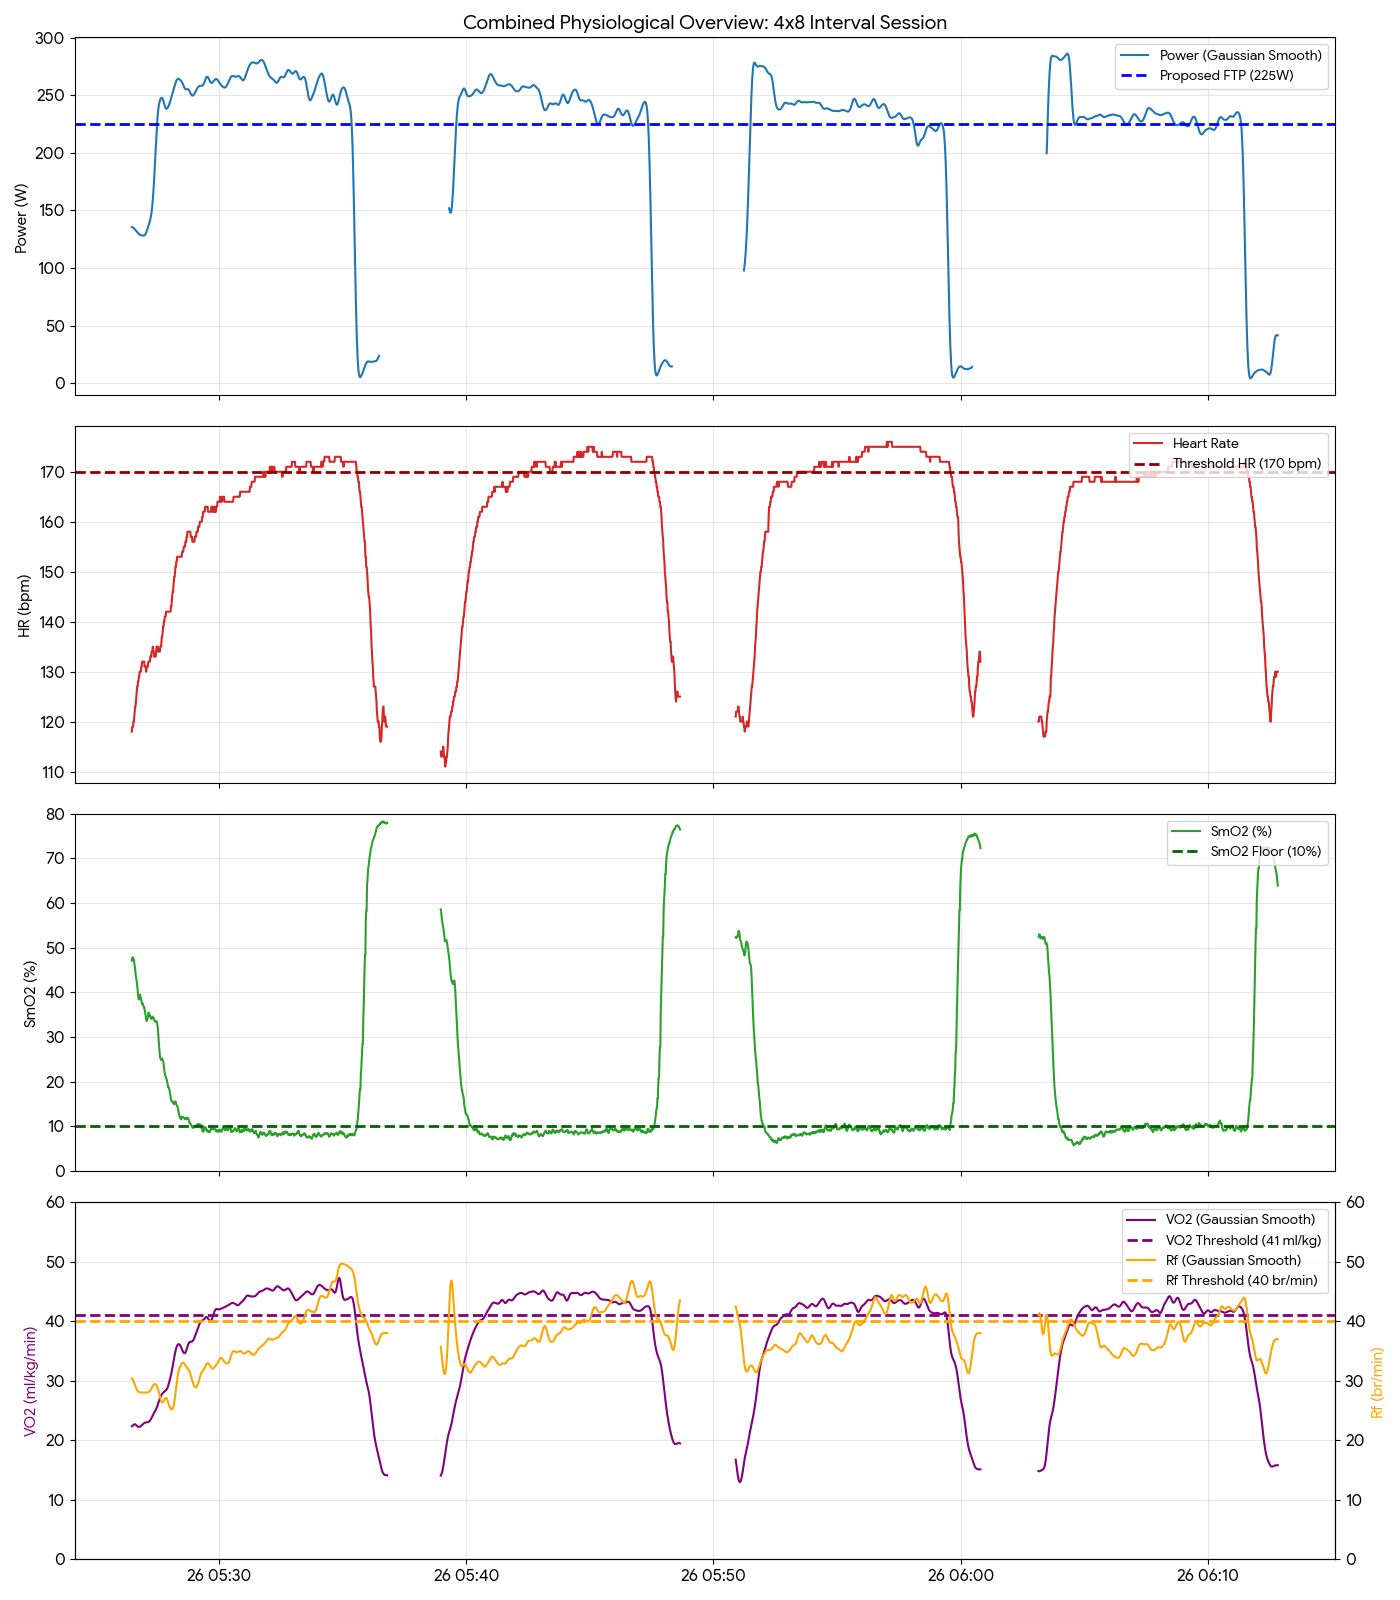
One of the old standards is Heart Rate. For decades, Heart Rate was a practical way to measure intensity. It could also be used to measure recovery, hydration, and fatigue.
We cannot look at wattage alone. We have to look at wattage as an extrinsic force. When we look at heart rate, this is an intrinsic force. Both bring value.
Here’s an example:

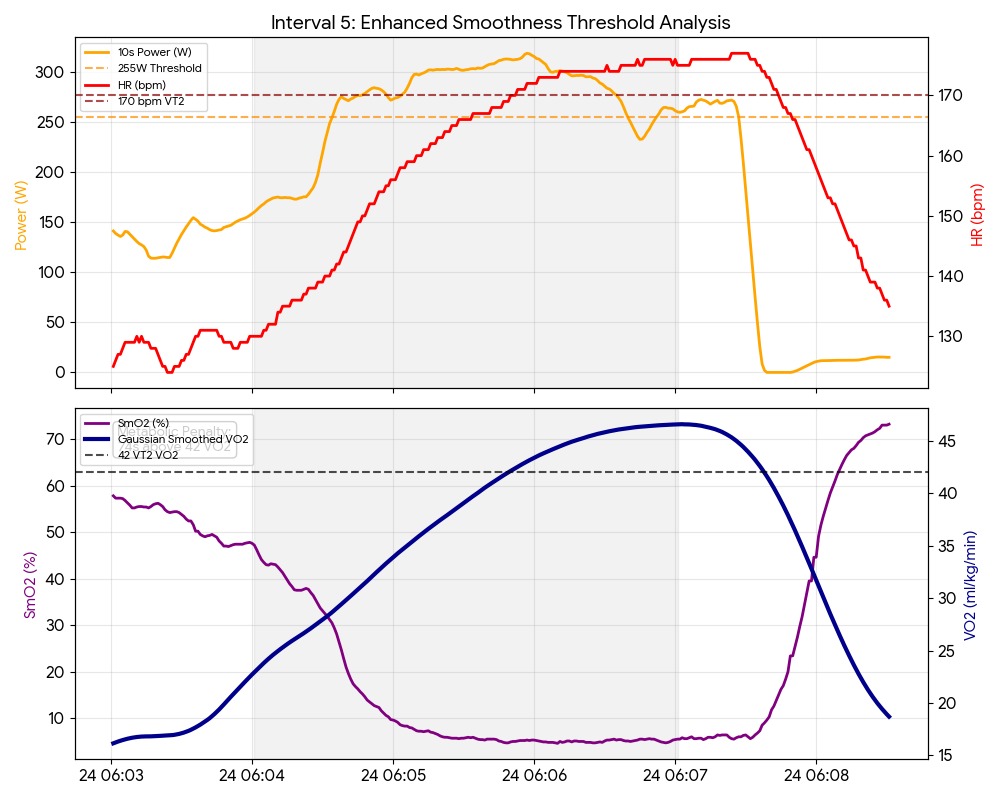
This cyclist was given a workout of 60 minutes. The main set of intervals were 2 minutes long, with one at the end which was very intense and would hopefully yield a breakthrough per Xert. If we look at the wattage chart alone, it shows a successful workout. MPA dropped, then rose, and the final interval yielded a CLOSE CALL, but not quite a breakthrough. Watts followed the load very closely. However, when heart rate is revealed, it shows something more.

Look at the heart rate from each interval. You’ll notice that Heart Rate begins at a higher number, and ends at a higher number, for each interval. Each effort was equal EXtrinsically. However, INtrinsically, each interval was harder to accomplish. The client worked harder, recovered less each time, and hit his peak heart rate with the last effort, even as he drained his MPA.

Strain Score Helps, but When Observed With Heart Rate….
Now, look at the “Strain” value. Strain is Xert’s way to show how your work is affecting your fatigue or recovery. The more strain, the more fatigue. The more fatigue, the harder it is to achieve your interval goals. The workout shows that Strain is at 126 KiloJoules. This is a good number. However, it should reveal that the cyclist was strained, but not OVERLY so. When we look back at Heart Rate, however, it clearly shows duress.
Heart Rate is still a valuable tool; it looks at the interior process going on in the body. Wattage reveals itself to be an exterior result of all that work done by the body. If heart rate fails to drop, fails to rise, or doesn’t reach numbers that are commonly seen – then something is going on inside the body. It’s telling us something. The nuance is in discovering just WHAT Heart Rate is telling us, and how to approach training because of it.