VO2Max State vs. Zone: What’s Happening Under the Hood
https://youtube.com/shorts/gjB6seZEVec?feature=share
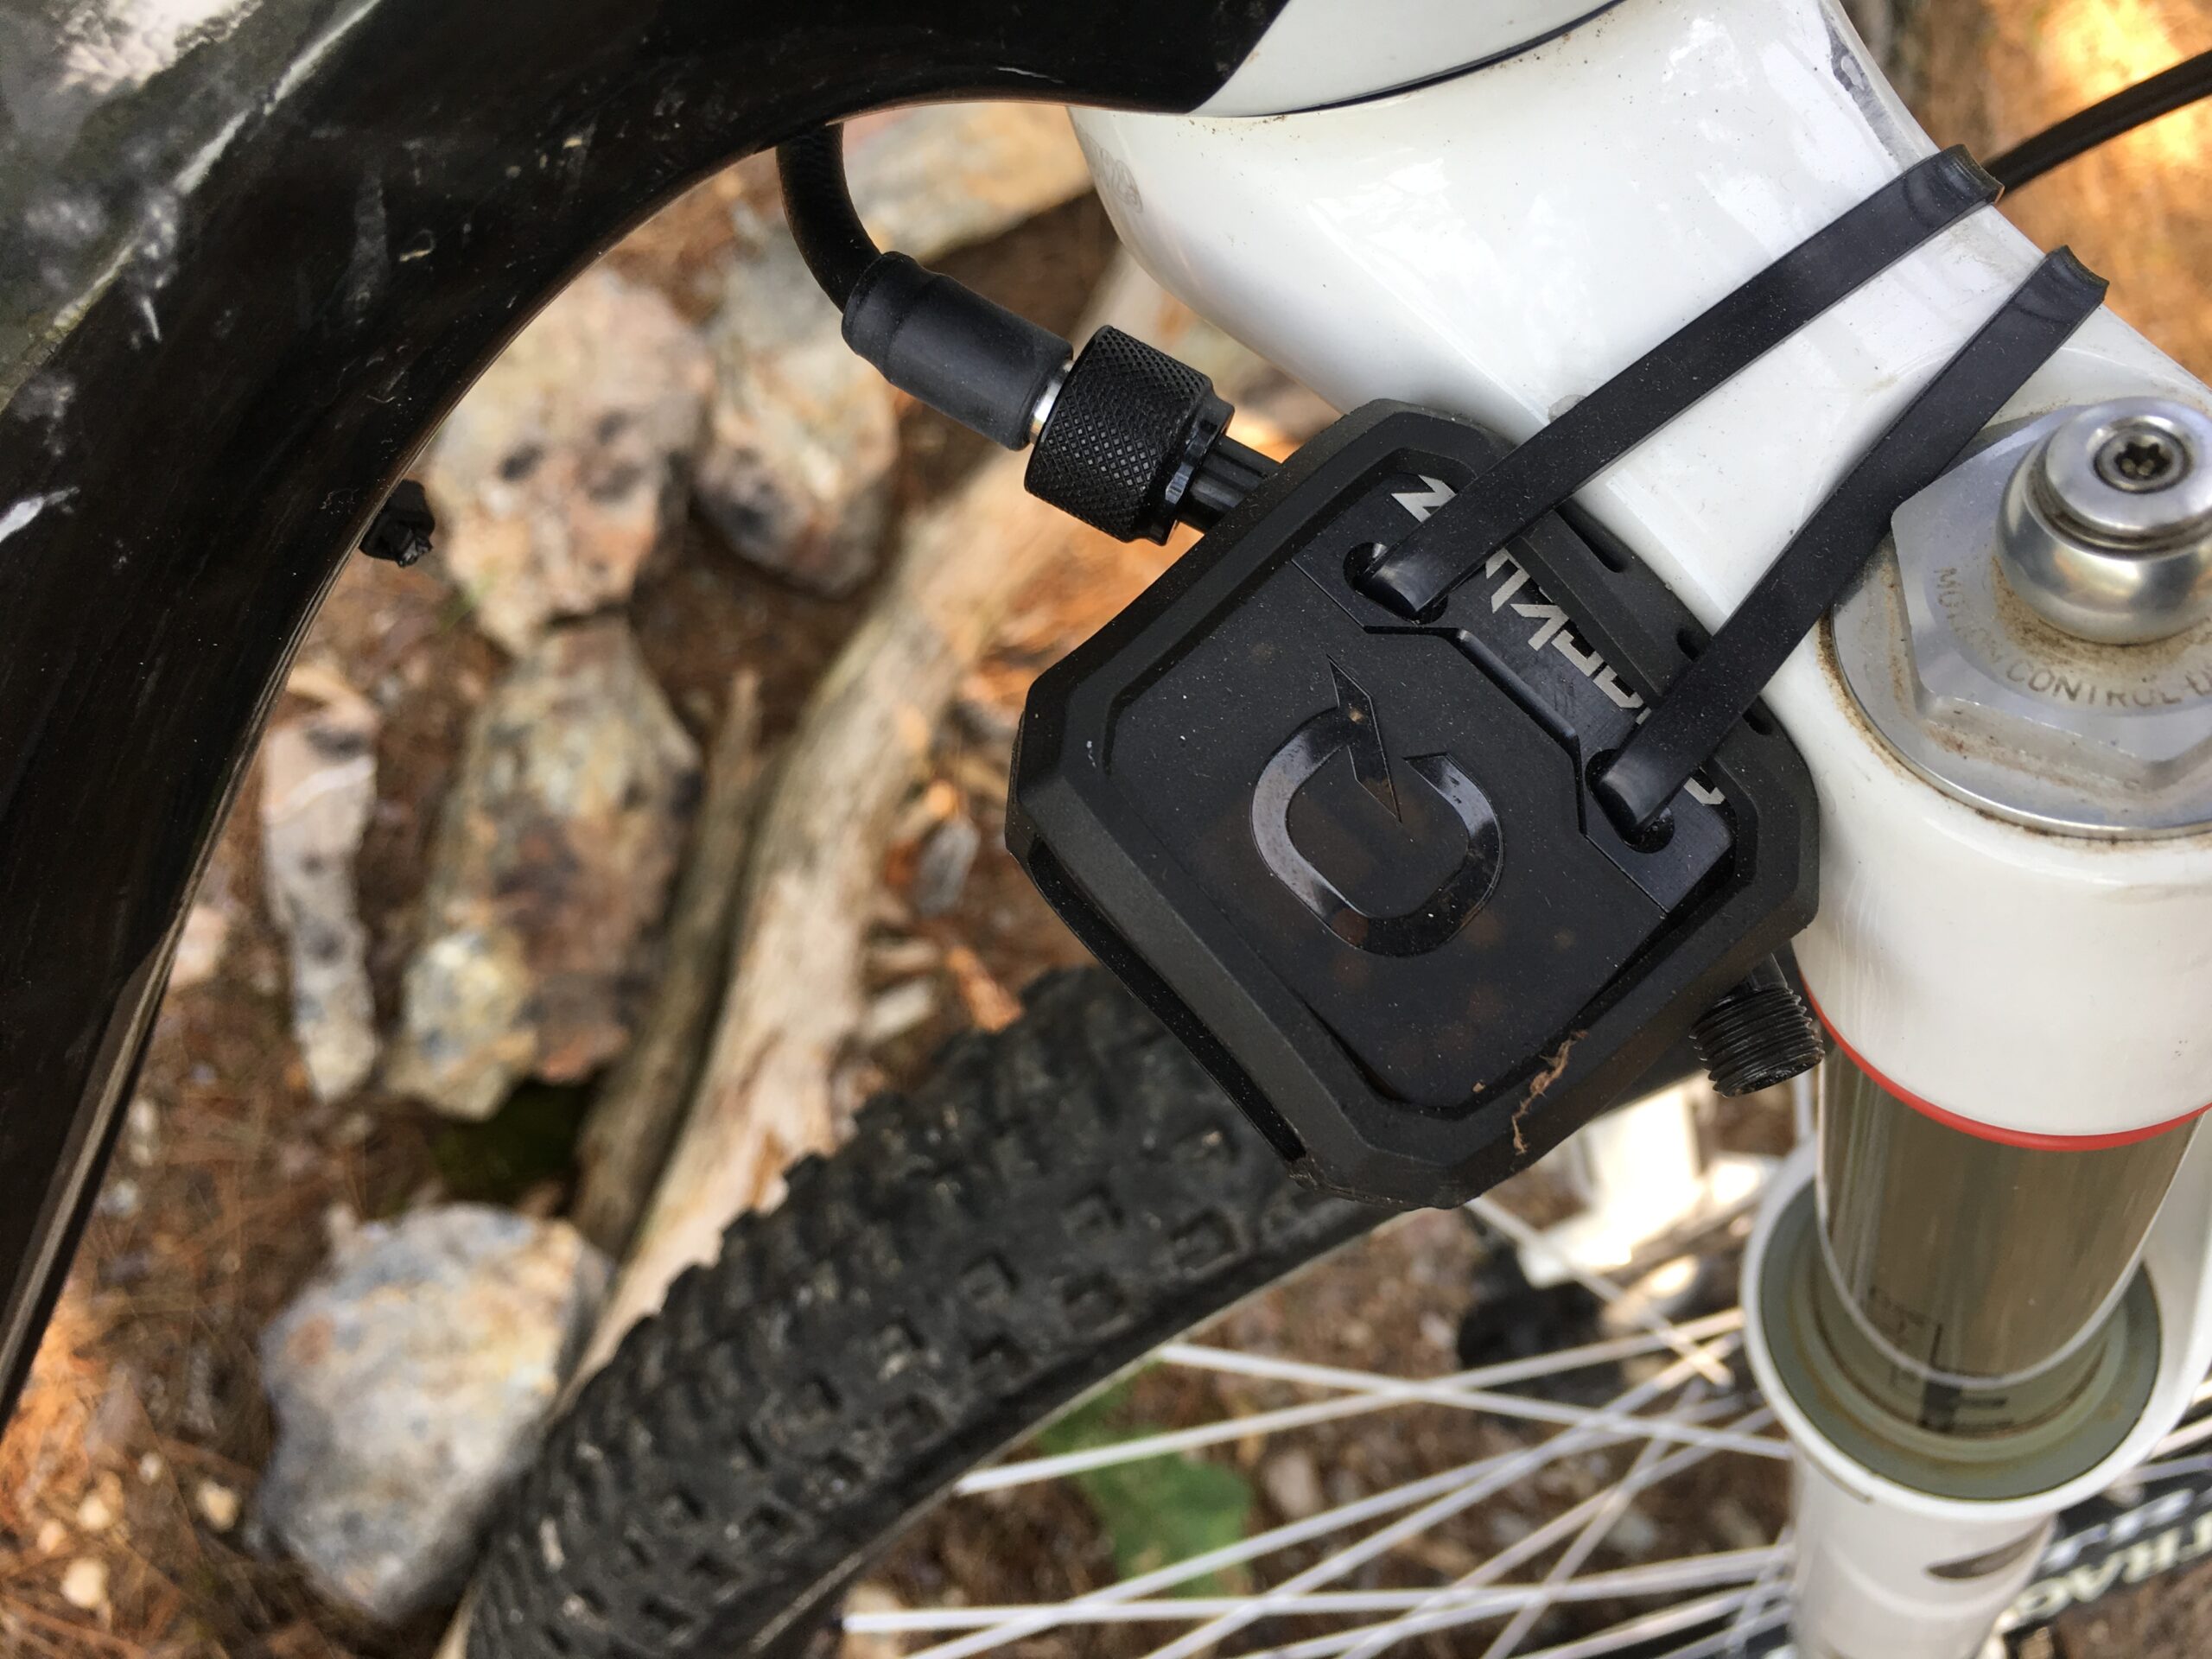
I recently started using my VO₂Master again. In this session, I wanted to explore the VO2max state vs zone debate by looking at the actual physiological cost of high-intensity efforts.
Earlier this week, I performed five separate 3-minute intervals at an intensity well above my 255W threshold. I used the VO₂Master to assess two critical things:
- The Peak: What is the highest relative VO₂max I can actually achieve and hold for 30 seconds?
- The Duration: Once that state is established, how long can I stay at or above 90% of that value?
Sports scientists claim that 90% of VO₂max is where the real physiological adaptations begin. If I am performing 15 minutes of intensity in 3-minute blocks, just how much of those 15 minutes did I actually spend at or above that 90% mark?
The Physiology Cascade
Understanding the VO2max state vs. zone distinction is critical for any athlete, and you can learn a ton witha Vo2Master and/or a Moxy Monitor. VO₂max is not a power zone; it’s a physiological state. The best intervals are the ones that keep you in that state long enough for the body to adapt. This usually occurs at 105-120% of Threshold Power, but that is merely the mechanical signature. To understand the physiological signature, you have to watch the cascade:
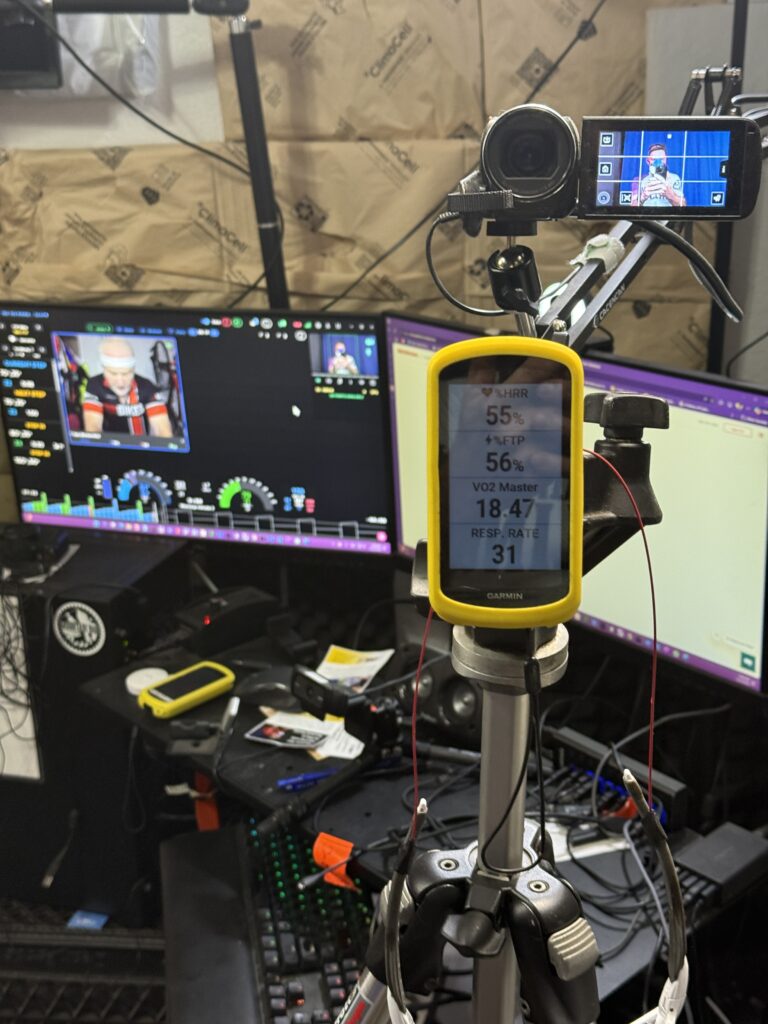
- Respiratory Rate (RR): In a VO₂max state, breathing spikes to purge CO₂. For most, this sits above VT2—around 38-43 breaths per minute.
- SmO₂ (Saturated Muscle Oxygen): This is my acute “early warning system.” It responds in about 3 seconds. For me, a value in the high single digits means I am sustaining high oxygen extraction from the Left Lateralis.
- DFA $\alpha1$: Using the “AlphaHRV” Garmin app, we look for a reading below 0.500. This confirms the heart and nervous system have crossed into the VO₂max state of physiological strain.
The “Metabolic Penalty” of 298 Watts
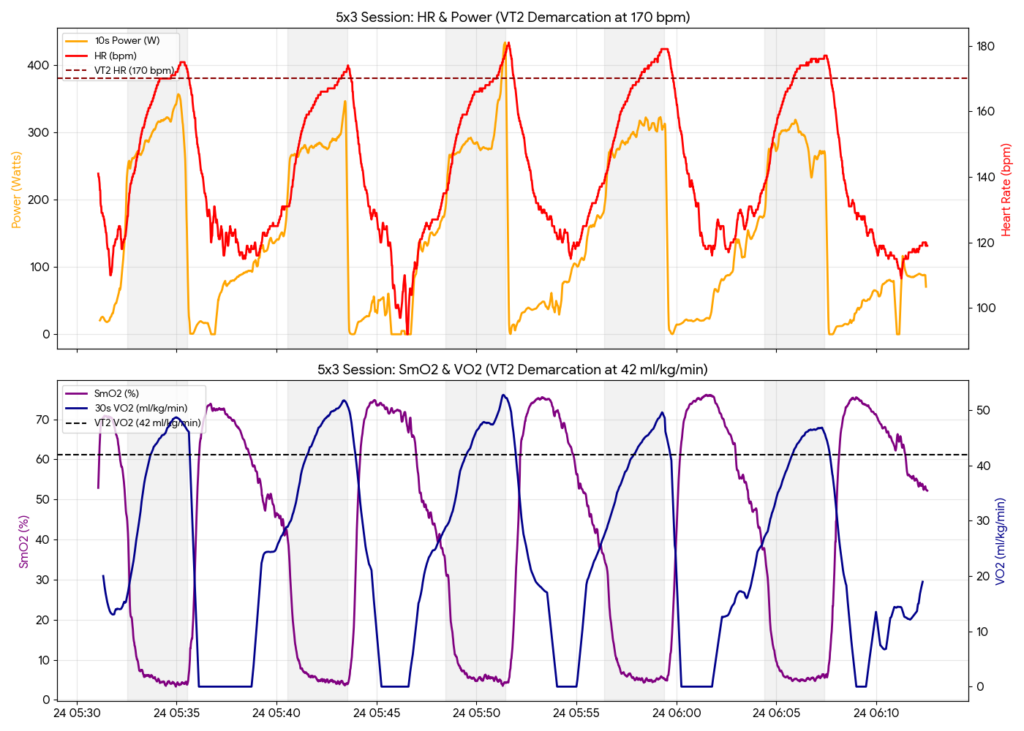
To prove that wattage alone is a lie, I analyzed my recent 5×3 session. On paper, I held roughly 298W for all five reps. A standard coach would say I “held my numbers.” But by looking at the Unified Threshold Dashboard, we see a story of accumulating metabolic debt.
| Interval | Time | Cardiac Cost (HR) | Metabolic Penalty (Time > 42 VO2) |
| Int 1 | Initial Stress | Pacing established; HR peaks at 170. | 35 seconds. My VO2Master mask registered metabolic VT2 only in the last 35 seconds of the rep. |
| Int 2 | Accumulation | Pacing maintained; HR pins at 170 earlier. | 48 seconds. Cardiac drift begins to set in; the metabolic penalty increases by 37%. |
| Int 3 | Tipping Point | Efficiency drops; HR pins earlier. | 62 seconds. The metabolic penalty has nearly doubled from the first rep. You are now spending over a full minute above VT2. |
| Int 4 | Red Zone | Pacing maintained (298W); HR stays >170. | 76 seconds. The “Sponge” analogy from the final interval chart is failing; extraction is maxed, but delivery is now consistently redlined. |
| Int 5 | Breaking Point | HR pinned >170; touching 178 max. | 89 seconds. This is pure destruction. For nearly 1.5 minutes, my lungs are maxed out trying to clear the accumulated debt of the prior 36 minutes, while SmO2 is hitting rock bottom (0-3%). This is the DEFINITION of Maximal Overreach. |
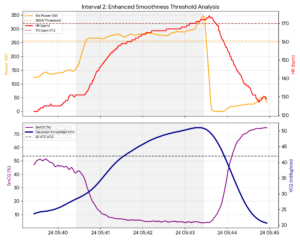
Interval 1: The Fresh Start
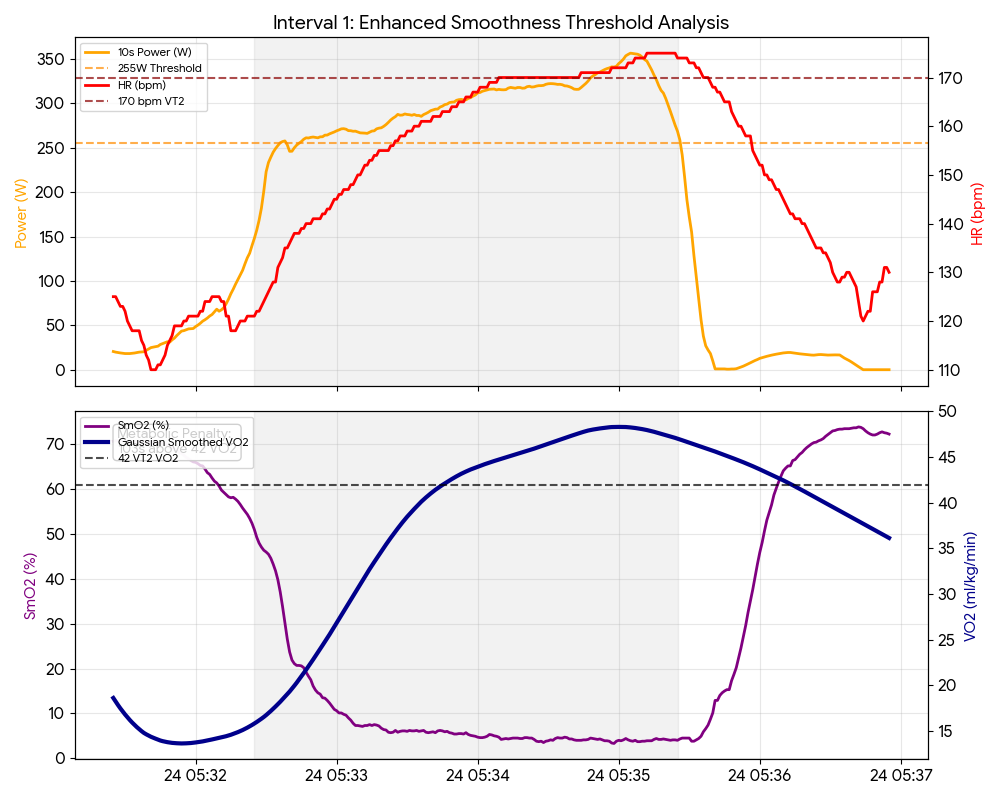
In the first rep, it took nearly two minutes for my VO₂ to even cross the VT2 threshold. I only spent 101 seconds in the actual VO₂max state. My SmO₂ floor was a healthy 5%. I was working, but the system was fresh.
Interval 2 & 3: The Tipping Point
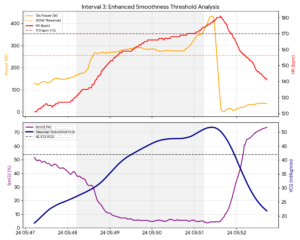
By the second and third reps, the “Metabolic Penalty” increased. I spent 115 seconds above the threshold in Rep 2. My heart rate stayed pinned at 170 bpm for the final minute. The “Sponge” was being squeezed harder, and it was taking longer to soak back up during the recovery.
Interval 4: The ‘Red Zone’
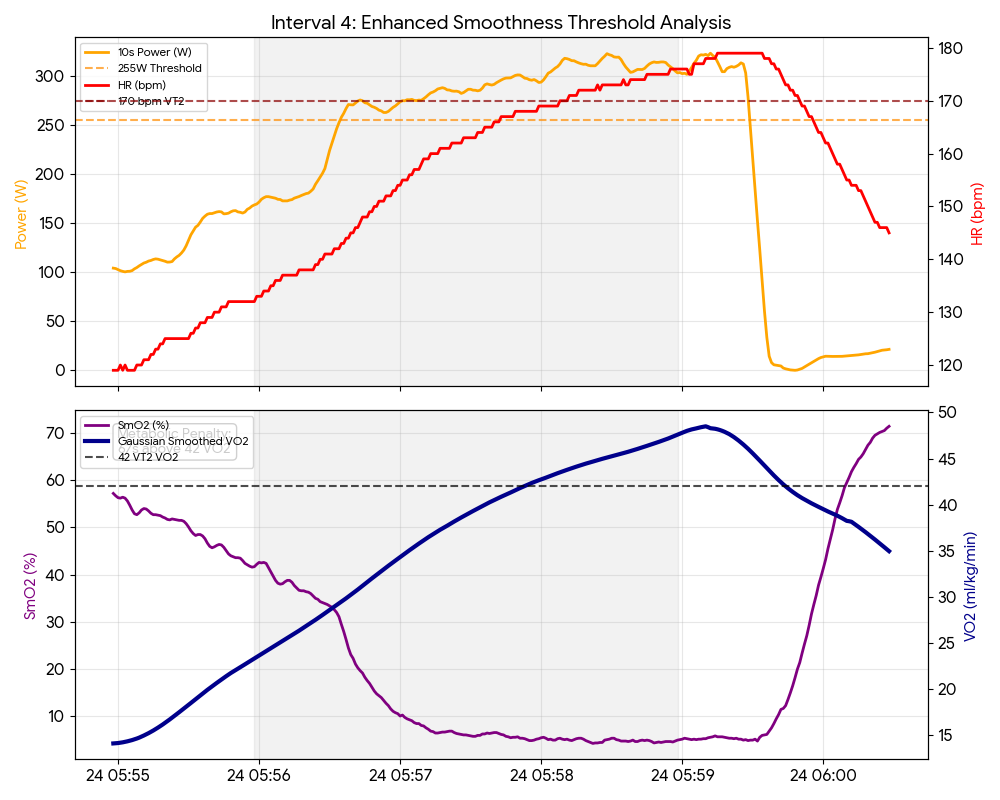
Interval 4 marks the “Red Zone” where physiological lag disappears and heart rate pins above VT2 almost immediately despite the steady 298W load. At this stage, the “Sponge” remains physically squeezed, signaling that the delivery system is failing to re-oxygenate the muscle effectively even during the recovery periods.
Interval 5: The Breaking Point
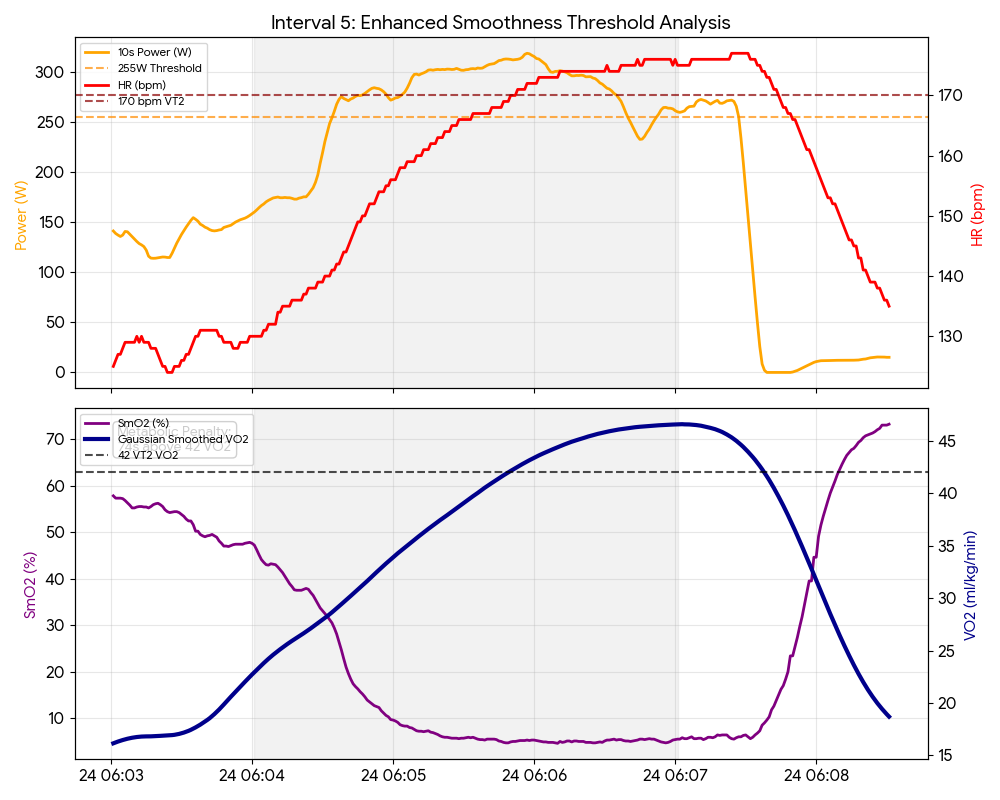
Look at the final interval. My Heart Rate reached 178 bpm—near my absolute max. My VO₂ stayed above the threshold for 74 seconds, but look at the SmO₂ recovery. The resaturation was sluggish. I wasn’t doing the same “work” as Rep 1; I was paying a massive physiological price just to keep the lights on.
The Verdict: Stop Riding Blind
If you only looked at my power file, you’d see five identical 298-watt blocks. But by looking at the Unified Threshold Dashboard, you see a fresh athlete in Interval 1 and a physiologically ‘broken’ athlete in Interval 5. Power tells you what you did; physiology tells you what it cost you. The idea of getting into a Vo2Max state vs zone is where the nuance of intensity is achieved.
If you are a Masters athlete, you don’t have “matches” to waste on junk miles. You need a 36-minute warmup to open the “pipes” (ThB) and a real-time view of your re-saturation kinetics to know if your next interval is building you up or breaking you down.
This is what I do at VQ Velocity. We don’t just look at the watts on your Garmin; we decode the conversation happening between your heart, your lungs, and your muscles. Join my live virtual studio or work with me to optimize your Garmin/FirstBeat ecosystem.
In God We Trust. All others must bring data to the table. GO GET THE DATA!