
Physiological Threshold Vs. FTP: The Power Illusion
The Power Illusion: Resetting 20 Years of Training with Physiological Data After 20 years of cycling, I realized my FTP wasn’t telling the whole story of my actual physiological threshold. My identity as a cyclist was defined by a single, flickering number on a head unit: Watts. If you’ve spent any significant time in the […]
Altitude, Heat, and the Power Curve: Practical Physiology for Endurance Athletes

Elite performance is built on a careful balance between stress and recovery, biology and behavior. This article translates practical lessons from applied sports science into usable guidance for endurance athletes and coaches. It covers how simulated altitude works, why erythropoiesis is not as simple as “more red blood cells = better,” how heat affects different […]
The Physiological Perspective of Four Separate 8-Minute Intervals
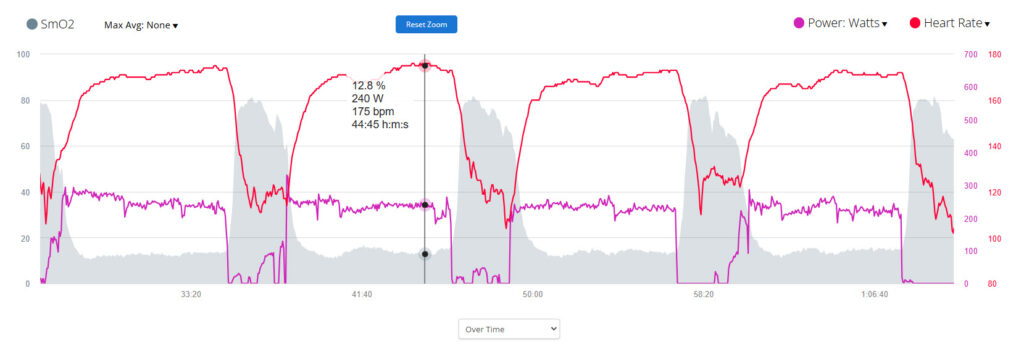
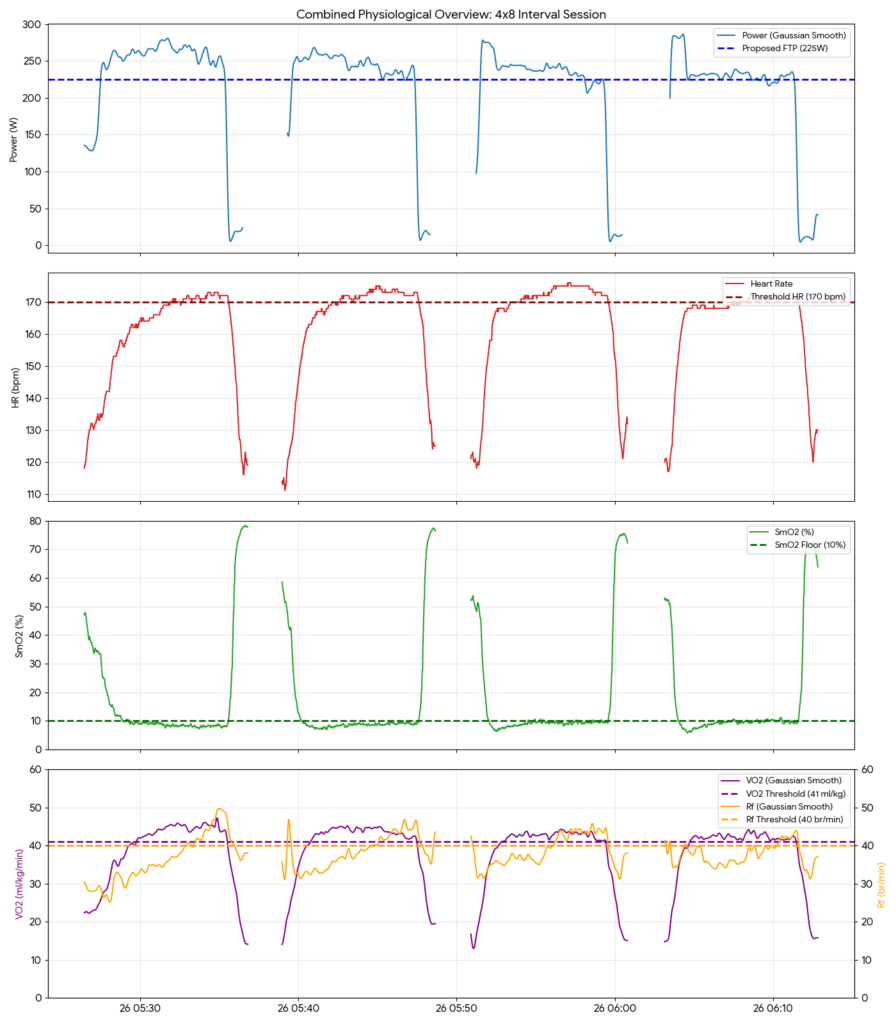
8-Minute Intervals At “Threshold”… In late November of 2024, I was able to perform an interval session on my indoor trainer and bike with my clients. The workout comprised of four separate 8-minute intervals. We used the VQ Velocity app, and I recorded each interval as a separate file while wearing my Vo2Master Gas Exchange […]
Vo2Master Vo2Max Value Affirms Garmin Vo2Max Estimator
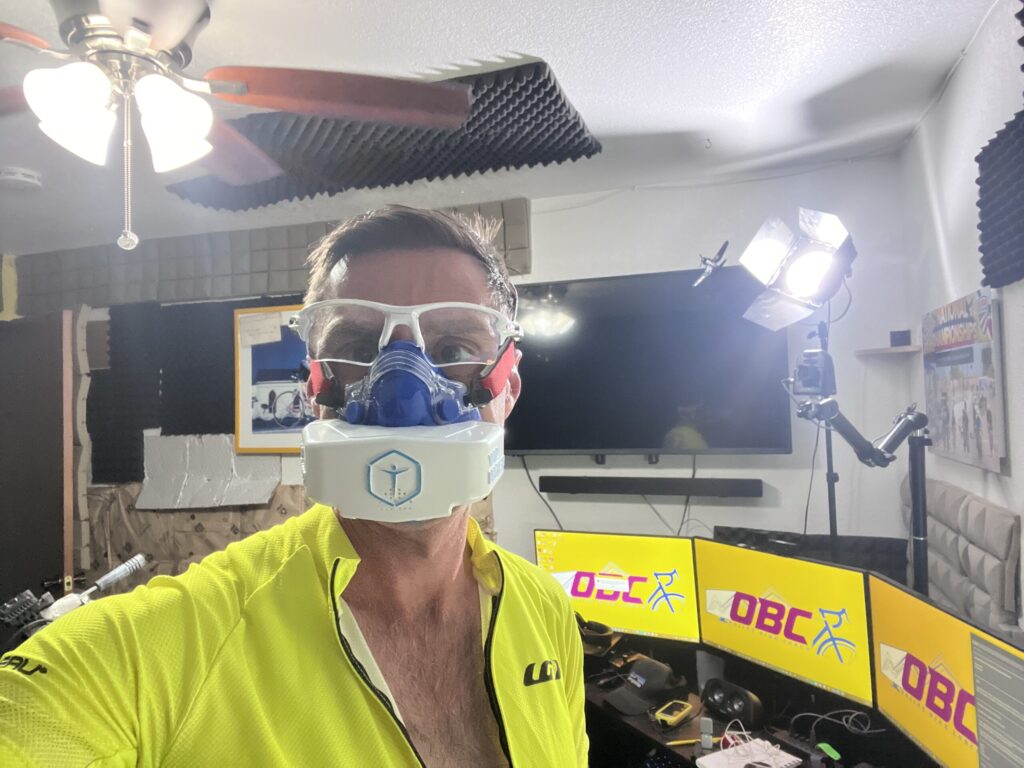
Vo2Master’s Vo2Max Value Was 98% Consistent with Garmin In May of this year, I wrote a post about the Garmin Vo2Max Calculator. In July, I was able to test my Vo2Max at OBC Headquarters, to compare values. I performed a Graded Exercise Test, using the Vo2Master app. This app, on a cell phone, trapped data […]
Vo2Max On Garmin Connect and the Garmin 1040
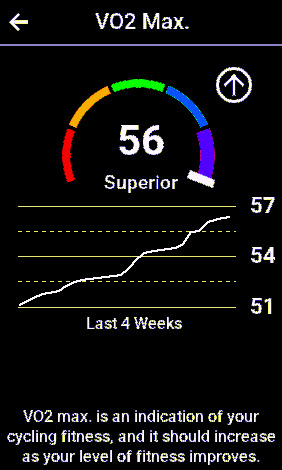
Vo2Max Calculations Show Cardio-Vascular Changes Vo2max is a fitness and health measurement that is defined as, “The Maximal Volume of Oxygen that can be consumed by a person during physical exertion.” I’ve discussed Vo2max in the past, and I even own a Vo2Master assessment device, for testing and training purposes. Garmin Connect uses information collected […]
Fitness HRV software Release 0.17
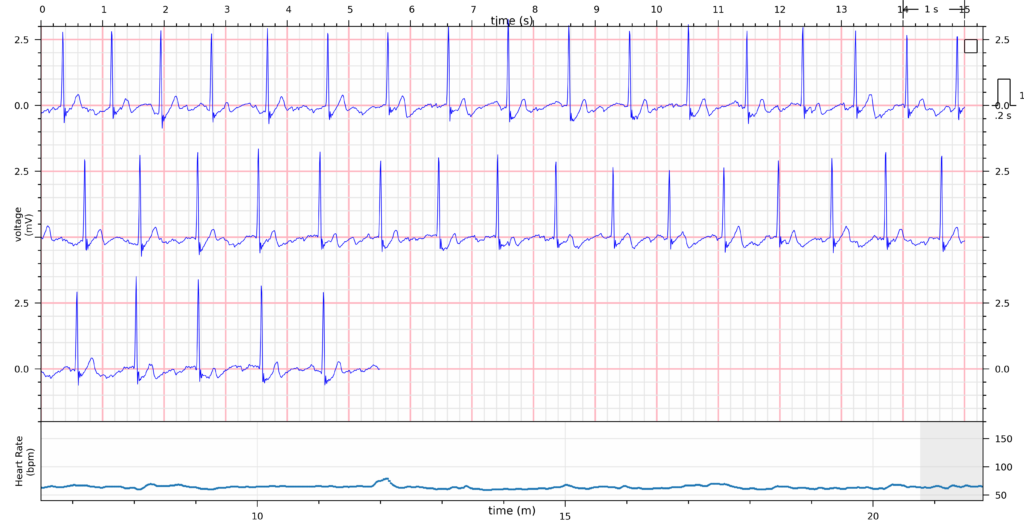
Fitness HRV Now Includes Moxy SmO2 Values My work with Dr. Bruce Rogers and Mr. Stuart Lynne is continuing to show steady progress. Last month, I revealed the Alpha version of Fitness Dashboard. Fitness HRV is software that we are building to identify training intensities below VT1 (Ventilatory Threshold), and above VT2 (Traditional Threshold). The […]
Billat 30-30’s – Part Two
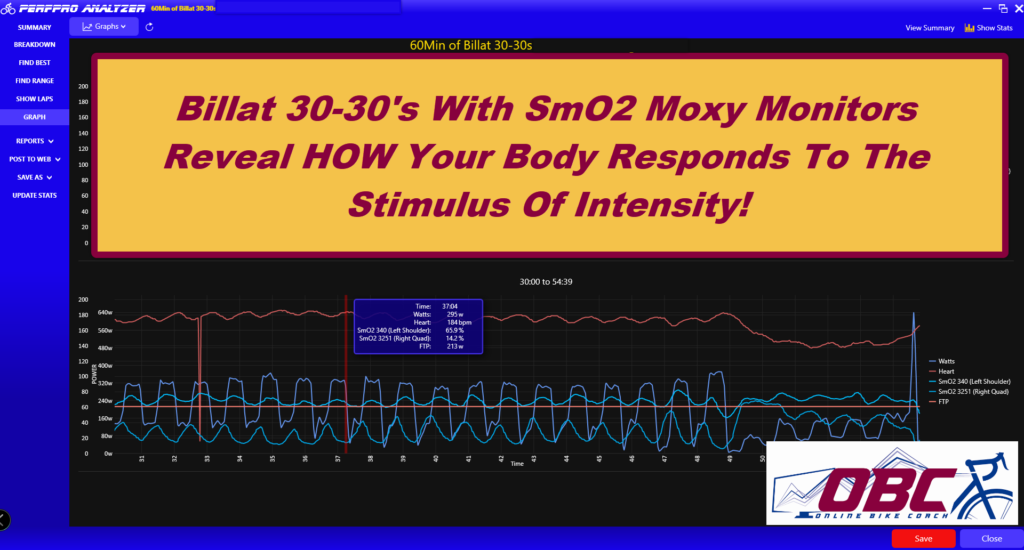
“Billat 30-30’s are intervals that require a hard effort for 30 seconds, followed by an easy recovery for 30 seconds. Over time, the body ends up playing ‘catch-up’, through heart rate, breath frequency, demand for oxygen at the muscular level, and a buildup of lactate in the system.
We can see this buildup through lactate testing, which is invasive and cumbersome, but we can also see it through SmO2 values, as muscles de-saturate and re-saturate. Lactate is getting processed back into energy, but sometimes the demand for oxygen is greater than the body’s ability to provide it. “
SmO2 (Saturated Muscle Oxygen) From Two Locations During Billat 30-30 Intervals
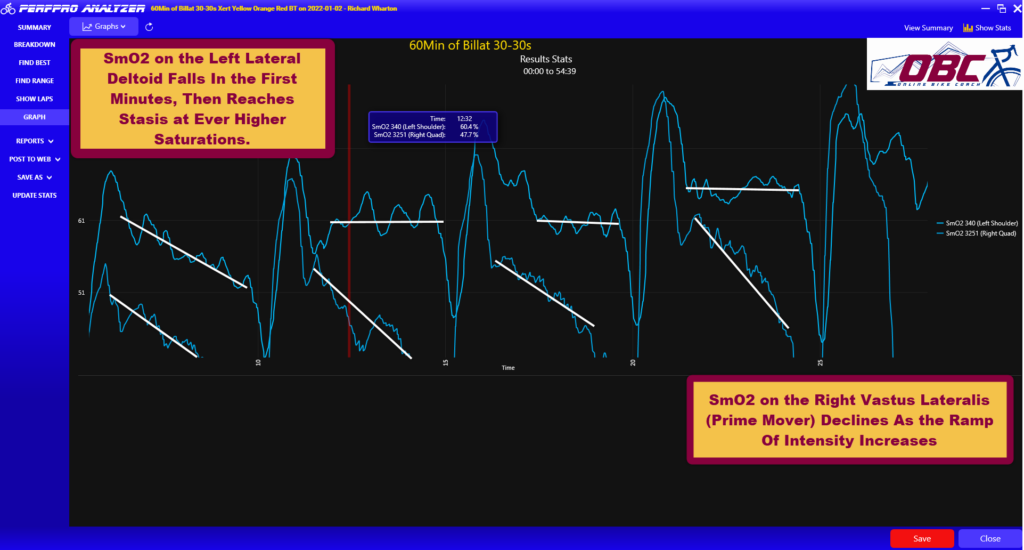
This is a chart from PerfPro Analyzer 2021 (Beta). PerfPro Analyzer continues to be my favorite workout and programming tool. It has the best display, the most customizable options, and Dr. Skiba’s Metrics are PUBLISHED and PEER REVIEWED. This cannot be said about other “Cycling Fitness” Platforms or their AstroTurf PhD’s. Remember, “In God We Trust, All Others Bring Objective, Peer-Reviewed, Published Data With Valid Hypotheses!”
Specifically, look at the two lines on this graph. The Upper Line is my SmO2 value from a Moxy Monitor placed on my Left Lateral Deltoid. The Lower Line is an SmO2 Moxy Monitor placed on my Right Vastus Lateralis. This image is from my warmup.
Using Ergometer LOAD vs. % SLOPE for DFAA-1 Base Training
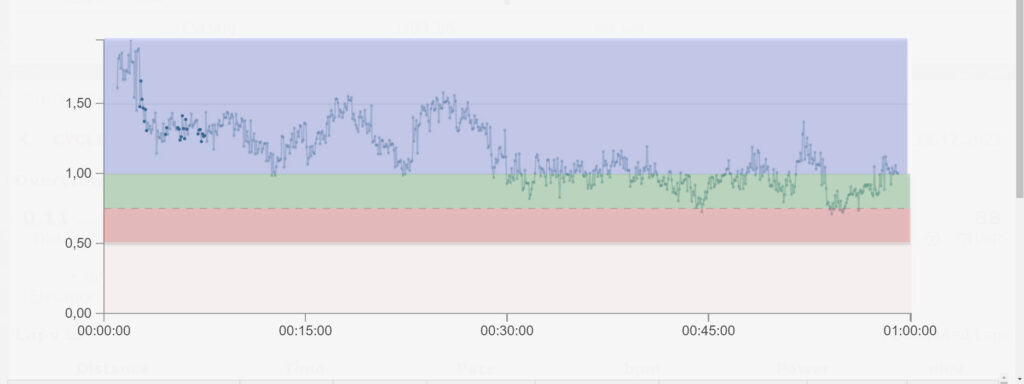
“PerfPro Studio is such a fantastic product for training and analysis. It allows a cyclist to ride at a load based on an ergometer, or a load based on % slope. Yesterday, after assessing my DFAA-1 heart rate, SmO2 and wattage values, I decided to ‘test’ the values….”
Base Ride Analysis Using Published Science
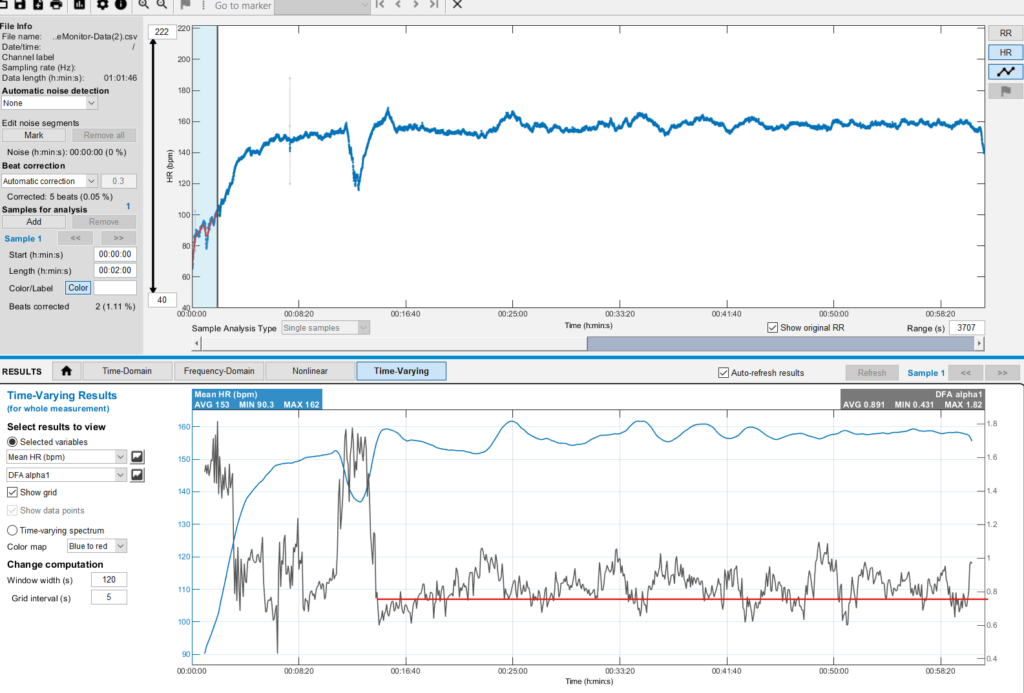
“In the first part of the video, you can see FatMaxxer being screencast from an Android to the PC window. The second screen is the Vo2master software, which is being screencast to the PC using LonelyScreen app. The rest of the information is being presented through PerfPro Studio. Post-ride analysis was done using PerfPro Studio, PerfPro Analyzer Beta, and Runalyze.”