
Draining the Voltmeter: A 5 AM Lesson in Under-Fueling and Autonomic Collapse
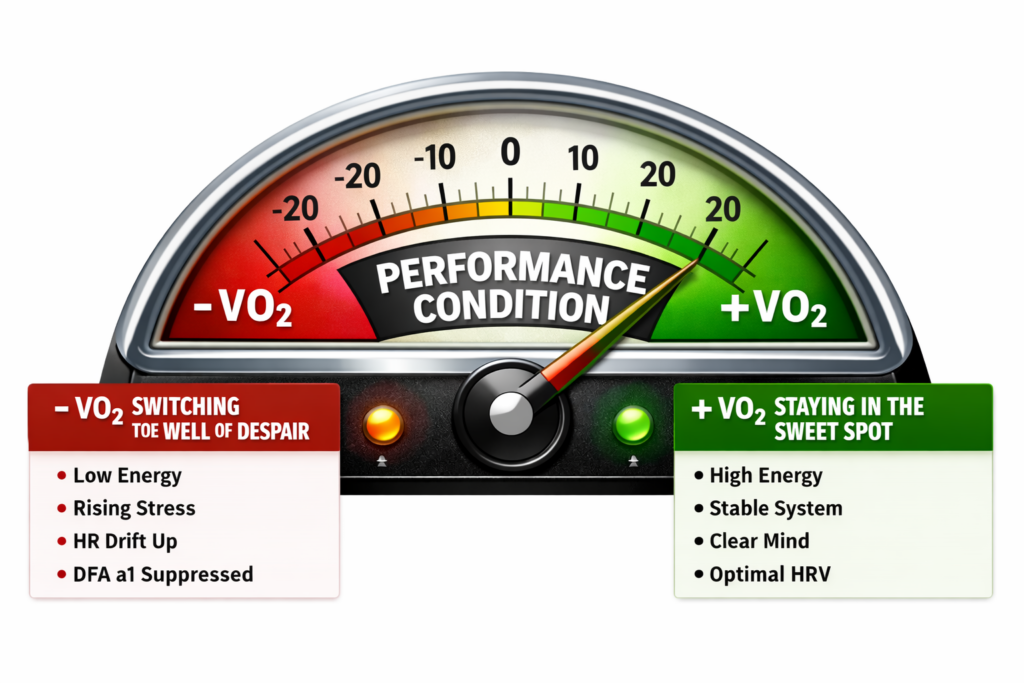
Forget Your Software’s Threshold: Your Physiology Rewrites the Rules in Real Time We’ve all been conditioned to treat our threshold like a monument carved in stone. Your bike computer, your smartwatch, or your coaching software gives you a single, static number—say, a functional threshold power (FTP) of 250W or a threshold heart rate of 162 […]
Real-Time Decompensation: Decoupling and the Anatomy of My Failed Workout
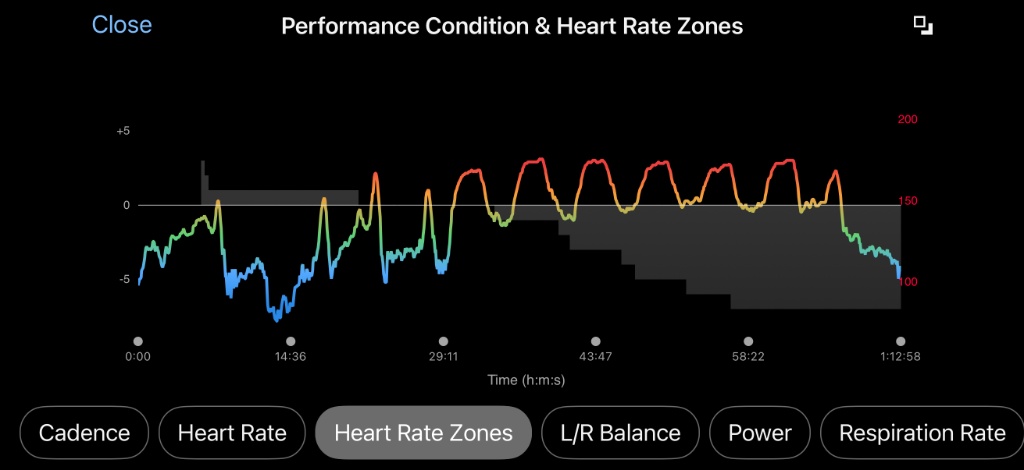
Every endurance athlete knows the feeling of hitting a wall, but few can see it coming down the track with mathematical precision, which is why monitoring your Garmin Performance Condition is so vital during hard blocks. Yesterday, I set out to complete a critical high-intensity maintenance block: 7×3-minute VO2max intervals targeting north of 270 watts. […]