
Draining the Voltmeter: A 5 AM Lesson in Under-Fueling and Autonomic Collapse
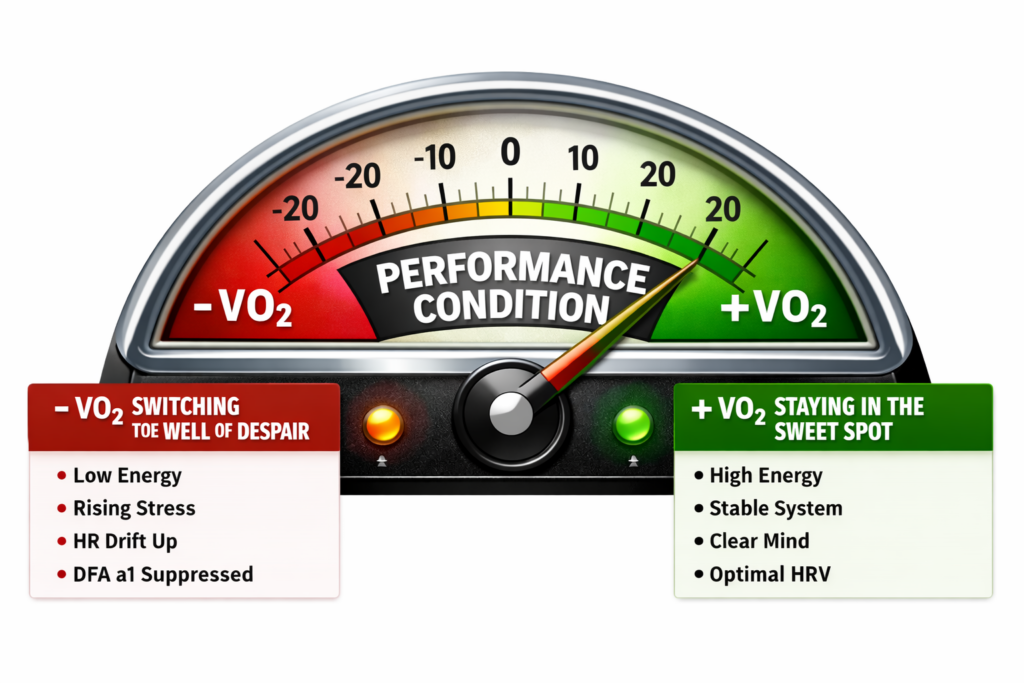
Forget Your Software’s Threshold: Your Physiology Rewrites the Rules in Real Time We’ve all been conditioned to treat our threshold like a monument carved in stone. Your bike computer, your smartwatch, or your coaching software gives you a single, static number—say, a functional threshold power (FTP) of 250W or a threshold heart rate of 162 […]
Garmin Guru Deep Dive: Decoding the Internal Response to 4-Minute VO2max Intervals
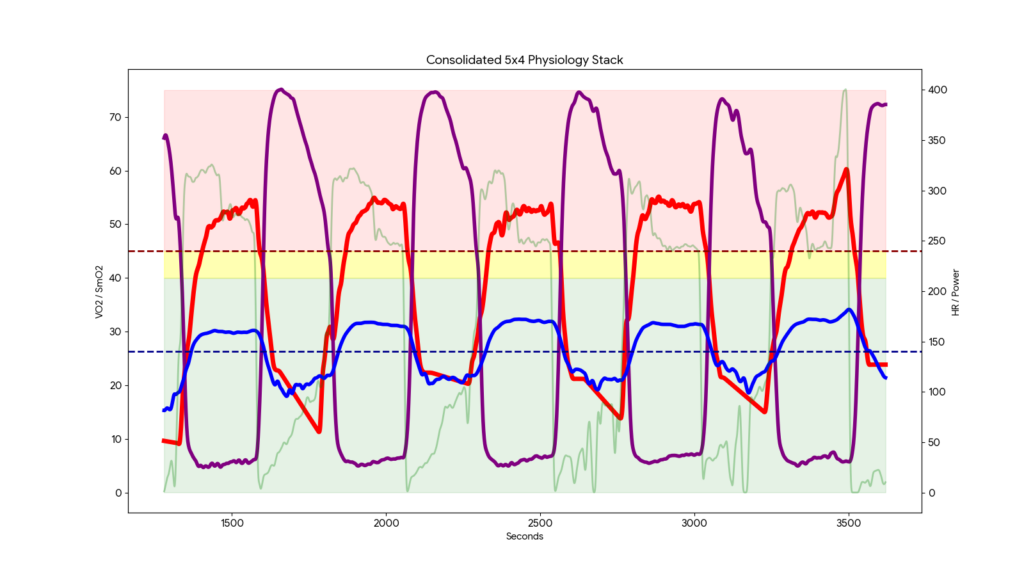
Garmin Guru Deep Dive: Decoding the Internal Response to 4-Minute VO2max Intervals Today’s session of 4-minute VO2max intervals was a masterclass in why I lead with physiology, not physics. As the Garmin Guru at Online Bike Coach, I’m constantly looking for the “truth” behind the numbers. Today, that truth was found in gas exchange and […]