
Decoding the Flux: How the Reverse Fibonacci Protocol Re-Maps Your Threshold
Beyond the Score The Garmin Guru Series | Decoding the Fast-Adapter | By OnlineBikeCoach.com Programming Reverse Fibonacci intervals is the ultimate way to shatter the lie of the “Static Zone” in high-performance cycling. We move past the idea that a single FTP test or a heart rate formula from a 1980s textbook is […]
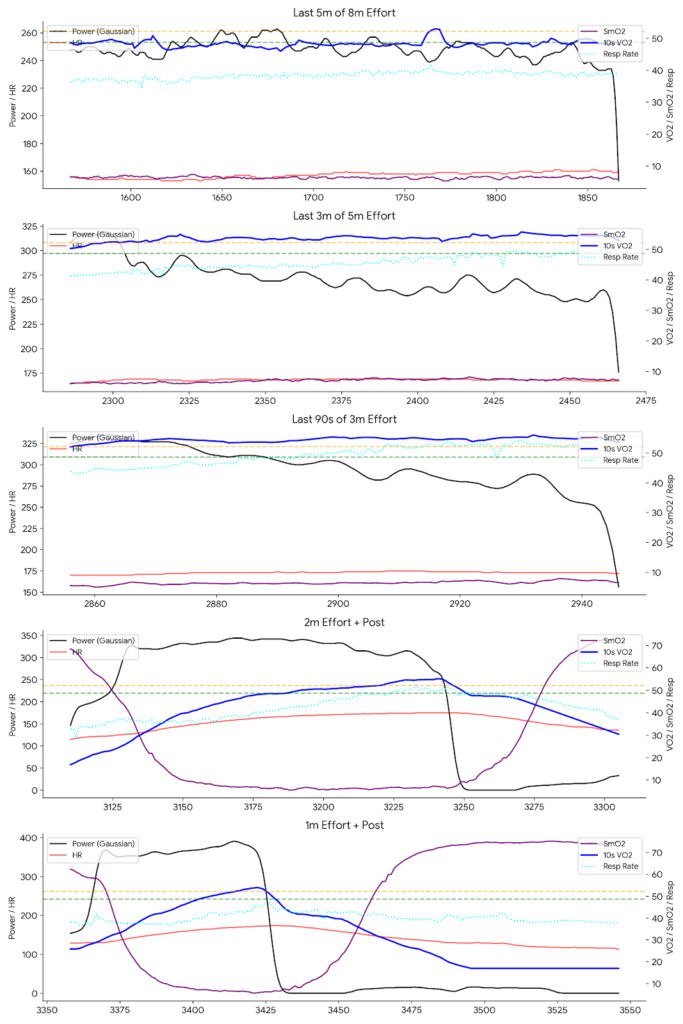
Living in the Parabolas: My Deep Dive into the “VO2 State”
Living in the Parabolas: Decoding Metabolic Inertia and the Billat 90/90 In our last deep dive, we dissected the steady-state grind of 5×3 and 4×8 intervals. Those workouts are the bread and butter of threshold development. However, today we are stepping into the “red zone” to explore Veronique Billat’s 90/90 Metabolic Inertia. Using the combined […]