
Garmin Profiles Part 1 – Xert Training Fields
[caption id="attachment_1327" align="aligncenter" width="240"] Xert Training Fields Garmin 1000 Screen 1.[/caption]
What’s On Your Garmin?
I frequently get this question. “What’s on your Garmin?” “What’s on your Screen?” “What do your Profiles look like?” How do you set up your Xert Training Fields, and in what order?
In this post, I’ll walk you through the entire process.
MMP (Mean Maximal Power) Breakthroughs Galore in April!
Testing for Mean Max Power (MMP) I’ve been meaning to write about this for a while, so apologies that it’s a few weeks late. However, our training in March and April led to multiple Mean Maximal Power Breakthroughs, and I wanted to write about this. Mean Maximal Power is defined as the “Highest average power” […]
Updating the OLD Xert Garmin Fields With the NEW Xert Garmin Fields – A Video Tutorial.
Unfortunately, I’m posting this a few weeks late. Another update to Xert fields has already rendered this video somewhat obsolete. It’s still a great demonstration of how to get into the old Xert Garmin fields and update them. It also shows what the Garmin Xert Field displays now provide. In Summary: In early March, Xert […]
Xert Focus and WHERE You Should Train.
[caption id="attachment_1332" align="aligncenter" width="600"] This is a 37K Time Trial. What’s its FOCUS?[/caption]
Focus. Focus on your Strengths. Focus on your Weaknesses. Focus on the demands of the course. Focus on the demands of the race. WHERE should you FOCUS? Let me show you not just where to focus, but when and how.
Why We Still Look at Heart Rate
One of the old standards is Heart Rate. For decades, Heart Rate was a practical way to measure intensity. It could also be used to measure recovery, hydration, and fatigue.
We cannot look at wattage alone. We have to look at wattage as an extrinsic force. When we look at heart rate, this is an intrinsic force. Both bring value.
Here’s an example:
[caption id="attachment_1288" align="aligncenter" width="600"] Looking at Wattage and MPA only, this cyclist did not work too hard.[/caption]
This cyclist was given a workout of 60 minutes. The main set of intervals were 2 minutes long, with one at the end which was very intense and would hopefully yield a breakthrough per Xert.
If we look at the wattage chart alone, it shows a successful workout. MPA dropped, then rose, and the final interval yielded a CLOSE CALL, but not quite a breakthrough. Watts followed the load very closely.
However, when heart rate is revealed, it shows something more.
More Fitness Breakthroughs with W Prime on PerfPro Studio
W Prime Provides a VISUAL approach to Intensity and Fatigue. I posted a few days ago about how my clients were successfully using the W Prime feature on PerfPro Studio, to achieve fitness breakthroughs. Well, it’s happened again. The second day of testing consisted of a 5 minute, 3 minute, and 1 minute test. I […]
Using W Prime in PerfPro Studio To Get the Most Out of Your Body
[caption id="attachment_1276" align="aligncenter" width="1024"] What’s that Green Line? That’s Your W Prime Line![/caption]
W Prime is a great way to measure your training load.
Not everyone owns a power meter for their bike. Some people do not want to make the investment in equipment. Some just want a great workout and want to see how hard they can push their bodies. W Prime in PerfPro Studio is a great tool to help athletes measure their effort better.
PerfPro Studio has added features almost weekly now for several years. This is a robust, solid training platform that is my go-to for indoor studios. It is consistent and is easy to operate. PerfPro Studio shows riders what they need to know, both on a dashboard and graphically, so they can achieve their goals.
Since 2015, I have been employing W Prime testing at my studio, Cycling Center Dallas. It’s a great tool, and in this post I show you how to put W Prime to work for you.
Interval Shapes – Intensity Over Time
[caption id="attachment_1064" align="aligncenter" width="806"]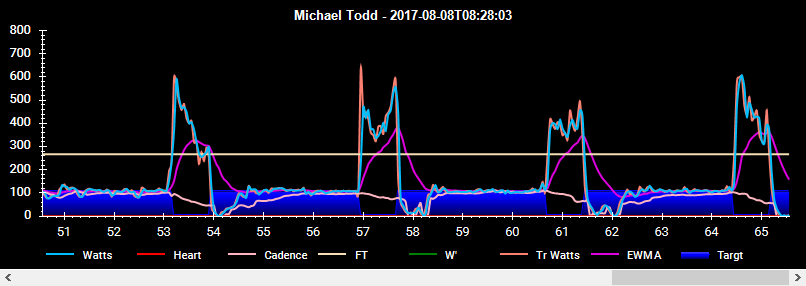 Which Interval Led to the highest average power?[/caption]
Take a look at this graph. Each interval has a different shape. It shows four separate 45-second intervals of maximal effort, on a 4% slope. I used PerfPro Studio to design this workout. Recoveries were three minutes each.
We also need to take into account that these intervals are taken 53 minutes into a 60 minute workout. The rider was fatigued, but the lesson is still relevant.
In this post I’ll show you how to use not just intervals but interval shapes to craft your intensity over time for maximum gains in fitness and available power.
“On The Fly” FTP: Using Xert’s What’s My FTP App On Your Garmin
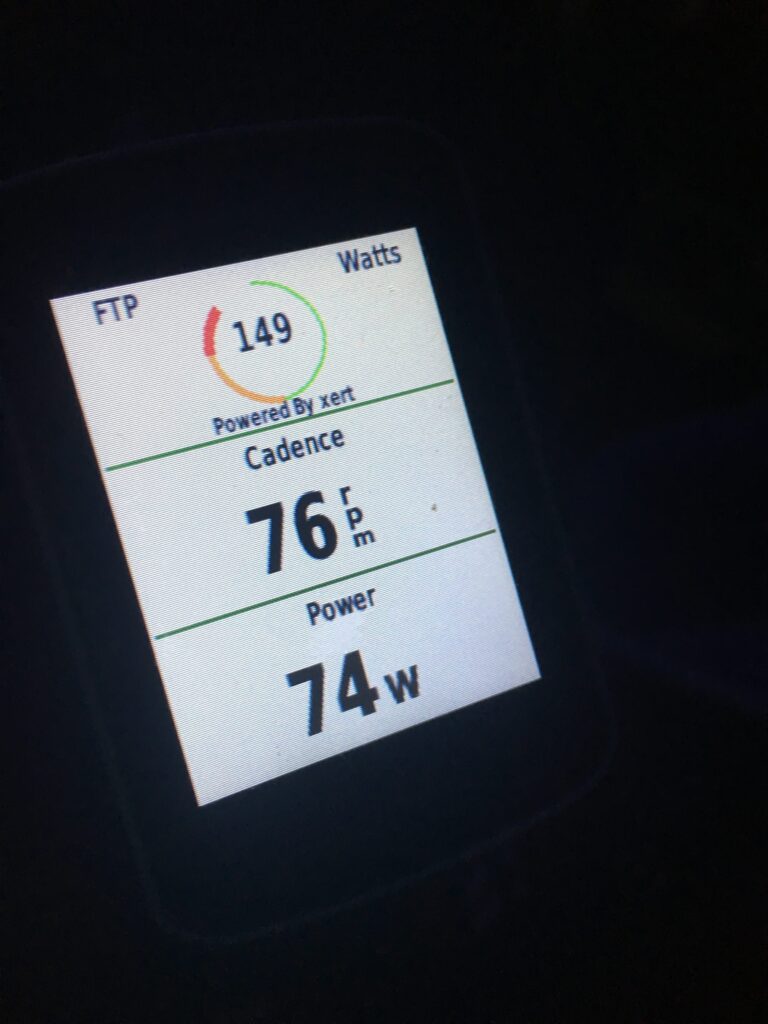
Not even a month ago, Xert by Baron BioSystems, released What’s My FTP? on the Garmin Connect IQ ecosystem. The premise is simple: if you have a smart Garmin head unit (520, 820, 920, 735, 1000) and an on-bike power meter, you can determine your Functional Threshold Power (FTP) with just a few solid, hard efforts, over a period of time.
I’m always skeptical about new product claims, but given Xert’s incredibly short but solid track record of apps that are dead-nuts on, I decided to give What’s My FTP a try. I put it to work for two of my clients, and all I can say is Wow—the results are incredible!
Now let’s show you how to get the same results for yourself.
Xert and Texas Mountain Biking, Part One
If you follow these posts, you know that I recently installed a power meter on my mountain bike, and began using it to study the demands that mountain biking requires for fitness. I installed it just before a trip to Arkansas, where my wife and I rode the Womble Trail, and I have since ridden […]