The “Hard-Start” Evolution: Pushing the Limits of the Rønnestad Protocol
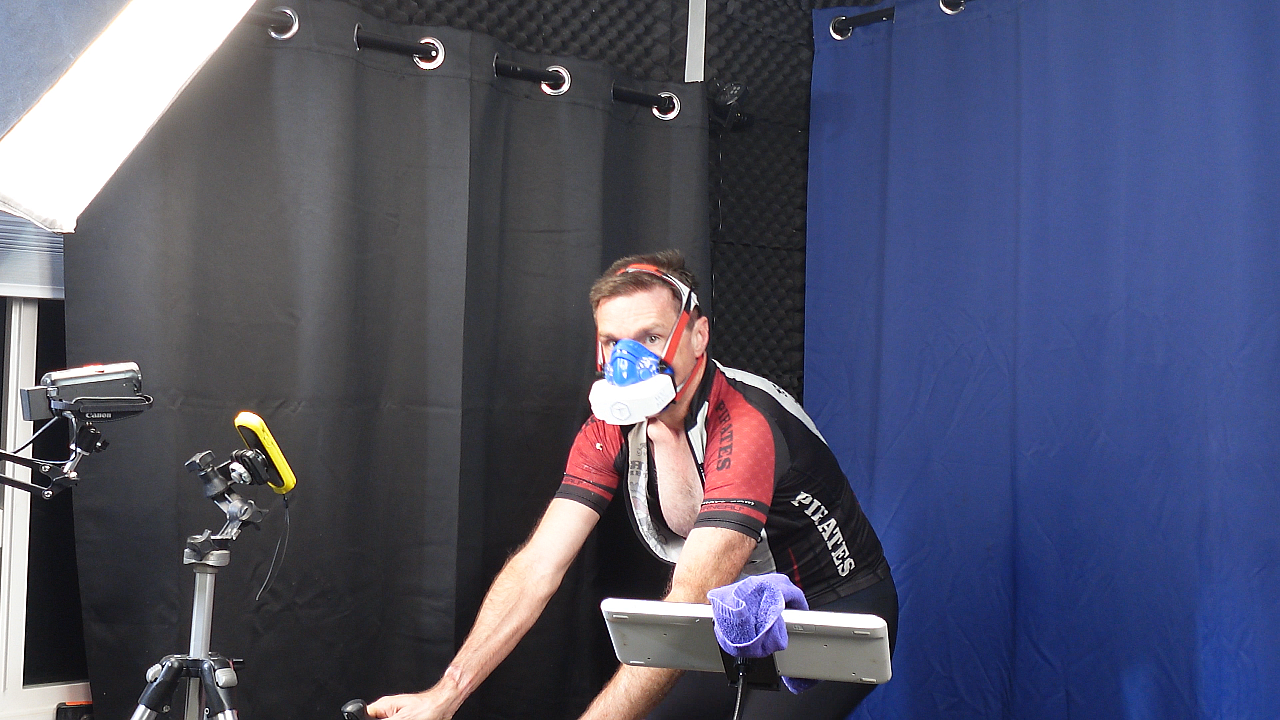
Testing the Ronnestad Hard-Start Intervals protocol this week provided a fascinating look at oxygen kinetics and internal load. Before this session, I attempted to link my VO2 Master to the phone for a full metabolic calibration. Despite several attempts, the mask simply wouldn’t handshake. Rather than wasting the training window, I abandoned the mask and shifted to a high-fidelity sensor stack to analyze these specific intervals.
This pivot turned the session into a fascinating case study. Instead of direct oxygen consumption data, I relied on Alpha-1 (via Alpha-HRV), Moxy (SmO2), and Wattage to see if Ronnestad Hard-Start Intervals actually deliver the intended physiological strain without a metabolic cart.
The Protocol: Ronnestad Hard-Start Intervals (1+9 Extension)
As I discussed in my recent analysis of the Power Illusion, chasing a specific FTP number can often mask the true physiological cost—a reality that the Ronnestad Hard-Start Intervals aim to exploit by priming the aerobic engine from the first pedal stroke.
Following the landmark research by Rønnestad, Rømer, and Hansen (2018) and Bossi et al. (2020), I executed a “Fast-Start” strategy. While the studies typically look at a 4–6 minute threshold tail, I pushed the threshold phase to a full 9 minutes. This creates a 10-minute block that challenges the limits of Time-to-Exhaustion (TTE).
Set 1: Setting the Metabolic Floor
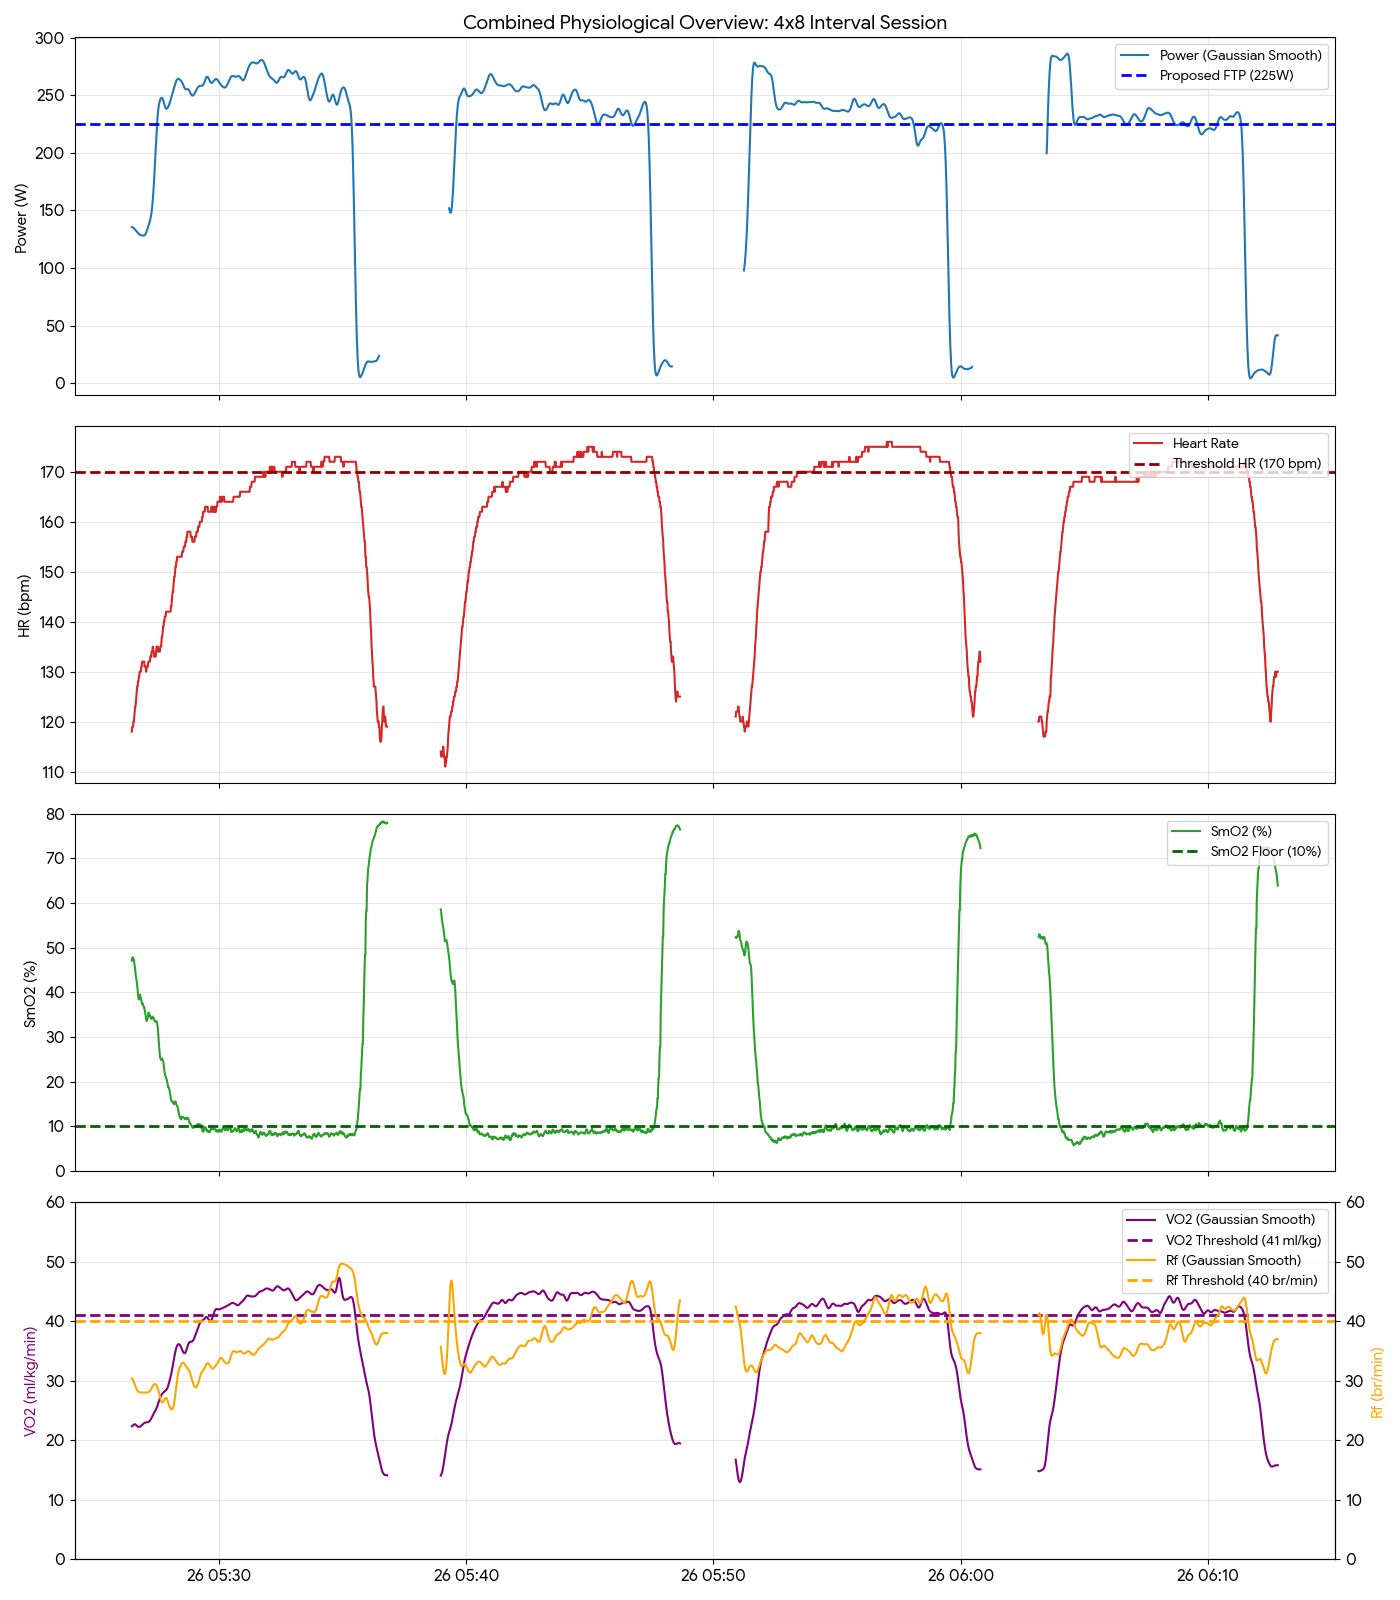
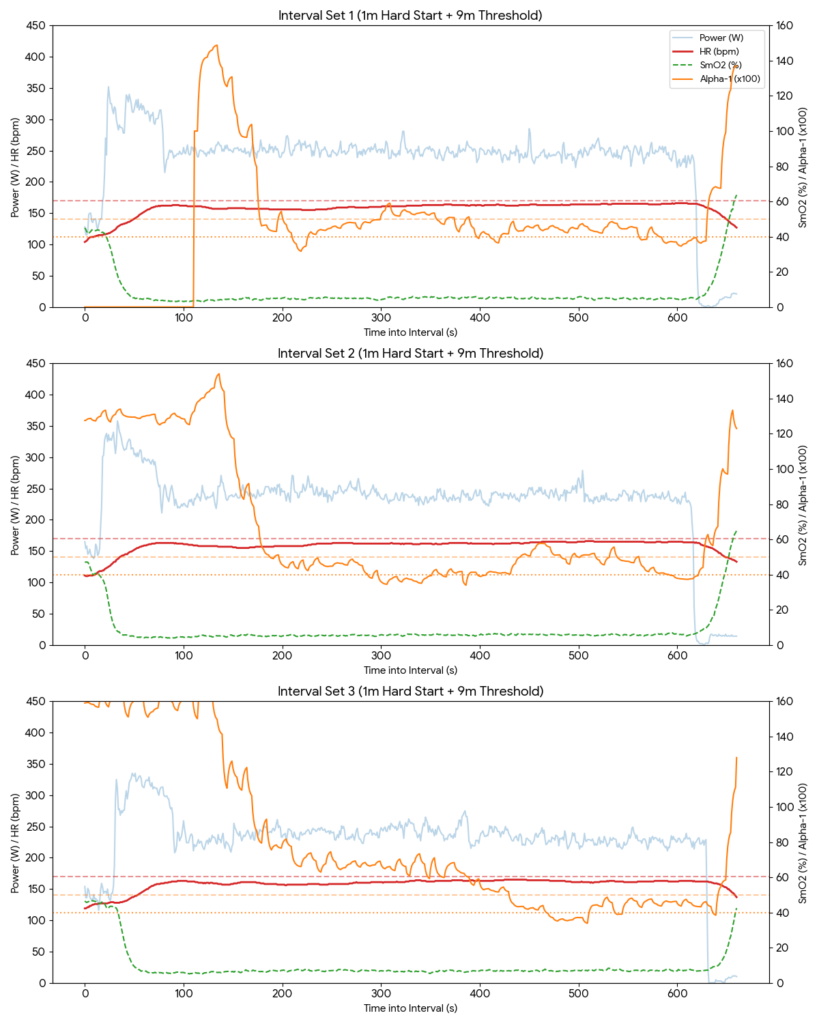
The first set of these Ronnestad Hard-Start Intervals was a masterclass in the Hard-Start effect. By launching with a 1-minute anaerobic surge, my oxygen uptake was “primed” almost instantly. Notice in the chart how the SmO2 (green dashed line) drops to near zero within the first 60 seconds and stays pinned there for the duration of the 9-minute tail.
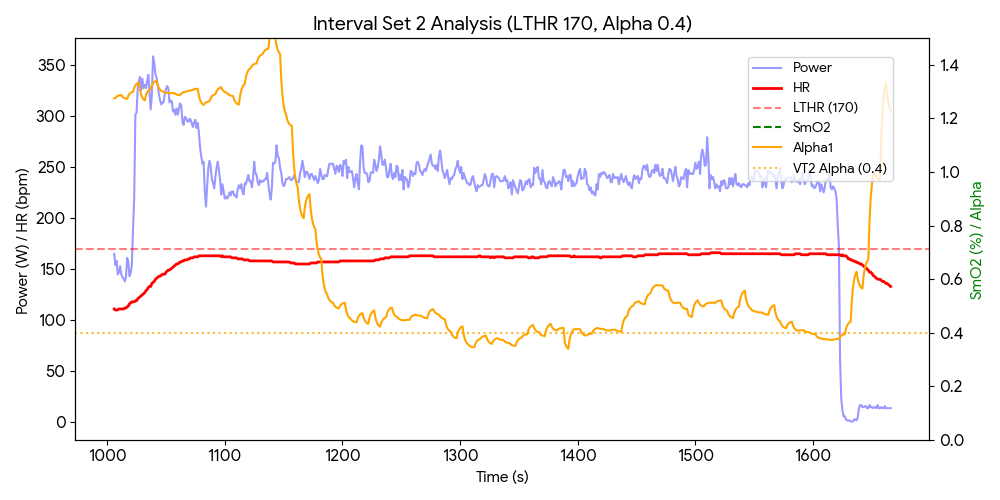
Set 2: The Autonomic Groove
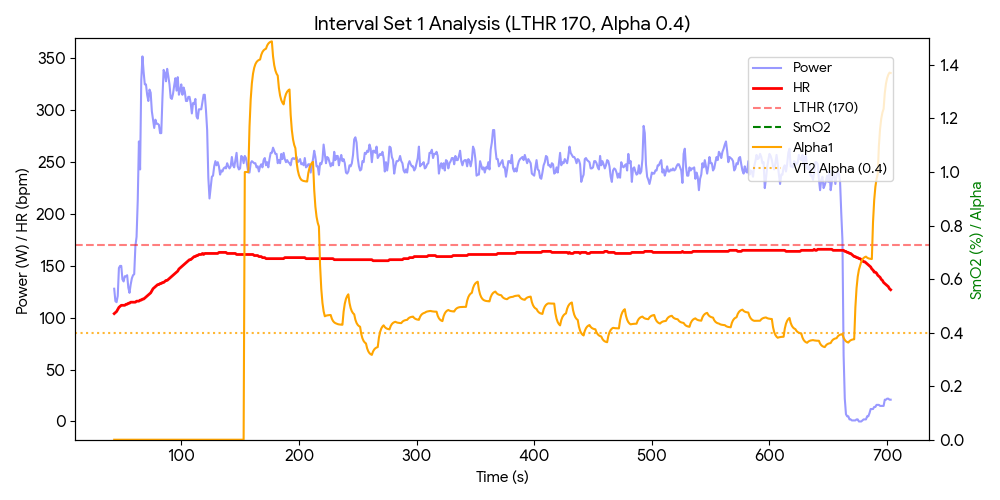
By the second set, the cardiovascular system had fully stabilized. My Alpha-1 values hit their lowest point (0.44), proving that despite a slightly lower average power, the autonomic nervous system was deeper into the threshold domain. This is where the 1+9 structure really shines—building the resilience to hold threshold power under significant central stress.
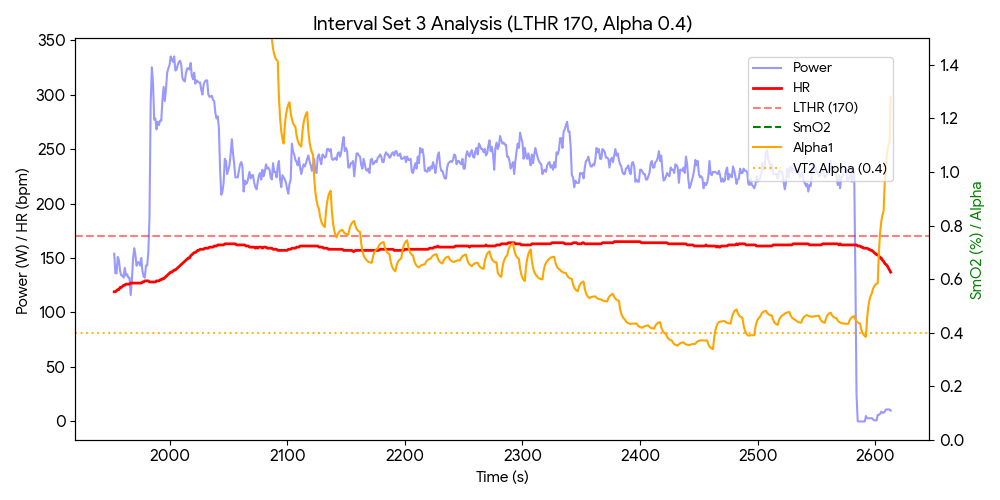
Set 3: The Grind of Respiratory Drift
In the final set, the legs began to fade, but the lungs took over. While power dropped to 235W, my combined Respiratory Rate climbed to 42.3 bpm. This ventilatory drift is a clear signal of the body working harder to clear metabolites, confirming that I was still at my physiological limit even as the wattage declined.
Comprehensive Performance Summary
| Set | Period | Power (W) | HR (bpm) | Alpha (α1) | SmO2 (%) | RR (bpm) |
|---|---|---|---|---|---|---|
| 1 | Last 6m | 247.7 | 162.6 | 0.46 | 5.0 | 40.3 |
| 2 | Last 6m | 239.4 | 163.3 | 0.44 | 5.7 | 40.3 |
| 3 | Last 6m | 235.1 | 162.1 | 0.54 | 6.9 | 42.3 |
Garmin Metrics: Influencing the On-Board Insight
I am on a mission to become the go-to authority for Garmin’s on-board metrics. These insights are often overlooked by ‘pro’ athletes, but for those of us obsessed with physiology, they are pure gold. My Performance Condition started at a strong +4, signaling great recovery, but drifted down to -2 by the final set—a perfect mirror of muscular fatigue.
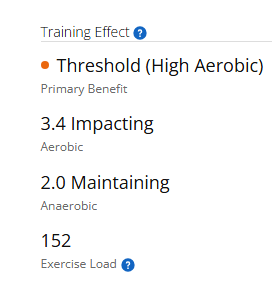
Garmin Metric Scorecard
- ✅ Aerobic Training Effect: 3.8 (Improving)
- ✅ Anaerobic Training Effect: 2.0 (Maintaining)
- ✅ Exercise Load: 152
- ✅ Peak EPOC: 191 ml/kg
The Stamina Rebound
One of the most impressive Garmin metrics from this session was the Real-Time Stamina decay. As shown in the tight-scale analysis below, the 1-minute “Hard-Start” creates a sharp, vertical drop in stamina, which then stabilizes as I hold the threshold tail below my LTHR of 170 bpm. This proves the protocol is intense but metabolically sustainable for well-trained athletes.
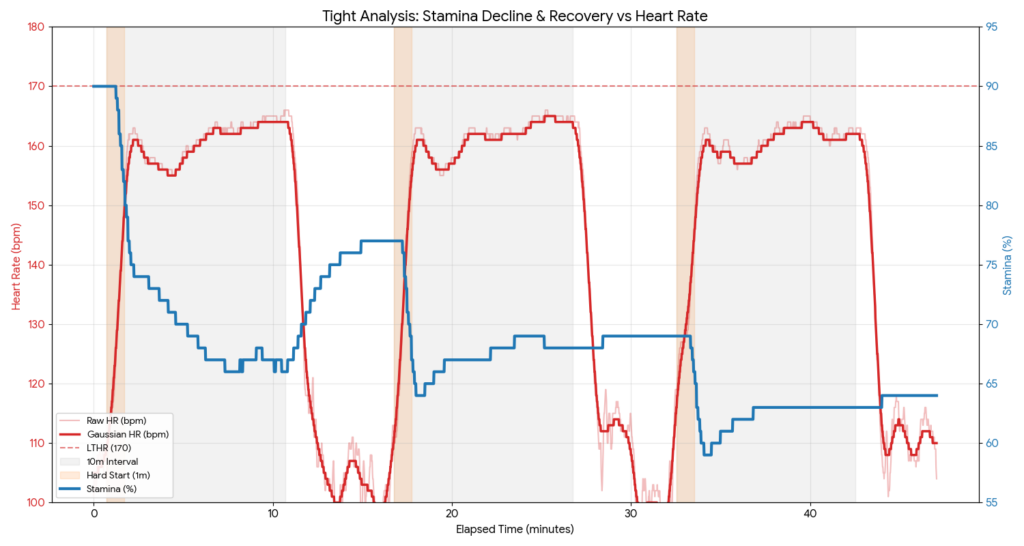
@Garmin: This is how you use data to drive performance.