The Power Illusion: Resetting 20 Years of Training with Physiological Data
After 20 years of cycling, I realized my FTP wasn’t telling the whole story of my actual physiological threshold. My identity as a cyclist was defined by a single, flickering number on a head unit: Watts. If you’ve spent any significant time in the saddle, you know the culture of the “Power Meter Era.” We treat our Functional Threshold Power (FTP) like a sacred status symbol. If the screen says 250W and we can grit our teeth through an interval, we convince ourselves that we are “fit.” We ignore the burning in the lungs and the thumping in the chest because the power meter says we are in the “right zone.”
But this past Thursday, during a classic session of 4×8-minute intervals, that identity was fundamentally challenged. By integrating the VO2 Master, the Moxy SmO2 sensor, and AlphaHRV, I’ve finally started to look “under the hood” of my own performance. What I found was a stark reality: my power meter has been lying to me—or rather, I have been using it to lie to myself.
The Rogers Protocol: Anchoring to the Autonomic Truth
My shift in perspective is rooted in the “Physiology First” approach championed by Dr. Bruce Rogers on his Muscle Oxygen Training blog. Rogers argues that external load is just a proxy for the real work being done by the body. To understand our true limits, we must monitor the autonomic nervous system and metabolic state directly.
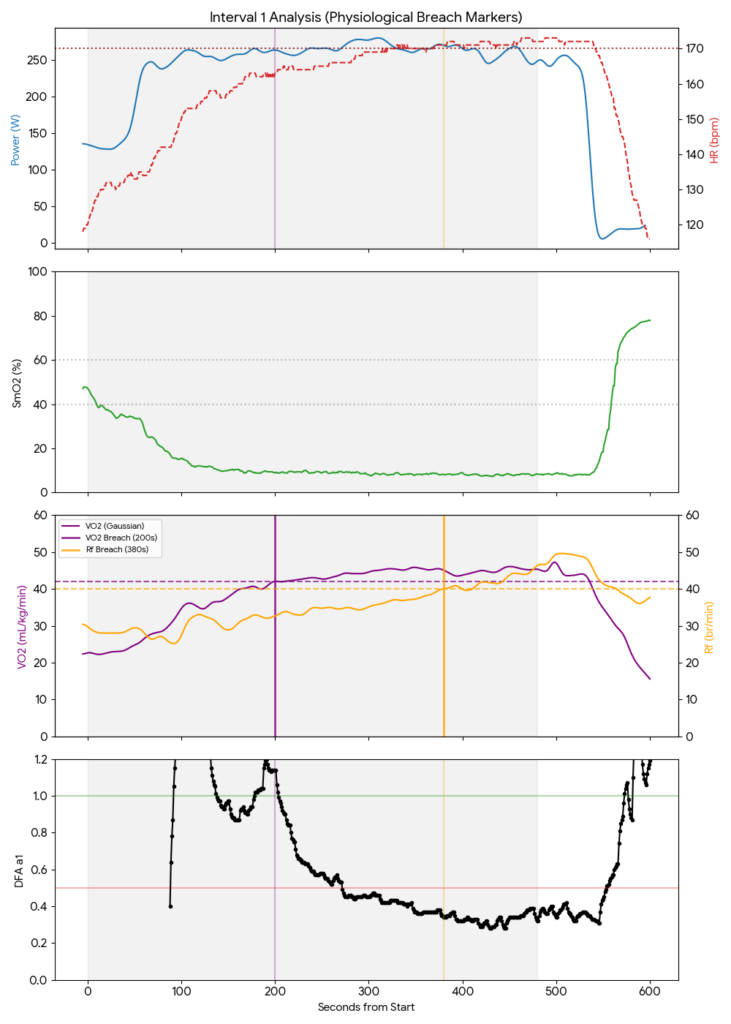
One of the most critical markers we used is DFAA-1 (calculated via AlphaHRV). Following Rogers’ protocol, we anchor the First Ventilatory Threshold (VT1) at a DFAA-1 value of 1.00. This is the point of maximal aerobic efficiency and fat oxidation. As intensity increases, fractal correlation drops. Once you hit 0.50, you have reached the Second Ventilatory Threshold (VT2), commonly known as the “Threshold.”
Anything below DFAA-1 = 0.50 is Supra-Threshold (Zone 3). In Thursday’s session, my DFAA-1 didn’t just touch 0.50; it crashed into the 0.30s.My ‘Threshold’ power was actually triggering a high-stress, VO2 Max-style response far above my actual physiological threshold.
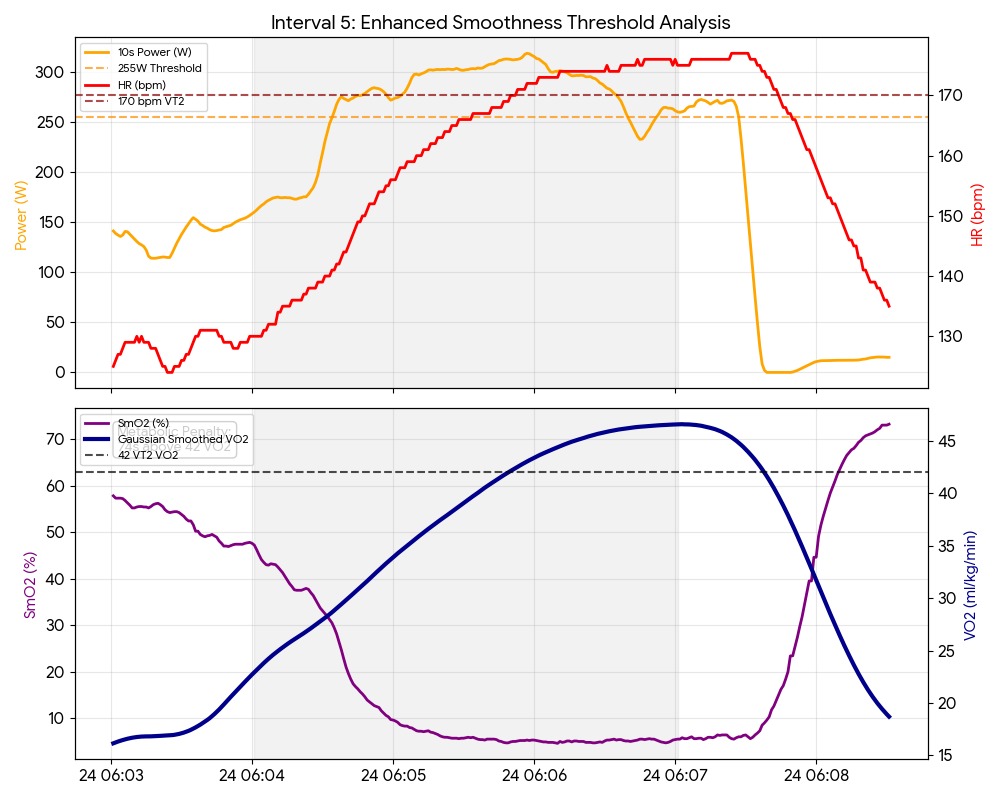
Analyzing the Map: Mapping My Physiological Threshold
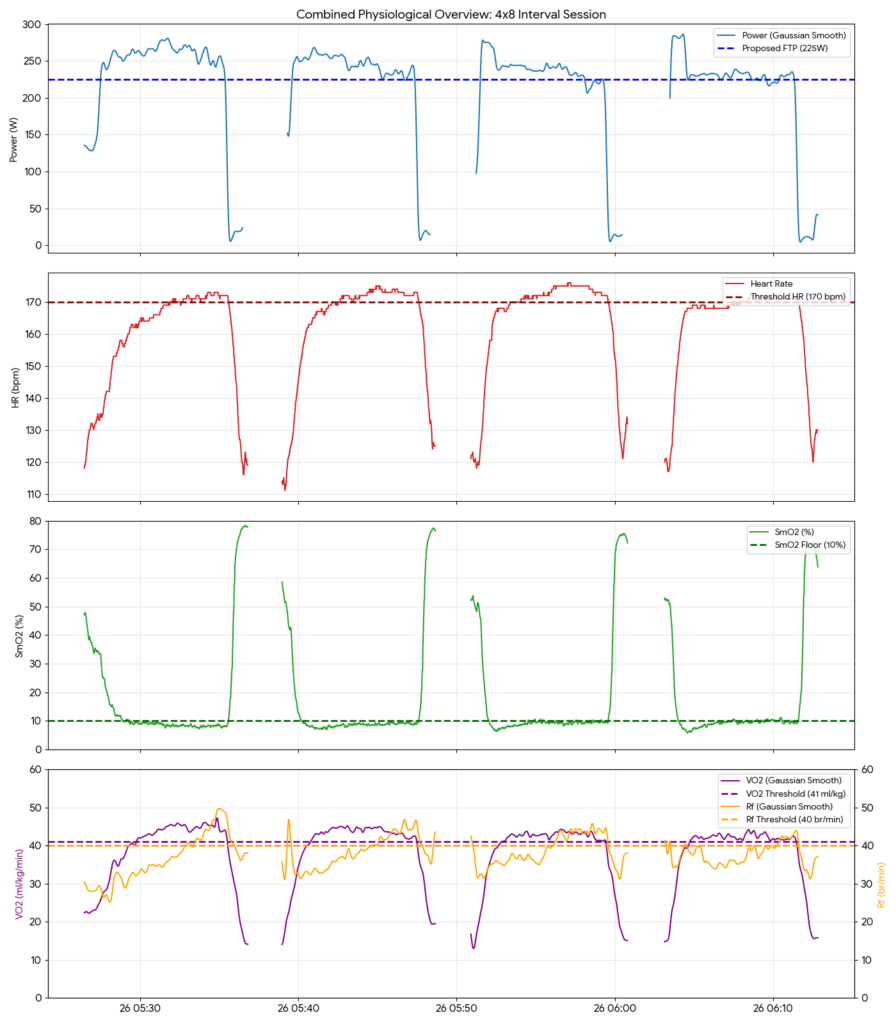
To visualize my physiological threshold, we generated a combined overview with Gaussian smoothing… We established four horizontal “ceilings” to identify where the body begins to fail:
- Heart Rate Ceiling: 170 bpm
- VO2 Ceiling: 41 mL/kg/min
- SmO2 Floor: 10%
- Respiratory Frequency (RF) Ceiling: 40 breaths/min
(Refer to: session_overview_combined_gaussian.png)
-
The Power vs. FTP Gap
In the top panel, the blue line represents my power. I’ve added a dashed line at 225W, which I now believe is my “True” FTP. Look at the intervals: I was consistently trying to hold 240-260W. Every time I stayed above that 225W line, every other physiological metric in the charts below began to “redline.”
-
Heart Rate and the Drift to 170
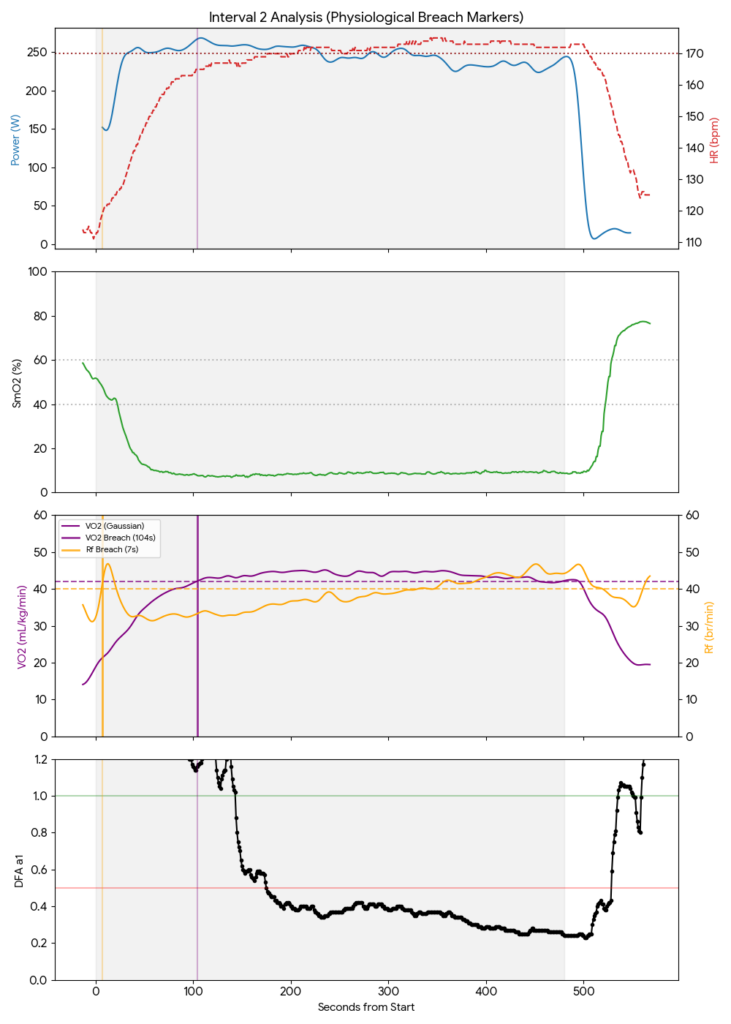
The HR chart shows a classic “upward drift.” In a sustainable threshold set, the HR should stabilize. Instead, by Interval 3 and 4, my heart rate pierced the 170 bpm ceiling and stayed there. Even as my power actually dropped in the final set, my heart rate remained elevated, proving that the cardiovascular system was working harder and harder just to produce less and less work.
-
SmO2 and the Physiological Threshold
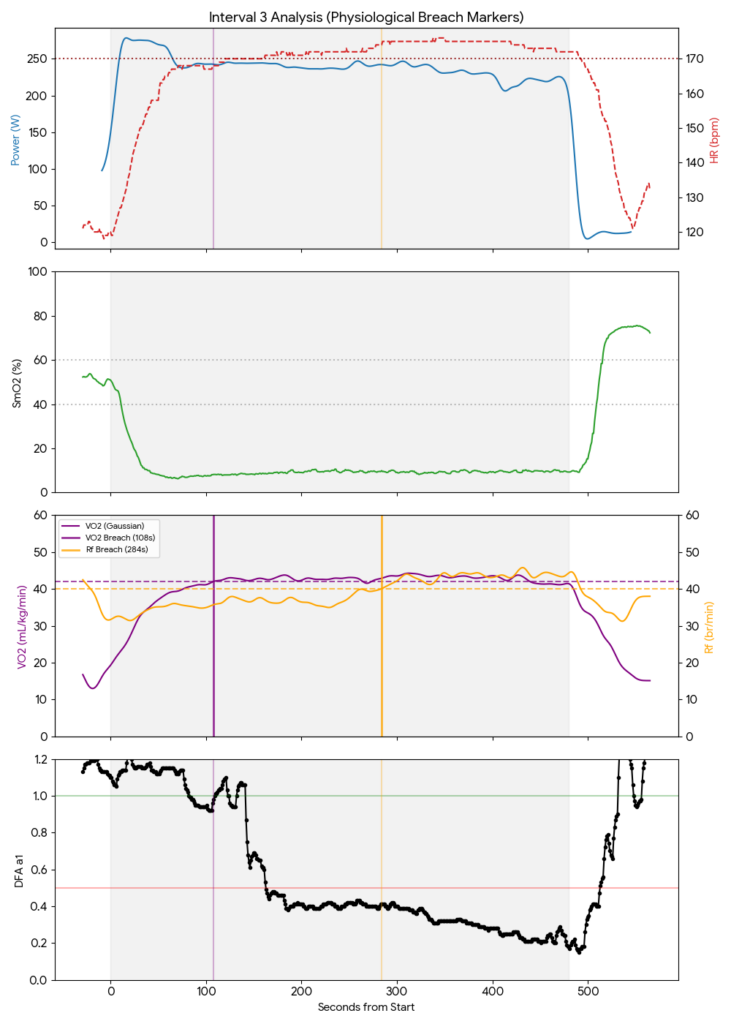
The Moxy sensor (SmO2) provides perhaps the most visceral data. We set a “floor” at 10%. In every single interval, my muscle oxygenation crashed straight through that floor. By the end of Interval 1, I was at 8.3%. This isn’t a “steady state” threshold; this is a “severe” state of desaturation. I was effectively suffocating my quads, forcing a massive reliance on anaerobic glycolysis that my aerobic system couldn’t keep up with.
-
VO2 and Respiratory Frequency: The Redline
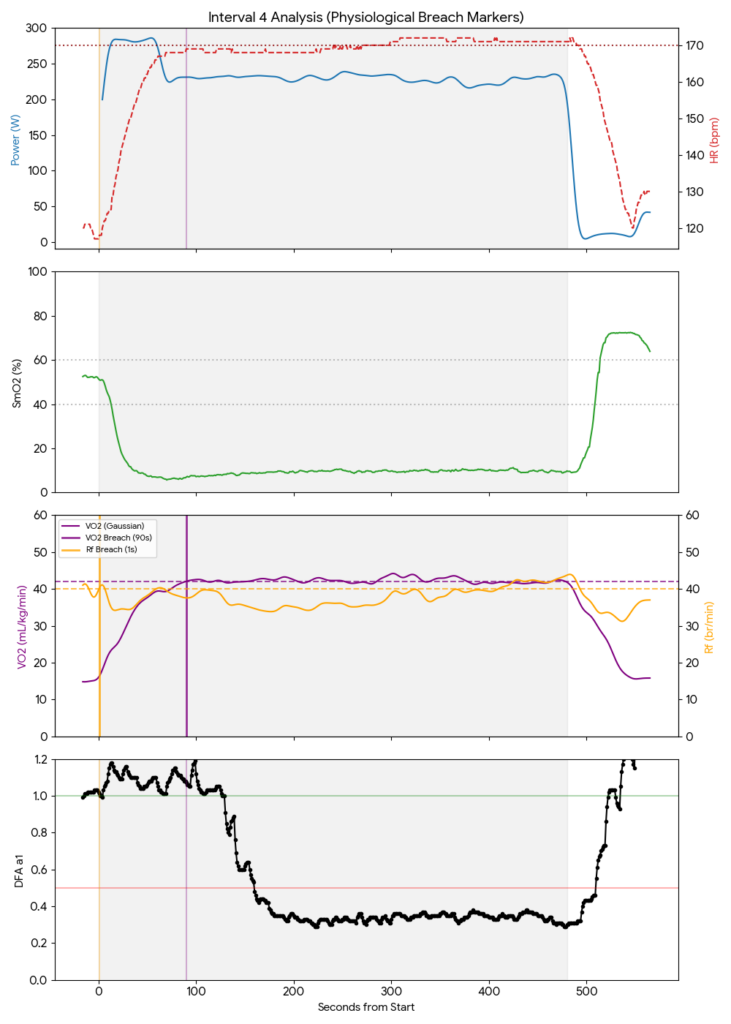
The bottom panel shows the VO2 and RF data. I set the thresholds at 41 mL/kg/min and 40 breaths/min.
Notice the “piercing” effect. In Interval 1, it took nearly 200 seconds to breach these limits. By Interval 4, I was breathing at 40+ breaths/min within seconds of starting the work. My body was frantically trying to blow off Co2 to compensate for the rising acidity in my blood—a hallmark sign of being well above VT2.
The Recovery Paradox: The “Shallow Hole” Theory
The recovery data between these intervals offered a fascinating insight into fatigue. Traditionally, we think “faster recovery = better fitness.” On Thursday, my recovery speed actually increased as the workout went on:
- Interval 1: Took 86 seconds to reach 60% SmO2.
- Interval 4: Took only 34 seconds to reach 60% SmO2.
On the surface, it looks like I was getting fitter as I got more tired. In reality, it was the opposite. Because my power had dropped (from 265W to 228W), I was no longer capable of digging a deep metabolic hole. I “recovered” faster because I was doing less work. My muscle was so fatigued it couldn’t even pull enough oxygen to keep the saturation low. I wasn’t “recovering better”—I was “failing more efficiently.”
Conclusion: Training the Engine, Not the Ego
After 20 years of cycling, the hardest climb isn’t a 10% grade; it’s admitting that your FTP is 25 watts lower than you thought it was. But the data from the VO2 Master and the Moxy doesn’t have an ego; it simply defines the physiological threshold as it truly is.
If I want to build true aerobic durability, I must stop chasing the 250W phantom. My new training model is simple:
- FatMaxx: Keep DFAA-1 at 1.00.
- Threshold: Keep power near 225W and ensure RF stays below 40.
- The Redline: If SmO2 drops below 10% or HR stays above 170, I am over-reaching.
It’s time to stop training for the numbers on the screen and start training for the engine inside the chest. By listening to the oxygen, the breathing, and the autonomic nervous system, I’m finally building a foundation that is backed by science, not just vanity.