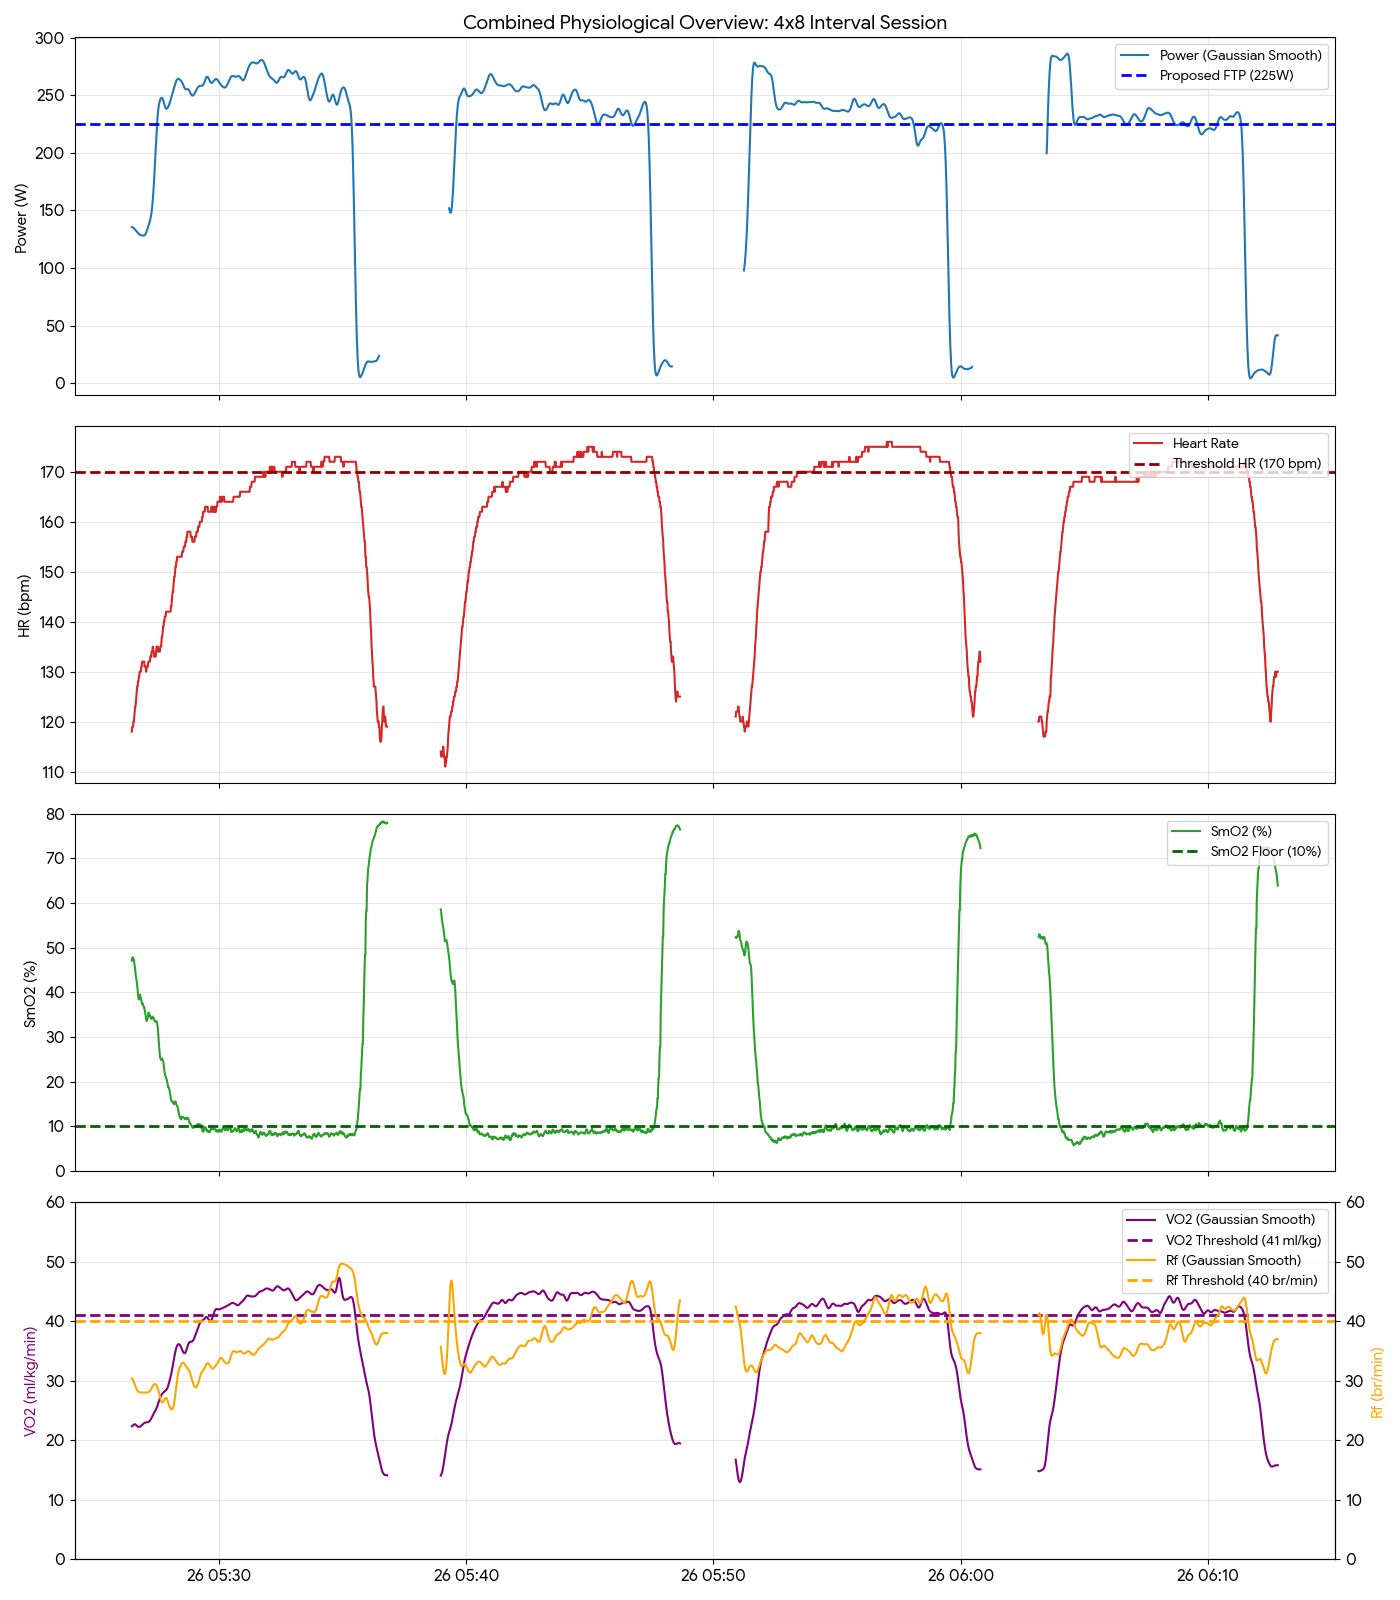
Physiological foundations to Help Us Understand How to Optimize our “Base” Training
On Christmas Day, I performed a 60-minute workout on PerfPro Studio. I also recorded the data on Vo2master software. The goal was two-fold. I wanted to perform a ramp test, to try and determine Physiological baselines, specifically Heart Rate at DFAA-1 0.75 and 0.500. I also wanted to see if I could determine Ventilatory Threshold 1 and Ventilatory Threshold 2. Finally, I wanted to determine whether I could ‘See’ deflection points via SmO2.
With this information, I can work on adaptation to higher loads of power and traditional heart rate.
Work With Dr. Bruce Rogers
I remain indebted to Dr. Bruce Rogers of Florida, who has both the expertise in DFAA-1 analysis, as well as extra tools for interpretation that I lack. The information I provided him through the Vo2master data, provided this analysis…
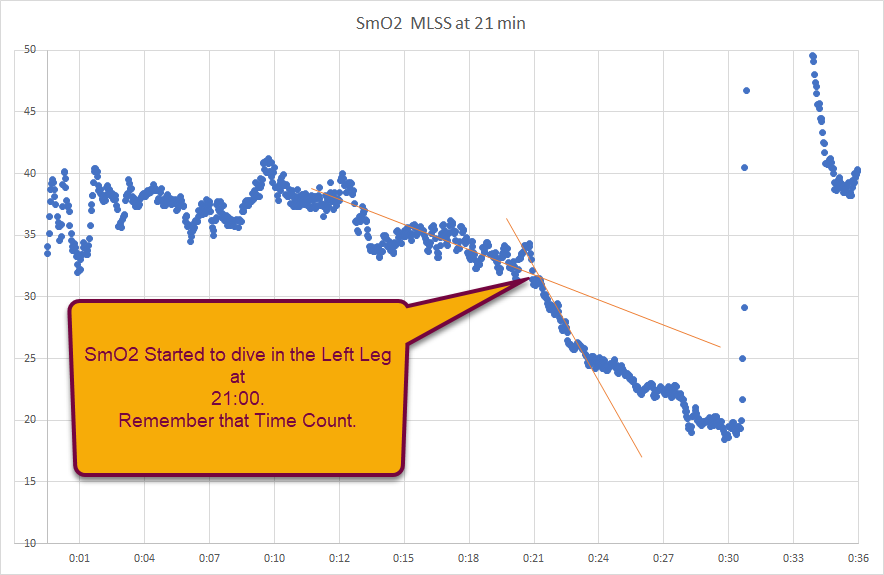
“…Richard, the “breakpoint” on the Moxy (SmO2) occurs at 21min:”
“…HRVT1 (Heart Rate Variation Threshold 1) occurs at 16:00.” (This is the Physiological value for “Lower Threshold” Intensity. It’s an intensity below which, a cyclist is highly aerobic).
“…HRVT2 (Heart Rate Variation Threshold 2) occurs at 21:00.” (This is Physiological value for “Functional Threshold” Intensity. Above this value, a cyclist is on ‘borrowed time’. Below this value, a cyclist is operating on an aerobic intensity that is sustainable.)
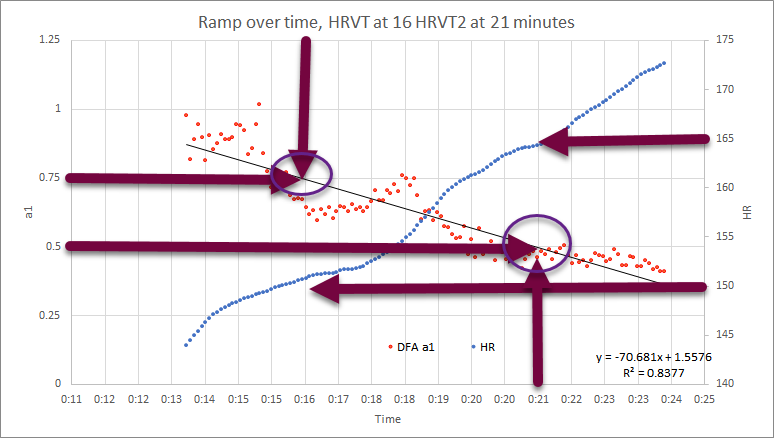
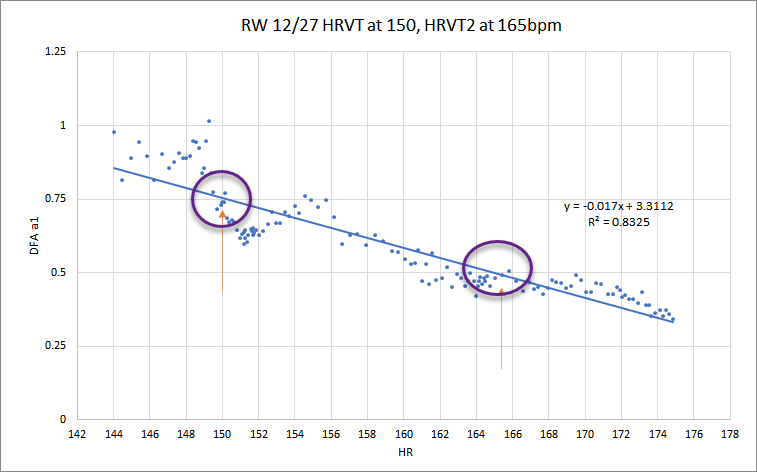
…Here is the DFAA-1 and Heart Rate chart. Arrows are at 0.75 (HRVT1), and 0.50 (HRVT2)
Physiology and Physics….
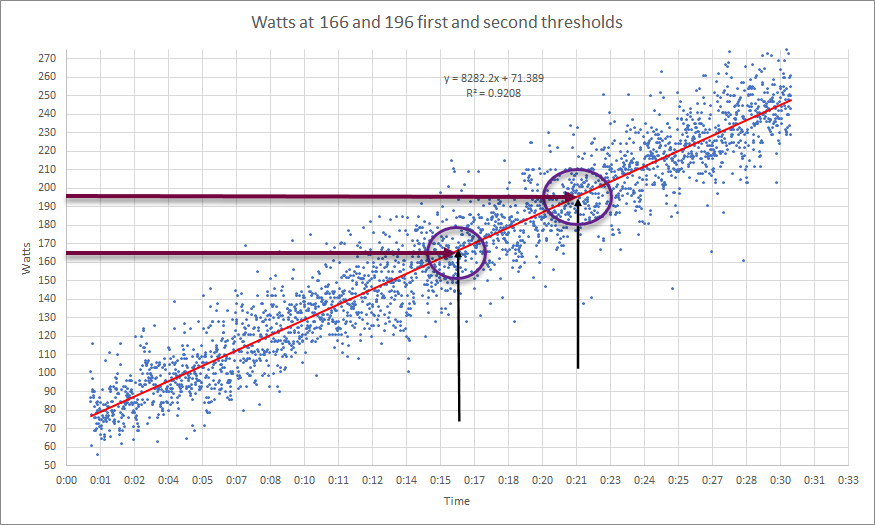
…Here’s the final chart. It takes time and power from the ramp workout. The arrows align with 16 minutes (150bpm/0.75 DFAA-1), and 21 Minutes (165bpm/0.50 DFAA-1/SmO2 Breakpoint).
Physiological Summary
Both SmO2 {Breakpoint from Graph 1} and HRVT2 (DFAA-1 of .50), agree that you have a breakpoint at 21 min or about 200w.
HRVT1 (DFAA-1 0.75, 150bpm, or about 165 watts) is in its’ usual place, give or take.
So there you have it; we have THREE physiological markers for my fitness.
DFAA-1 IN THIS CASE, hit 0.75 around 150 bpm and 165 watts.
DFFA-1 IN THIS CASE, hit 0.50 around 165 bpm and 196-200 watts.
I’m going to use this information to try and GROW these values so that DFAA-1 reaches 0.75 at a HIGHER heart rate and wattage, over LONGER periods of time.
Let’s see where this goes.
Here’s a video I made PRIOR to my email exchange with Dr. Rogers. In it, you can see where I went WRONG and RIGHT with my solo interpretation of my physiological baselines.
Thanks for reading, thanks for watching, and ENJOY THE RIDE!