Living in the Parabolas: Decoding Metabolic Inertia and the Billat
In our last deep dive, we dissected the steady-state grind of and intervals. Those workouts are the bread and butter of threshold development. However, today we are stepping into the “red zone” to explore Veronique Billat’s 90/90 Metabolic Inertia. Using the combined precision of the VO2master, Moxy Monitor, and AlphaHRV, we can finally visualize a phenomenon that most athletes only feel. This phenomenon is the body’s “lag” in adjusting to intensity changes. Consequently, when used correctly, it acts as a physiological cheat code for maximizing your training time.
Using the combined precision of the VO2master, Moxy Monitor, and AlphaHRV, we can finally visualize a phenomenon that most athletes only feel: metabolic inertia. This is the body’s “lag” in adjusting to intensity changes, and when used correctly, it’s a physiological cheat code.
The Billat Philosophy: Hunting Time at
The primary goal of high-intensity aerobic training is to spend as much time as possible at 90% to 100% of your maximal oxygen consumption (VO_2max). Unfortunately, a continuous all-out effort usually leads to muscular failure before the heart and lungs have spent enough time at their limit. Therefore, adaptation can be difficult to trigger with standard methods.
Véronique Billat’s solution was the 30-30 and 60-60 protocol. This involves 30-60 seconds at vVO2max or wVo2max, followed by 30-60 seconds of active recovery. Because your metabolic systems do not drop as fast as your power output, you stay in the “VO2 State” even while resting. This is the heart of Billat 90/90 Metabolic Inertia.
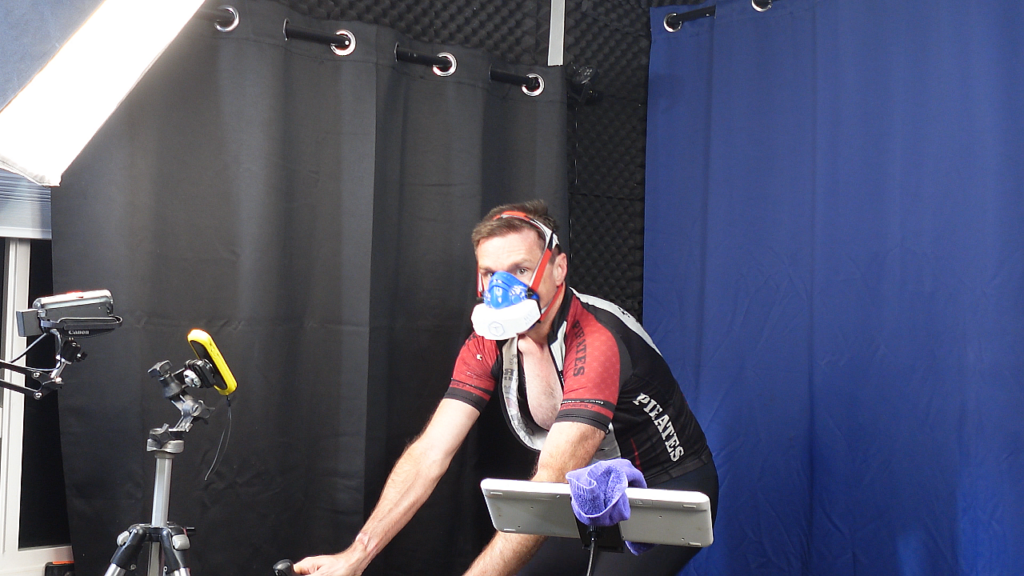
The Tech Stack: The Rogers Protocol in Action
To capture this data, we utilized a multi-layered sensor stack.
- First, we measured the metabolic response using the VO2master.
- Next, we monitored internal load through AlphaHRV and the RR-A1 Ratio.
- Finally, we tracked local oxygen supply with the Moxy Monitor.
In the analysis below, we have applied a 10-second smoothing to highlight these trends clearly.
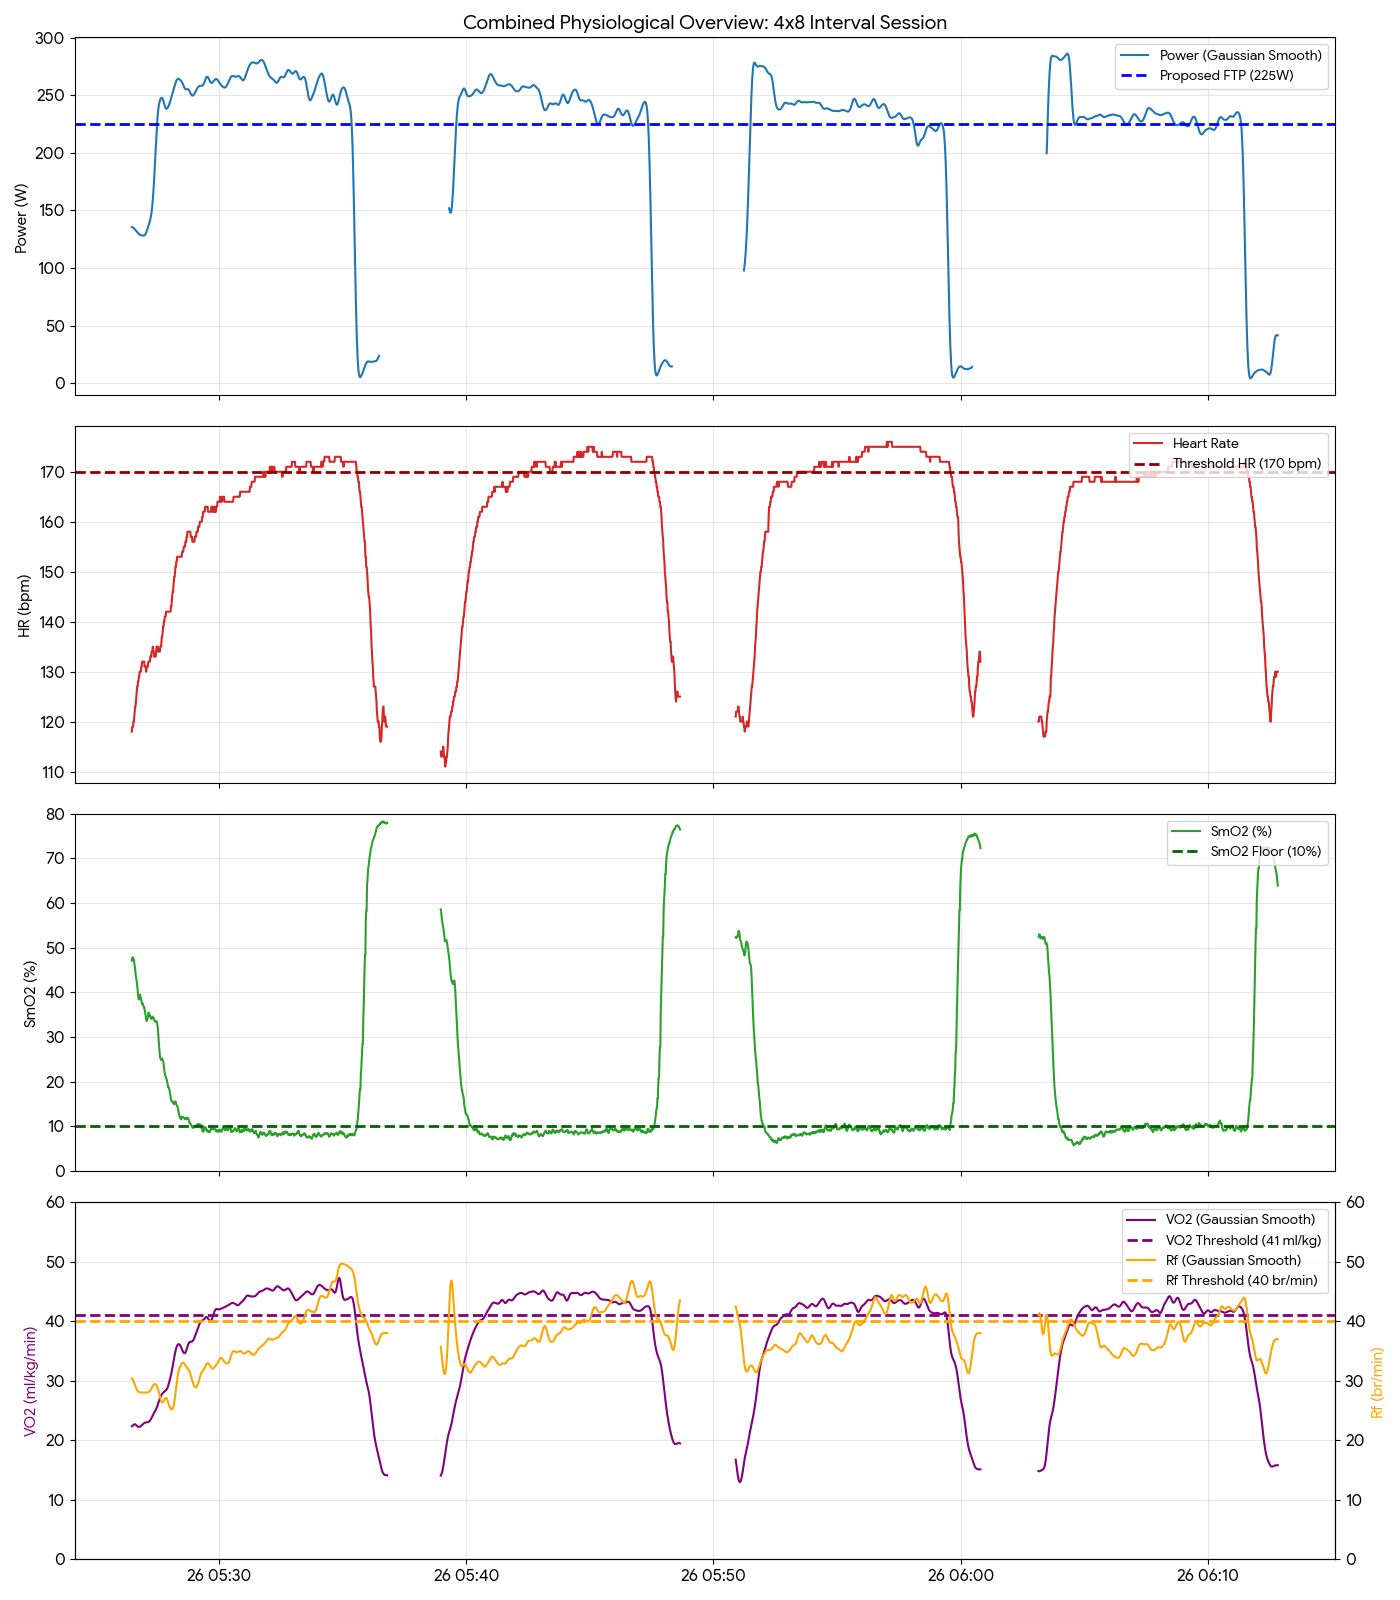
Set 1 Analysis: Building the Staircase
During the first set, I watched the body slowly “warm up” to the intensity. Even with a proper lead-in, it takes several intervals for the $VO_2$ and Heart Rate to reach their sustained peaks.
Set 1: Metabolic & Power
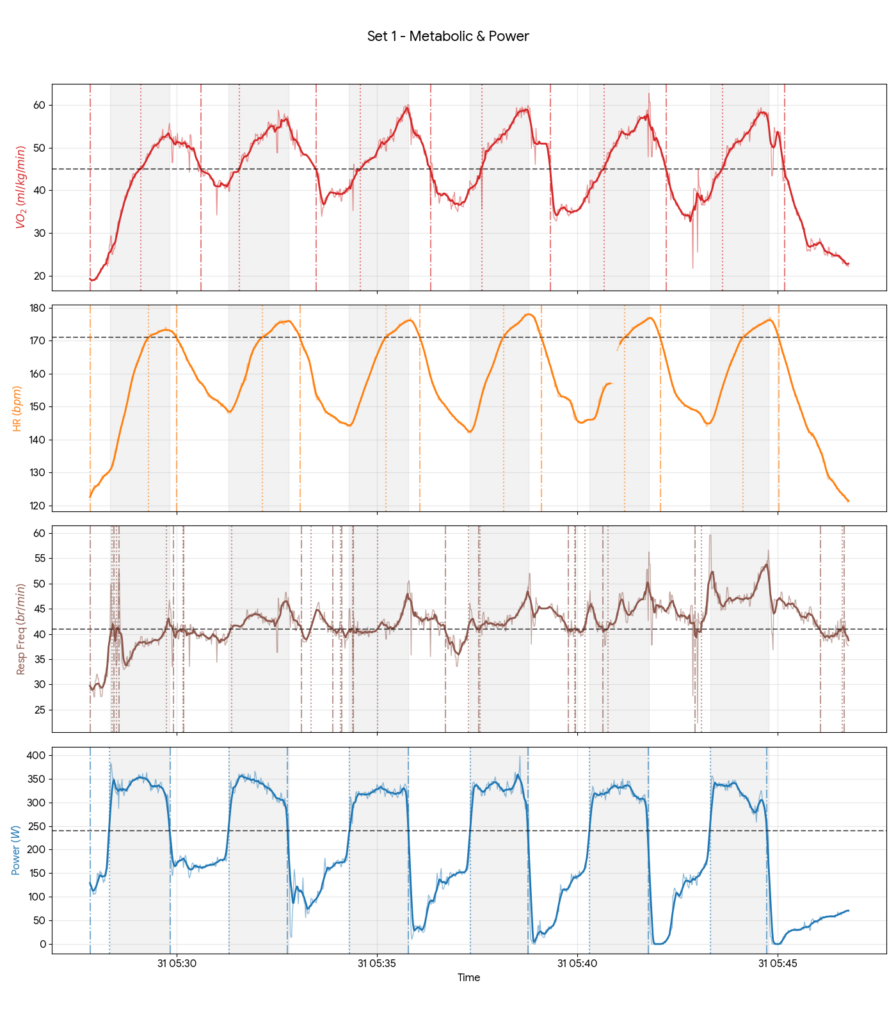
Notice the Vertical Dotted Lines (Entry) and Dash-Dot Lines (Exit).
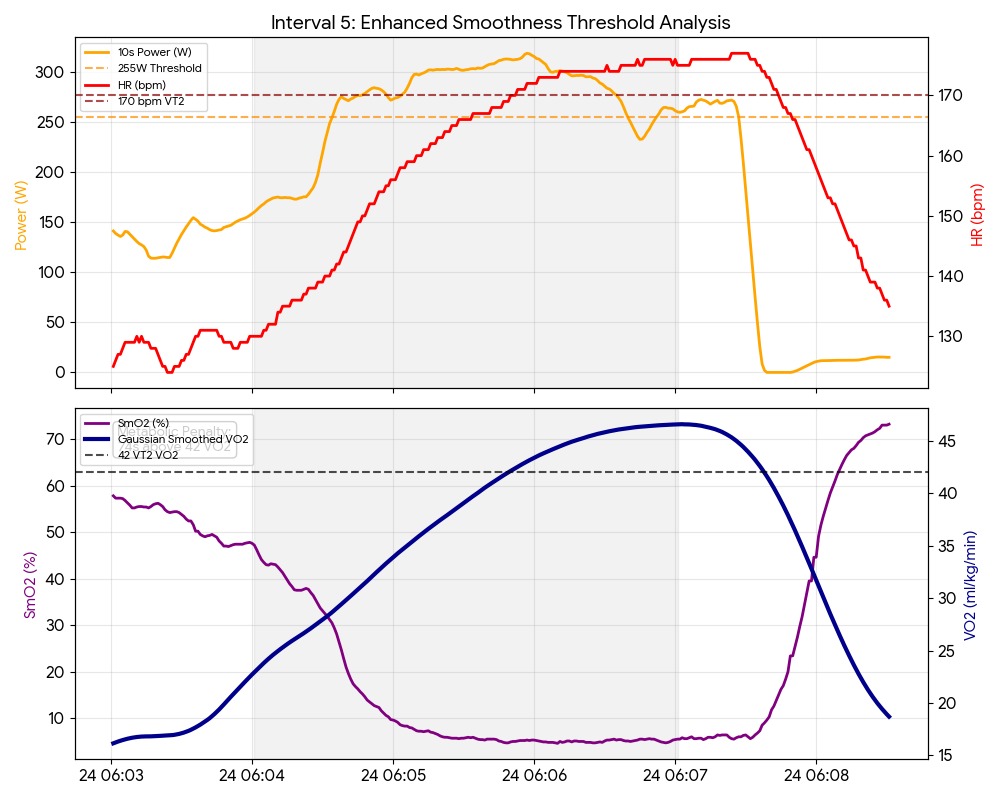
In Interval 1, the power output crosses the threshold almost immediately. However, the Vo2 takes nearly 50 seconds to catch up.
This lag is exactly what I mean by Billat 90/90 Metabolic Inertia.
Look at the end of the shaded gray blocks; the power drops instantly, but the VO_2 stays elevated. Consequently, you are still training your VO2max while coasting.
Set 1: Biomechanical & HRV
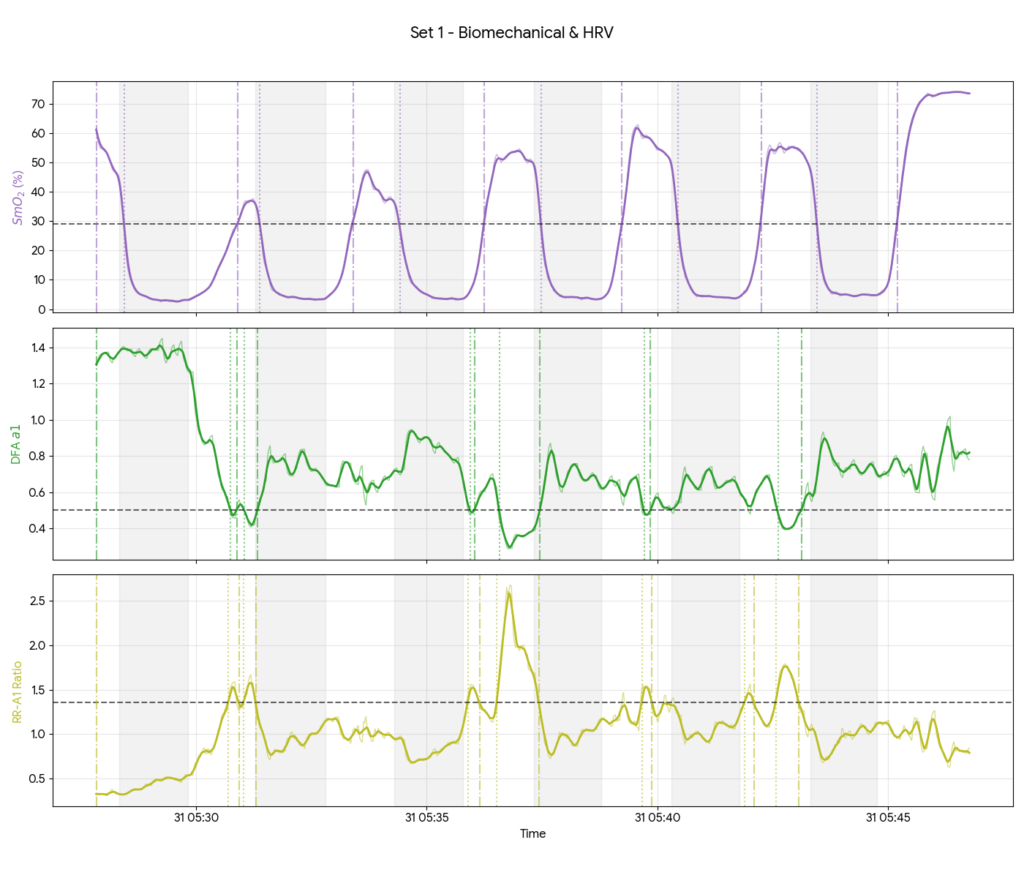
The RR-A1 Ratio serves as our primary marker for the VO_2 state. Interestingly, it mirrors the VO2 curve almost perfectly. Meanwhile, the SmO_2 data shows sheer local stress. Every time the power goes up, the muscle oxygen plunges toward $2\%$. Furthermore, the dotted entry lines show how quickly the muscle desaturates compared to the slower lung response.
Set 2 Analysis: The Priming Effect
By the time we reached Set 2, the “staircase” had been replaced by a high-altitude plateau. The metabolic system was now fully primed for effort.
Set 2: Metabolic & Power
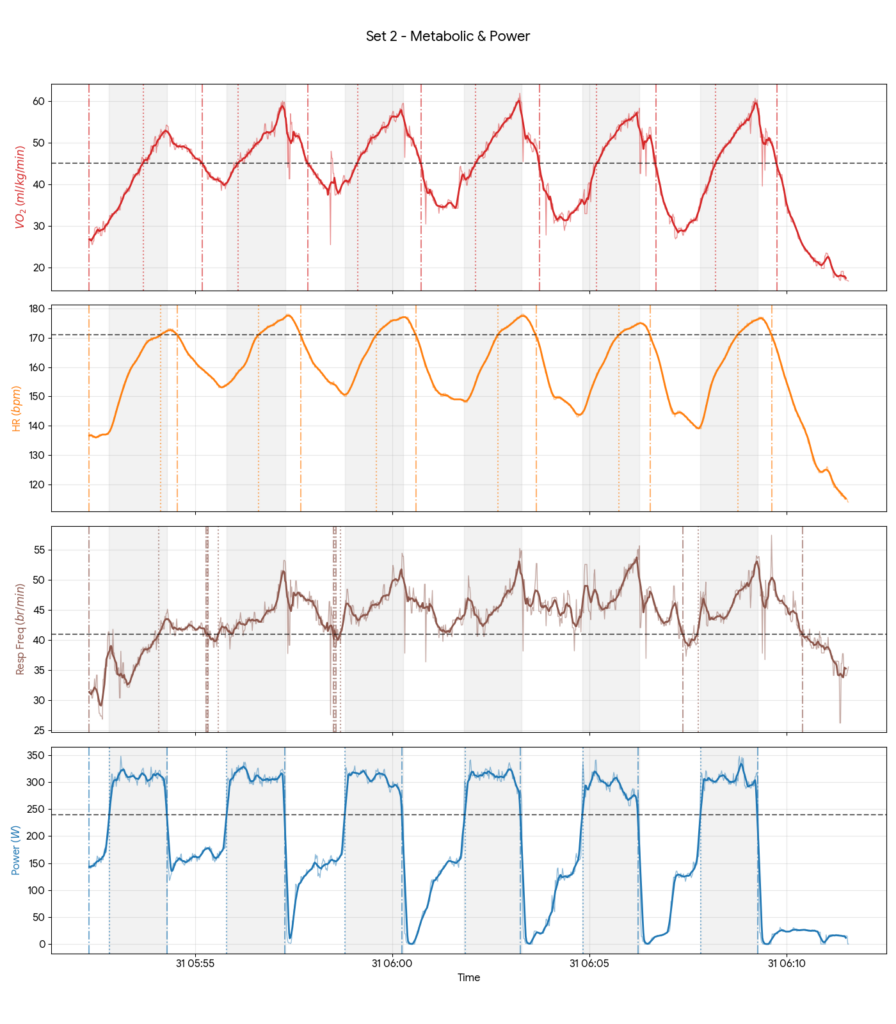
In this set, the inertia is even more dominant. Because the baseline VO2 didn’t have time to fully recover, the “time to target” was much shorter. In fact, I reached the 90%+ zone in under 45 seconds.
Moreover, the “Exit Lag” remains massive. Effectively, my heart and lungs didn’t realize I was resting until the next interval had already started.
Set 2: Biomechanical & HRV
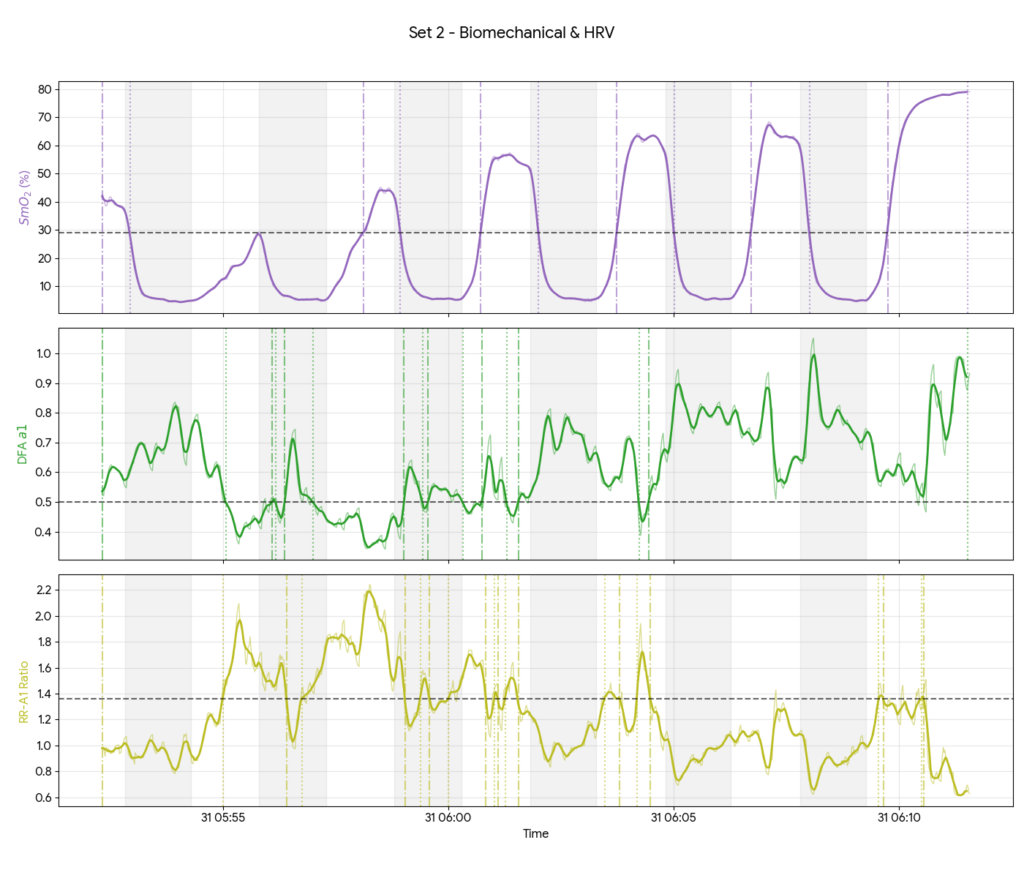
Here, the Rogers Protocol really shines. We see DFAA-11 dipping consistently below 0.50, signaling high autonomic stress. Furthermore, the RR-A1 Ratio stays pinned near or above the 1.36 line for almost the entire set.
This confirms my status as a “Fast-Adapter”—once the engine is hot, it stays hot.
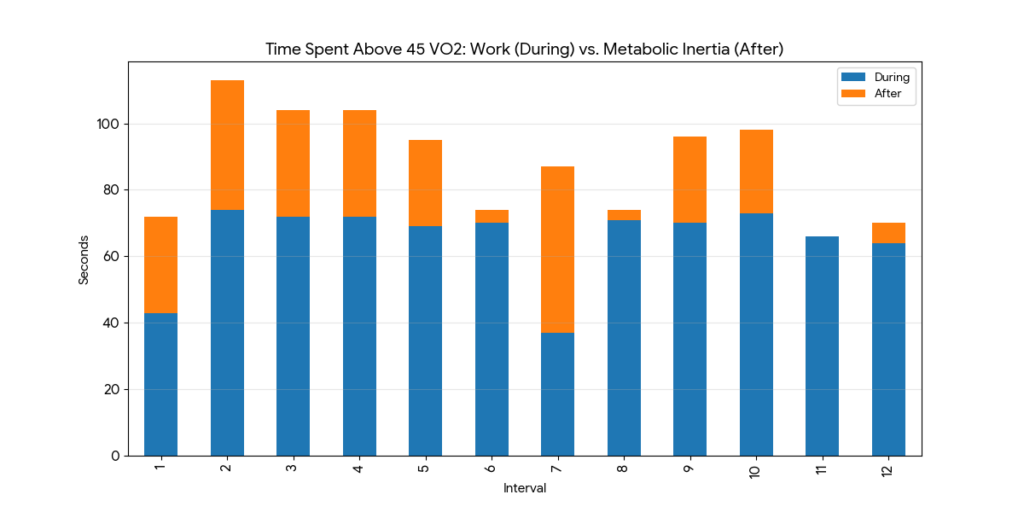
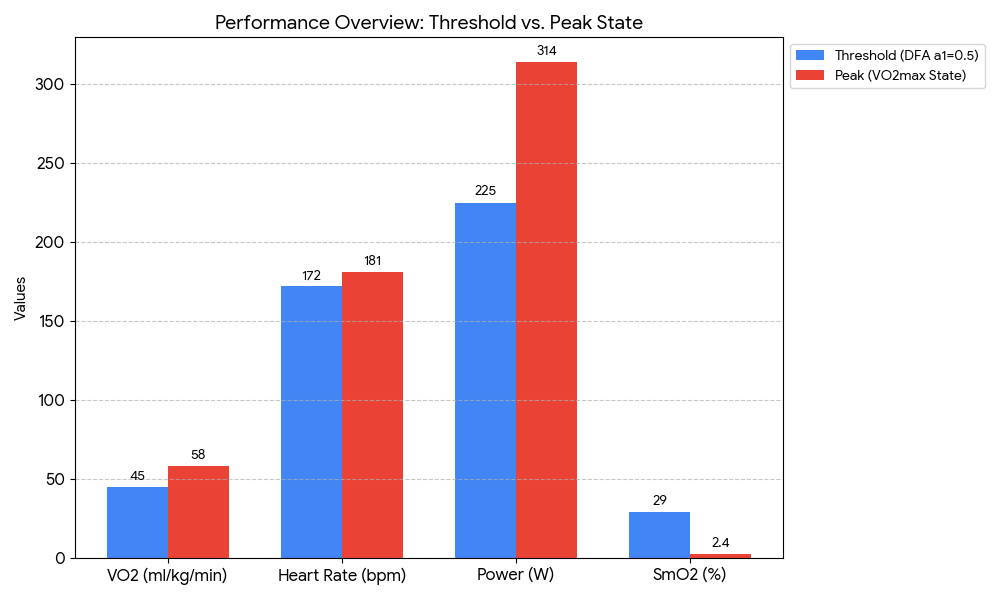
The Summary Profile
By triangulating this Billat session with the previous and work, we have a clear map of my physiological “engine.”
Conclusion: Did we hit the “VO2 State”?
The primary question was whether this protocol achieved the desired metabolic stimulus. The data confirms that it did. I accumulated over 24 minutes above a Vo2 of 42ml/kg/min, and over 10 minutes at or above a Vo2 of 51 (my new 90%!). Most importantly, over 4.5 minutes of that work was achieved during “recovery” due to Billat’s 90/90 Metabolic Inertia.
Ultimately, this proves that “rest” is a relative term.
By using the VO2master and Moxy to track these lags, we can stop training for average power and start training for total metabolic time-at-tension.
Living in the parabolas isn’t easy, but it is undoubtedly where the growth happens.