Garmin Guru: Why Your Ride Starts at 10 PM
By Coach Wharton | Release Date: April 19, 2026
Garmin Guru insights reveal that in the League of Garmin, we don’t just track miles; we track the internal cost of those miles. To master your performance, you must look past surface-level metrics and understand how the entire Garmin ecosystem tells a holistic story about your physiology.
Today’s case study: Why the most important data point for my Monday session wasn’t my wattage, but the 37 times I tossed and turned the night before.
Part 1: The Garmin Guru Go/No-Go Decision
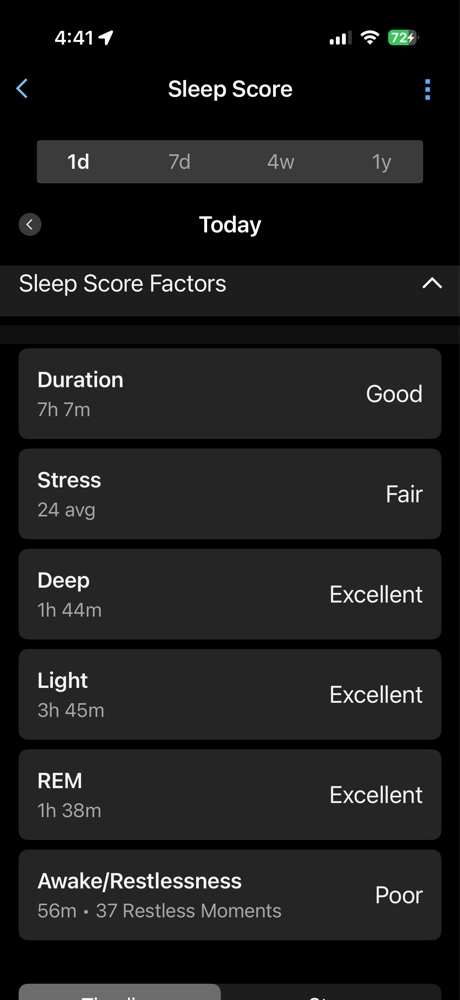
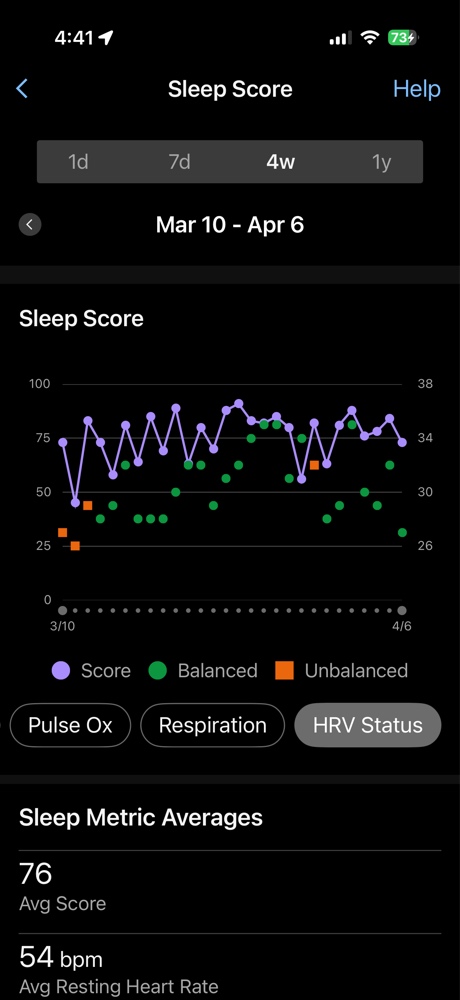
Every morning, the Garmin Connect app delivers the “Morning Report,” and today’s was a textbook “Yellow Light.” My Garmin wearables flagged a Sleep Score of 73 (Fair).
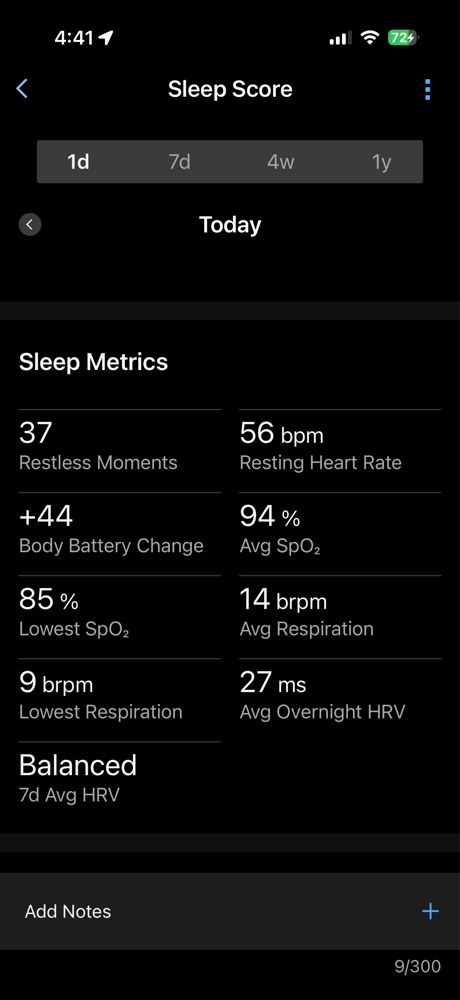
While my sleep stages (Deep and REM) were technically “Excellent,” the Garmin ecosystem caught the nuance: 37 Restless Moments and an “Interrupted” status. My Body Battery only recharged to +44, and my Overnight HRV sat at a modest 27 ms.
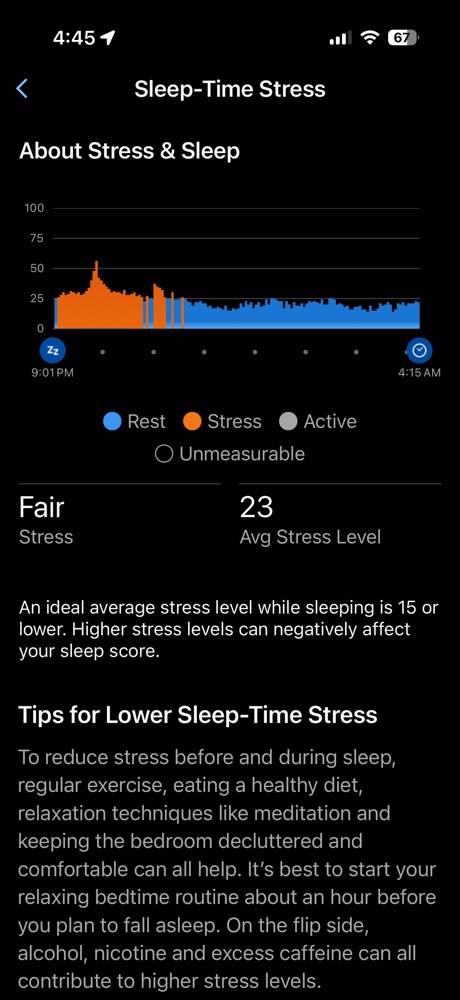
The Data Deep-Dive: Specifics of a Restless Night
The 28-Day Perspective: Context is King
If you want to dive deeper into how these metrics are calculated, check out my full guide on Garmin Sleep Scores for athletes. As a Garmin Guru, I don’t just look at today; I look at the trend.
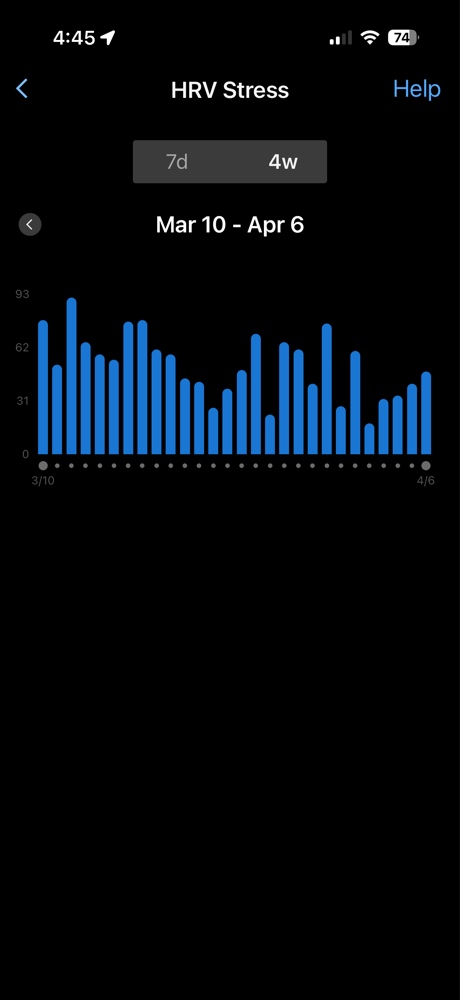
The Guru’s Recommendation: In a “Physiology First” framework, this data dictates a pivot. Your brain might feel recovered, but a high restlessness count means your nervous system is still “hot” from previous stress. For more on the specific 3-minute check I use, see my post on Measuring HRV Stress with Garmin. Skip the intervals; opt for a steady-state aerobic base ride.
Part 2: Verifying Recovery in the Garmin Ecosystem
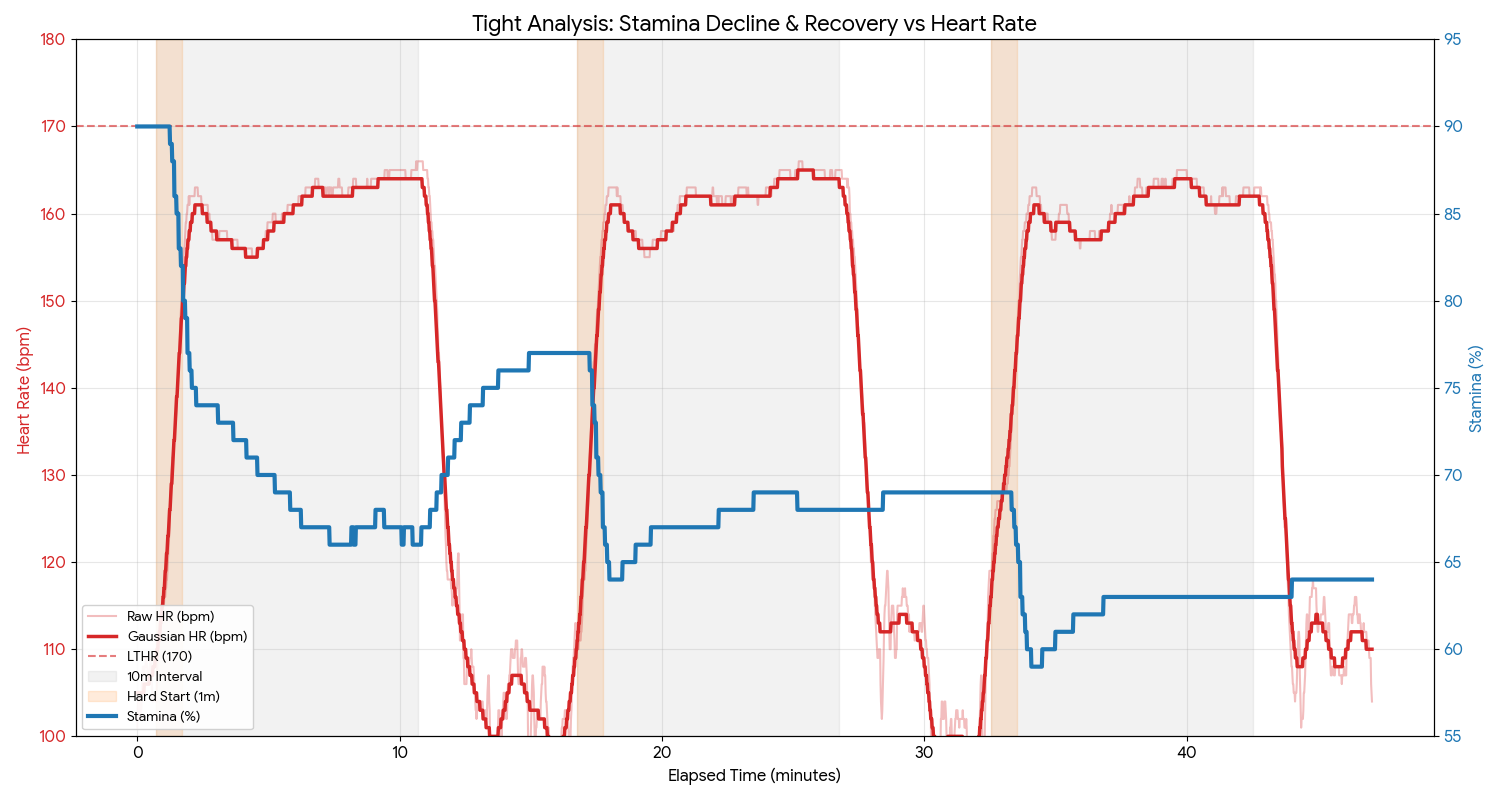
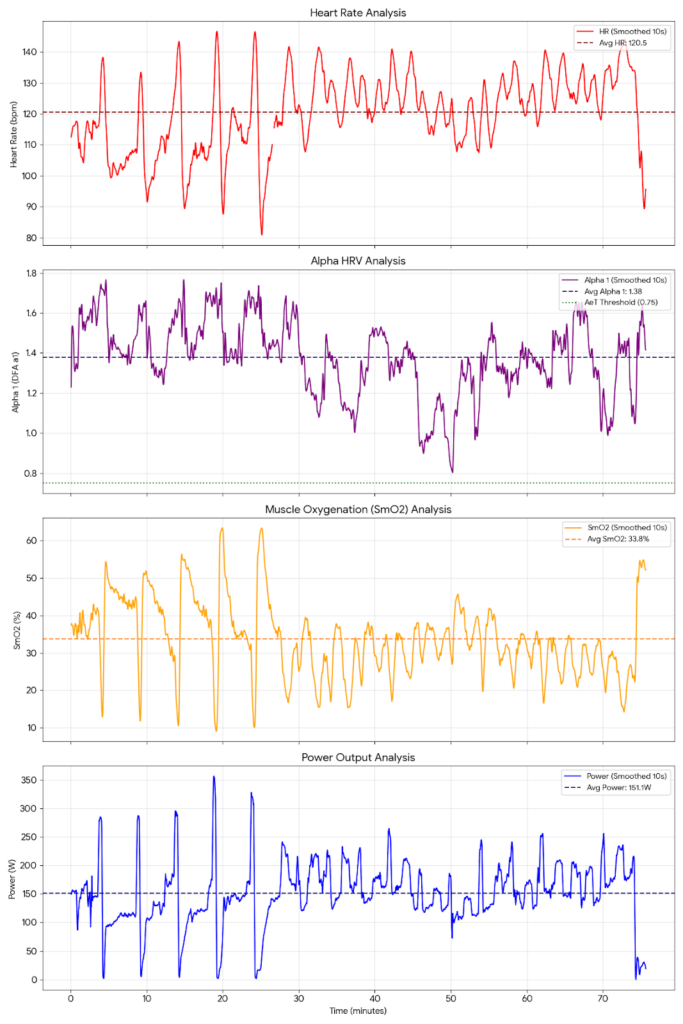
To be effective as a Garmin Guru, you have to use the right tools for verification. I took this ride to the trainer for a controlled base session (0-1% slope) and integrated real-time Alpha HRV (DFA a1) and SmO2 sensors via Connect IQ data fields.
Alpha HRV (DFA a1): The Gold Standard
The real star of the Garmin ecosystem integration is the Alpha HRV data. A value above 0.75 indicates you are below your first Aerobic Threshold (AeT)—staying “additive” to fitness, not “subtractive” from recovery.
The Guru Data Point: My ride average Alpha 1 was 1.38.
Averaging 1.38 proves that despite the restless night, my heart was under virtually zero metabolic stress. My Garmin wearables correctly identified that I had the aerobic capacity for this workload, provided I kept the intensity capped. Combined with a responsive SmO2 average of 33.8%, the data confirms the mission was a success.
Part 3: Conclusion – The League of Garmin Advantage
The biggest takeaway for anyone in the League of Garmin is this: Your ride begins the night before. Without the data from my Garmin wearables, I might have forced a high-intensity session, ignored the restlessness, and watched my Alpha 1 crash—effectively digging a recovery hole that would last all week.
For an official breakdown of how Garmin interprets these factors, you can explore the Garmin Sleep Score and Insights support documentation.
The Garmin ecosystem provides the most holistic, safe, and effective approach to performance because it bridges the gap between how you feel and how you are actually functioning. True “Physiology First” training means trusting your Garmin Connect metrics to guide your intensity.